Hello fellow traders, in this technical blog we’re going to take a quick look at the short term structure of Facebook’s shares price.
Facebook began selling stocks to the public in May 2012, as a part of Nasdaq stock exchange with initial price of $38 per share. Eventyaly, the market developed a strong, 3-year-old bullish trend, where every pull back kept finding buyers at 23%-38.2% Fibonacci retracement area against the all-time lows. Today Facebook is the most popular social networking site in the world based on the number of active user accounts with current market price of $116.95 per share.
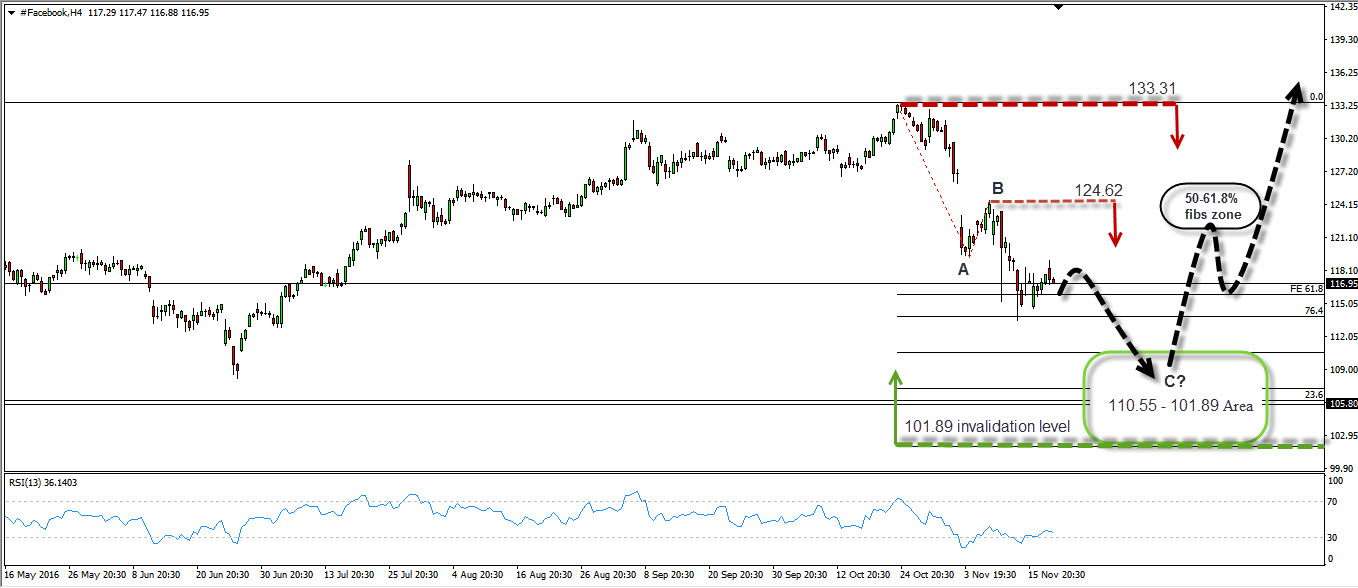
The chart below presents potential short term scenario
Facebook 4h Elliott Wave Analysis

In general, weekly trend remains bullish. There are no confirmations yet that large cycle has ended and decline from the November 24th high looks like it can be unfolding as a classic Elliott Wave ABC correction.So, as of right now Facebook remains buy in a dip. However, looking at the shorter term cycles, we see that current pull back from the 133.31 (10/24) peak is having incomplete swings sequences, suggesting another leg lower would be ideal to complete the correction. While the price holds below 124.62 high from November 8th, Facebook has potential to make another swing down toward 110.55-101.89 technical area before buyers appear again. Mentioned area matches with 23.6 fib retracement (106.1) from the all-time low which is also going to act as a support and we should see either rally toward new highs ideally or 3 wave bounce against the 10/24 peak at least.
Keep in mind that market is dynamic and the view could change in mean time. Success in trading requires proper risk/money management, so does understanding of Elliott Wave theory, Cycle and Correlation analysis.
Through time we have developed a very respectable trading strategy which defines Entry, Stop Loss and Take Profit levels with high accuracy and allows you to make position Risk Free, shortly after taking it, protecting your account. If you want to learn all about it and become a professional Trader, sign up now and get 14 DAYS FREE TRIAL .
You will get access to Professional Elliott Wave analysis in 4 different time frames, Strategy of the Day/Week Video, Live Trading Room, 2 live Analysis Session done by our Expert Analysts every day, 24 Hour Chat Room support, Market Overview, Weekly technical videos and much more…
Welcome to Elliott Wave Forecast!
Back


