Hello fellow traders. In this technical blog we’re going to take a quick look at the another nice trading opporunity we have had lately. The instrument we traded is $CHFJPY. In further text we’re going to explain price structure and reasons why we forecasted the decline. Let’s start explanation by taking a look at past Elliott Wave charts of CHFJPY published in members area of www.elliottwave-forecast.com.
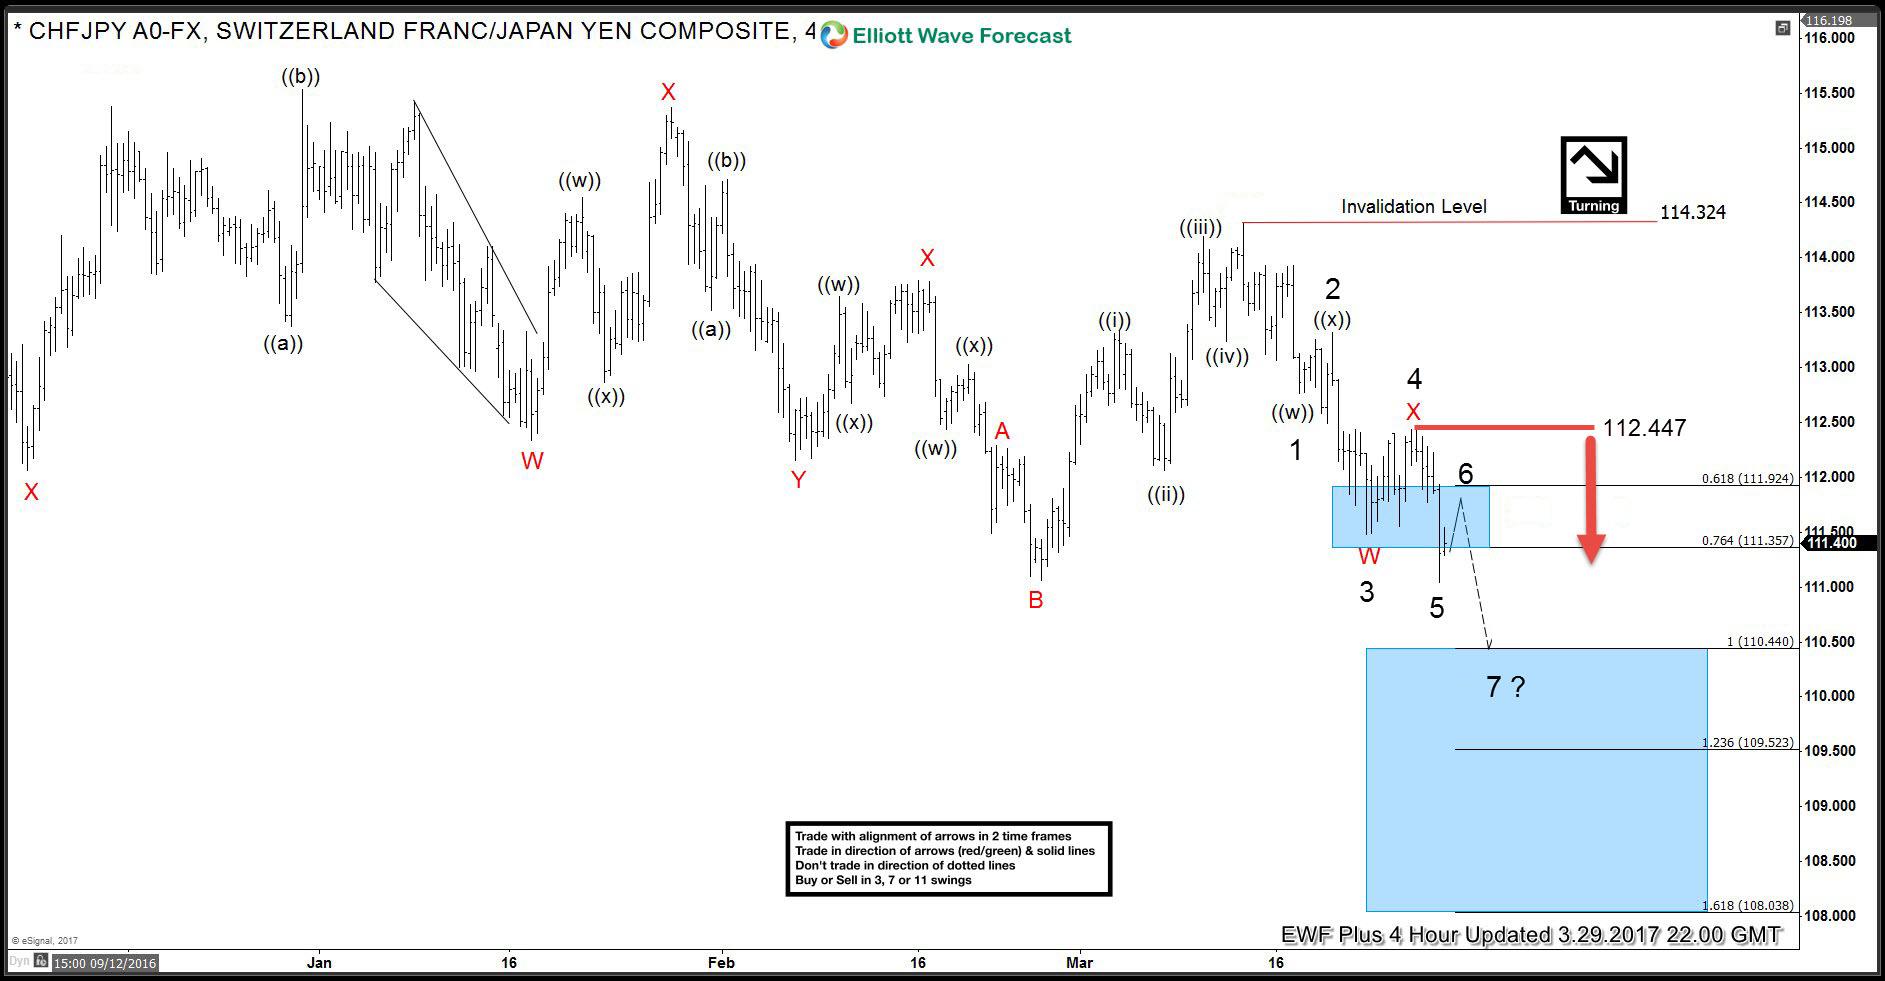
CHFJPY Elliott Wave 4 Hour Chart 29 March 2017
We see decline from the 114.32 peak is showing incomplete bearish swings sequences calling for further decline. So far we have got 5 swings, expecting 6th swing as bounce against the 112.447 peak. Once proposed 6th swing completes we should ideally get at least another leg down in 7th swing. It’s ideally targeting 110.44 area and as far as pivot at 112.447 high remains intact that area can be reached.
Now let’s take a look at the short term structure.
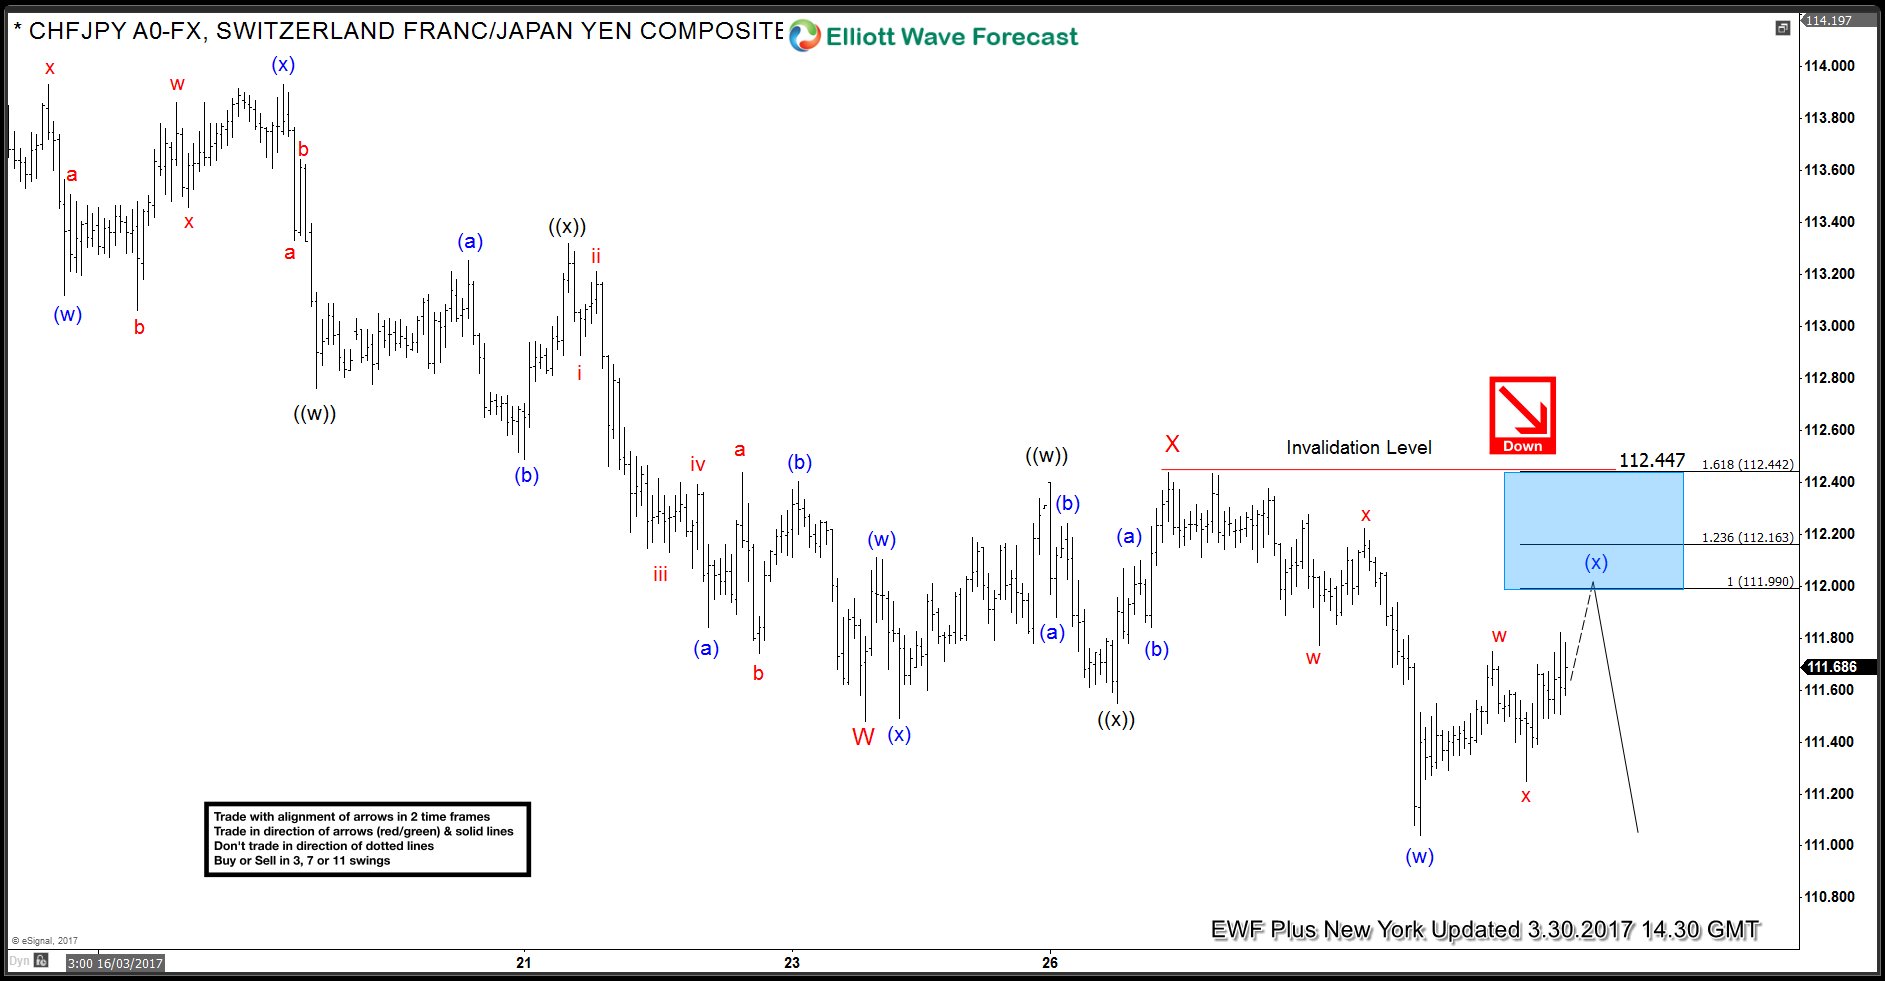
CHFJPY Elliott Wave 1 Hour Chart 30 March 2017
The pair is bearish against the 112.447 peak. Seems like it’s doing (x) blue recovery as double three elliott wave structure. We expect it to complete at 111.99-112.16 ( selling area). Wave (x) blue is either 6th swing or still part of 5th swings. Anyway, as we’re alway trading in direction of the larger trend, we advised our members to avoid buying it and keep selling the rallies against the 112.44 peak.
Eventually, the price has reached our blue box at 111.99-112.16, complete (x) blue bounce there and make decline toward new lows. Most of our members are now within risk free positions and probably some of them have already booked partial profits. At this stage the price hasn’t reached the target at 110.44 yet. As far as pivot at 112.447 high stays intacted we can get new trading opportunities.
However, keep in mind market is very dynamic and the view could have changed in a meant time. If you’re interested in new Elliott Wave analysis of CHFJPY you can find them in the membership area of EWF. We cover 52 instruments in total. If not a member yet, Sign Up for Free Trial now and get new trading opportunities.
Elliott Wave Forecast
Through time we have developed a very respectable trading strategy which defines Entry, Stop Loss and Take Profit levels with high accuracy and allows you to make position Risk Free, shortly after taking it. If you want to learn all about it and become a professional Trader, join us now for Free.
Back


