In this technical blog, we are going to take a look at the past performance of 1 hour Elliott Wave charts of Exxon Mobil ticker symbol: XOM, which we presented to members. But before digging further into the Charts, we need to understand the market nature first. The market is always a fight between the two sides, Buyer and Sellers. We at elliottwave-forecast.com understand the Market Nature and always recommend trading the no-enemy areas.
There are always areas where both sides, Buyers and Sellers agree into a move. We called these no-enemy areas which are reflected as blue box areas on our Charts, which gave us the reaction in favor of market direction in 3 swings at least. Now, let us take a look at the decline from 4/23/2019 peak ( $83.49 ) unfolded in 5 waves impulse structure and ended wave 1 at $75.17 low. Up from there, the stock was expected to fail in 3, 7 or 11 swings within wave 2 bounce for another 5 waves extension lower at least. We will explain the structure below
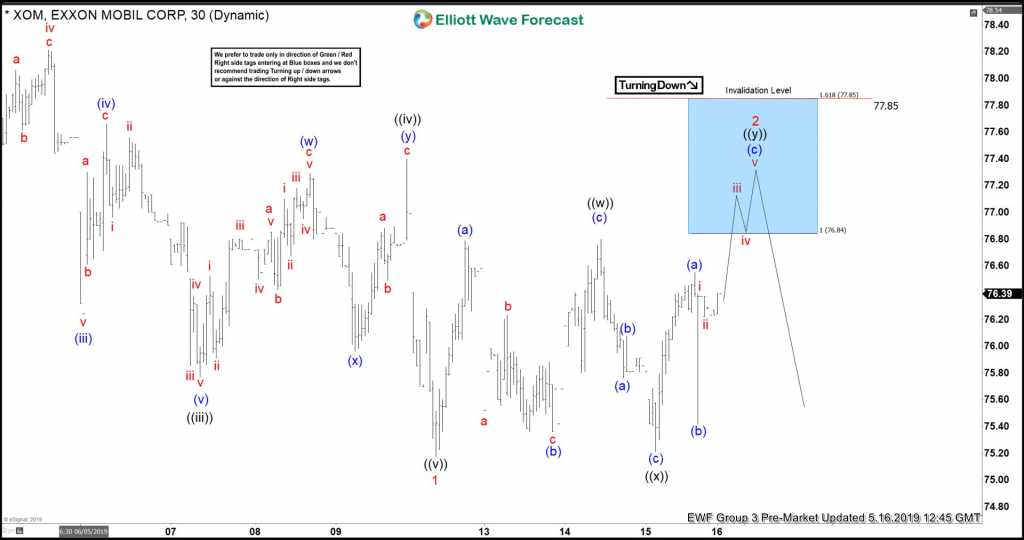
XOM 1 Hour Elliott Wave Chart From 5/16/2019
Up from $75.17 low, the bounce in wave 2 unfolded as Elliott wave double three structure where wave ((w)) ended at $76.80. Wave ((x)) pullback ended at $75.21 low. And wave ((y)) was expected to reach our blue box no enemy area at $76.84-77.85 100%-161.8% Fibonacci extension area of ((w))-((x)). From there, the stock was expected to react lower either for more downside or for 3 wave reaction lower at least.
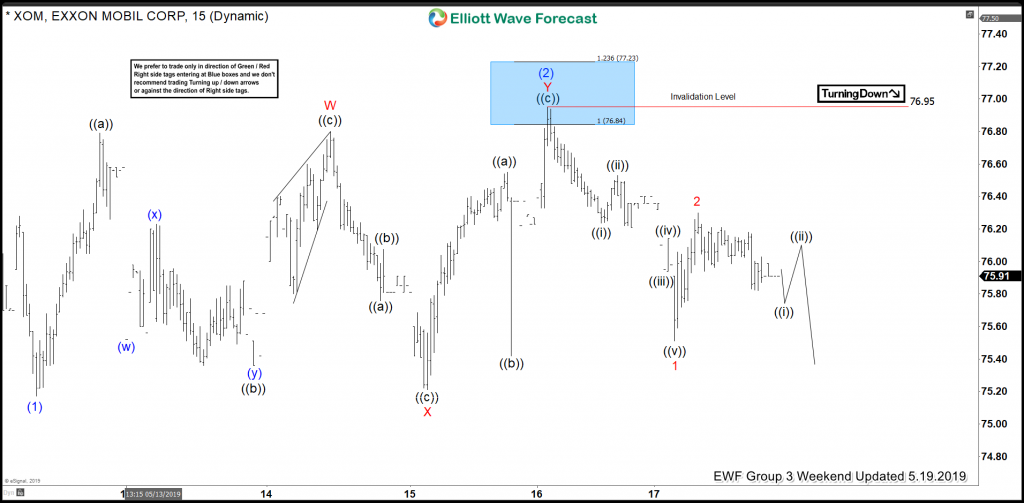
XOM 1 Hour Elliott Wave Chart From 5/19/2019
XOM 1 hour Elliott wave Chart from 5/19/2019 weekend update, in which the stock reaches the no enemy area at $76.84-77.85 and reacted lower in favor of turning right side arrow, allowing any shorts to go into risk-free position. The decline from $76.95 unfolded in another lesser degree 5 waves structure, which ensured us that any strength would be temporary & stock should see more downside against that peak. Also, it’s important to note that we switched the degree of labeling into intermediate degree cycles based on our correlation & distribution system.
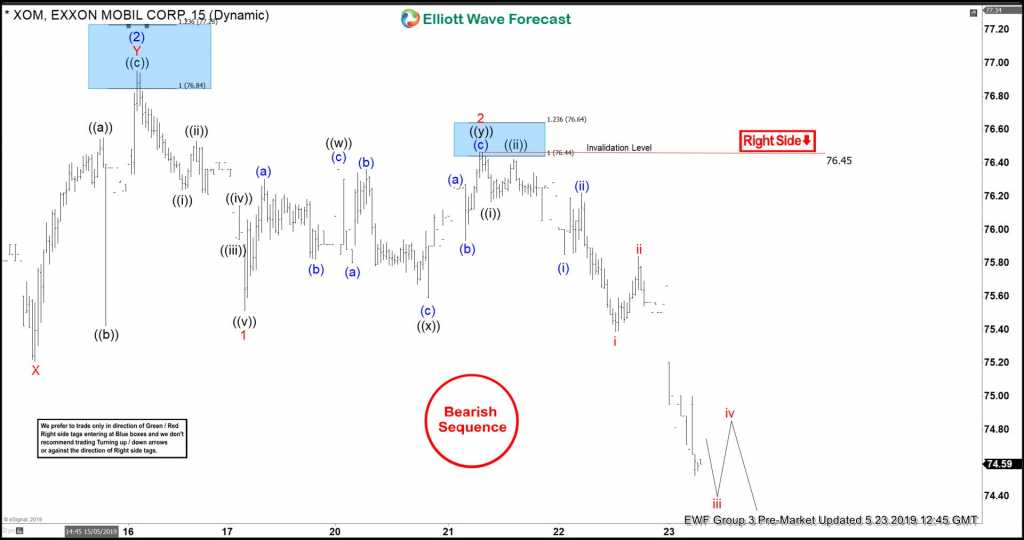
XOM Latest 1 Hour Elliott Wave Chart From 5/23/2019
Here’s the latest 1-hour view of XOM from 5/23/2019 Pre-Market update, in which the stock is showing a strong reaction lower as we anticipated by breaking below the $75.17 low. Now looking for more downside, as far as bounces fail below $76.45 high as both right side tag & bearish sequence tag are pointing lower.
If you want to see more real-time analysis & want to trade blue boxes & no enemy areas in XOM & other Stocks n ETF’s then join us with Memorial day promotion now and avail 50% discount on any plan your choice.
Keep in mind that the market is dynamic and the view could change in the meantime. Success in trading requires proper risk and money management as well as an understanding of Elliott Wave theory, cycle analysis, and correlation. We have developed a very good trading strategy that defines the entry. Stop loss and take profit levels with high accuracy and allows you to take a risk-free position, shortly after taking it by protecting your wallet. If you want to learn all about it and become a professional trader. Then join our service by taking a Memorial Day Promotion.
Back


