Xiaomi Inc. is a Chinese designer and manufacturer of consumer electronics and software. Behind only Samsung and since 2021 surpassing Apple, it is the second largest manufacturer of the smartphones in the world. Most of them run the MIUI operating system. It is also a major manufacturer of appliances including televisions, smartwatches, flashlights, unmanned aerial vehicles. These and other products are connected by Internet of Things (IoT) and Xiaomi Smart Home platforms. Founded 2010, it is headquartered in Haidian District, Beijing, China. International investors can trade it under the ticker $1810 at HKEX. The company is a part of Hang Seng index. Also, one can trade Xiaomi under the ticker $XIACF in US in form of ADRs. Today, Xiaomi is employing more than 33’000 people and owns such brands as Redmi, Pocophone, BrandShark among others.
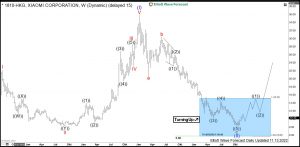
Xiaomi Weekly Elliott Wave Analysis 11.13.2022
The monthly chart below shows the Xiaomi shares $1810 traded at HKEX. From the IPO in July 2018, the stock price has developed an initial cycle higher in blue wave (I) of super cycle degree towards 35.90 all-time highs in January 2021. After the impulsive structure higher, a correction lower in blue wave (II) is unfolding as an Elliott wave zigzag pattern being 5-3-5 structure.
Firstly, red wave a of blue wave (II) has printed a low at 20.65 in March 2021. Then, a bounce has set a connector wave b at 30.45 highs in June of the same year. Later on, the price has broken 20.65 lows opening up a bearish sequence. As a consequence, red wave c should find support from 15.23-5.80 area. As a matter of fact, the price has reached that area and the RSI reading points towards idea that the entire correction as wave (II) has ended. While above the lows of October 2022 at 8.31, a new bullish cycle in blue wave (III) might have started and is now in the initial stages.
Investors and traders can be looking to buy the stock of Xiaomi from 15.23-5.80 area targeting 44.23-66.44 area and even higher in the long run.
Get more insights about Stocks and ETFs by trying out our services 14 days . You’ll learn how to trade the market in the right side using the 3, 7 or 11 swings sequence. You will get access to our 78 instruments updated in 4 different time frames, Live Trading & Analysis Session done by our Expert Analysts every day, 24-hour chat room support and much more.
Back

