SoFi Technologies, Inc., (SOFI) provides various financial services in the US, Latin America & Canada. It operates through three segments; Lending, Technology Platform & Financial services. It is based in San Francisco, CA, comes under Financial Services sector & trades as “SOFI” ticker at Nasdaq.
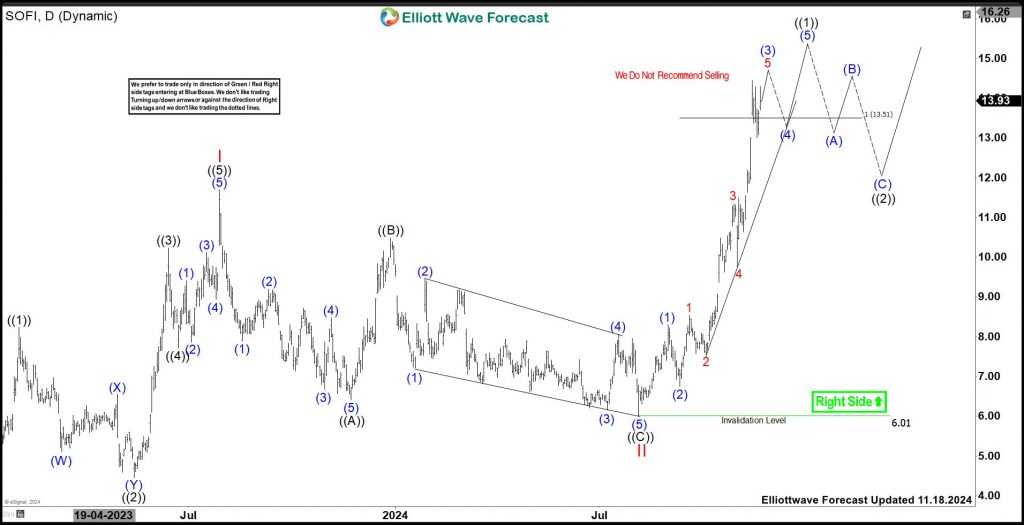
As mentioned in the last article, SOFI confirmed bullish sequence as it broke above July-2023 high. Currently, it favors upside in (3) of ((1)) & expect rally to finish sequence from August-2024 low between $13.51 – $18.13 area. Later, it should pullback in ((2)) in 3, 7 or 11 swings, which provide buying opportunity.
SOFI – Elliott Wave Latest Daily View: 
It made all time low at $4.24 in December-2022 & then resume higher. It is showing higher high sequence since December-2022 low in daily. It placed I as impulse sequence at $11.70 high & favoring upside in ((1)) of III from August-2024 low. Within I, it placed ((1)) at $8.24 high, ((2)) at 4.45 low, ((3)) at $10.23 high, ((4)) at $7.71 low & ((5)) as I at $11.70 high. Below there, it ended II as zigzag correction at $6.01 low. In II, it placed ((A)) at $6.41 low, ((B)) at $10.49 high, ((C)) at $6.01 low in August-2024 low as II.
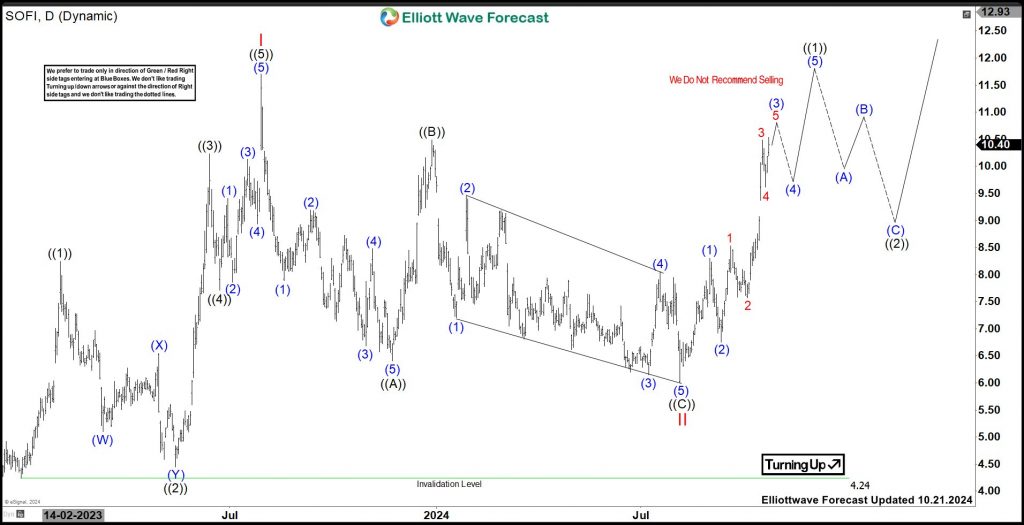
SOFI – Elliott Wave View From 10.21.2024: 
Above II low, it favors upside in (3) of ((1)) & expect small upside before it should pullback in (4). It placed (1) at $8.30 high & (2) at $6.75 low. Within (3), it placed 1 at $8.53 high, 2 at $7.57 low, 3 at $11.34 high & 4 at $9.77 low. Currently, it favors upside in 5 towards $14.79 – $15.34 area, while dips remain above $13.01 to finish (3) of ((1)) before correcting in (4). Generally, (4) should pullback between 0.236 – 0.382 Fibonacci retracement of (3) sequence before final push higher. So, extreme areas in 3, 7 or 11 swings in that zone will end (4) before resume rally in (5) to finish ((1)) as 9 swings sequence from August-2024 low. The current scenario is less bullish. If it extends higher & erase momentum divergence, then it can be nest in (3), which can extend further. So, we like to buy the next pullback in 3, 7 or 11 swings at extreme areas & avoid selling it.
Elliottwave Forecast updates 1-hour charts four times a day & 4-hour charts once a day for all our 78 instruments. We do a daily live session, where we guide our clients on the right side of the market. In addition, we have a chat room where our moderators will help you with any questions you have about what is happening in the market at the moment. You can try us for 14 days for only $9.99.
Back
