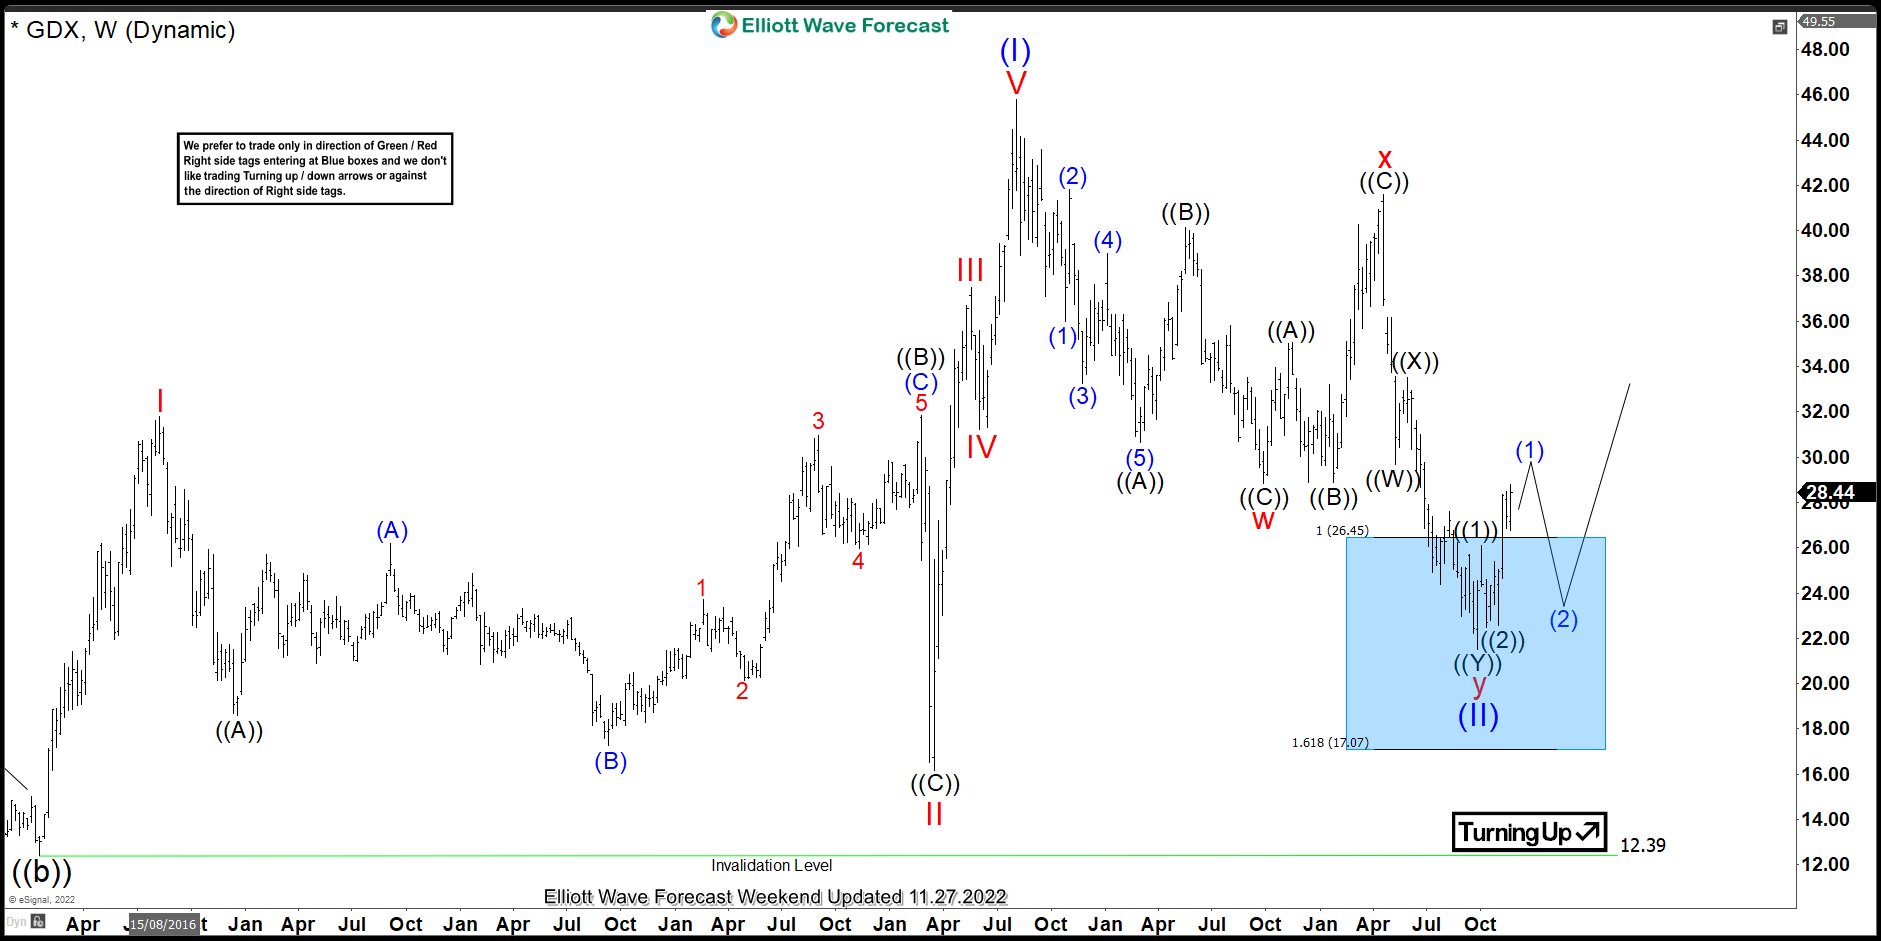
Good day Traders and Investors. In today’s article, we will look at the past performance of the Weekly Elliottwave chart of Gold Miners ETF ($GDX). The decline from 08.03.2020 high marked the end of the cycle from Jan 2016 lows. The ETF traded lower in 3 swings and bounced at red w on 09.27.2021. The bounce was a connector which found sellers on 04.18.2022 peak at red x. The decline from red x went and broke below the 09.27.2021 low at red w. Therefore, we knew that the structure in $GDX is going to trade lower towards a blue box area which will be the next big opportunity in the Weekly Timeframe. So, we advised members to buy the bounce in 3, 7, or 11 swings at the blue box area. We will explain the structure & forecast below:
Dec 2021 $GDX Favors More Downside Video:
July 2022 $GDX at the Blue Box Video:
$GDX Latest Weekly Elliottwave Chart:
Here is the 11.27.2022 Weekly update showing the move taking place as expected. The ETF has reacted higher from the blue box. Currently, the ETF has already made 5 swings from the low at (II) and expecting continuation higher to remain in place which will allow longs to get risk free very soon.
Elliott Wave Forecast
We cover 78 instruments, but not every chart is a trading recommendation. We present Official Trading Recommendations in the Live Trading Room. If not a member yet, Sign Up for Free 14 days Trial now and get access to new trading opportunities.
Welcome to Elliott Wave Forecast!
Back

