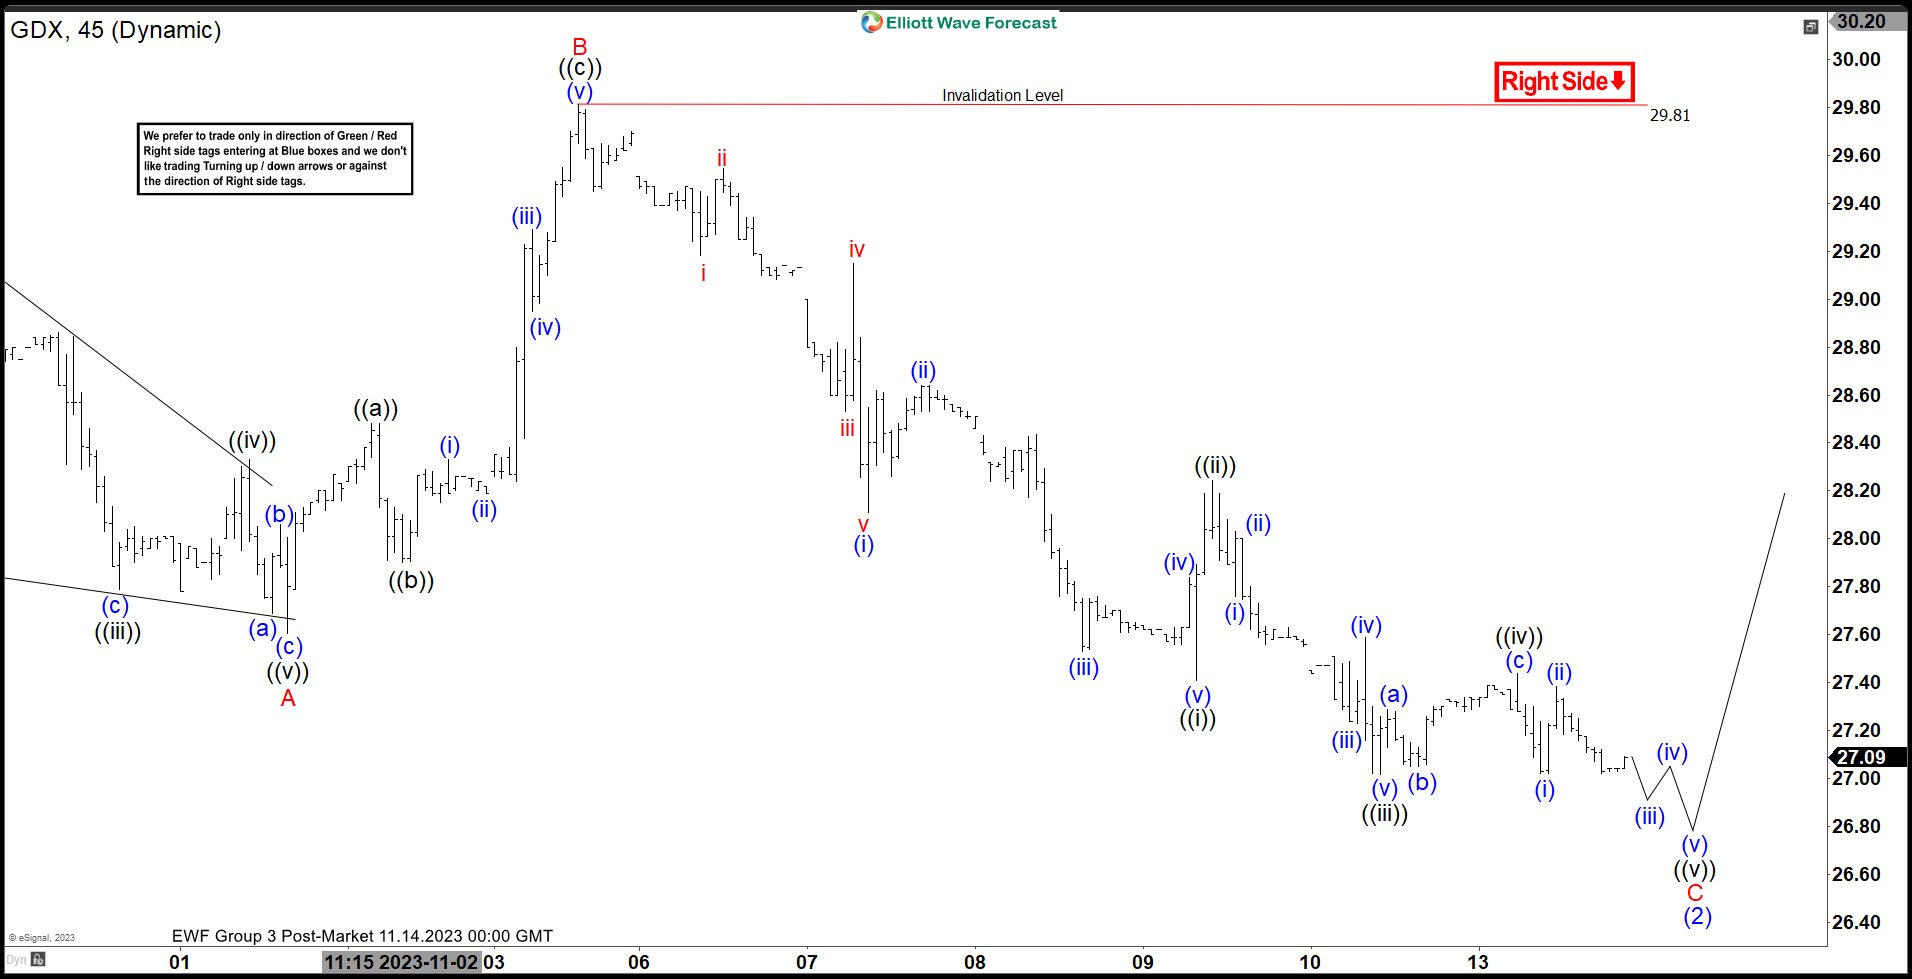
$GDX 1H Elliott Wave Chart 11.14.2023:
 Here is the 1H Elliott Wave count from 11.14.2023. We expected the pullback to find buyers at (2) in 3 swings (ABC).
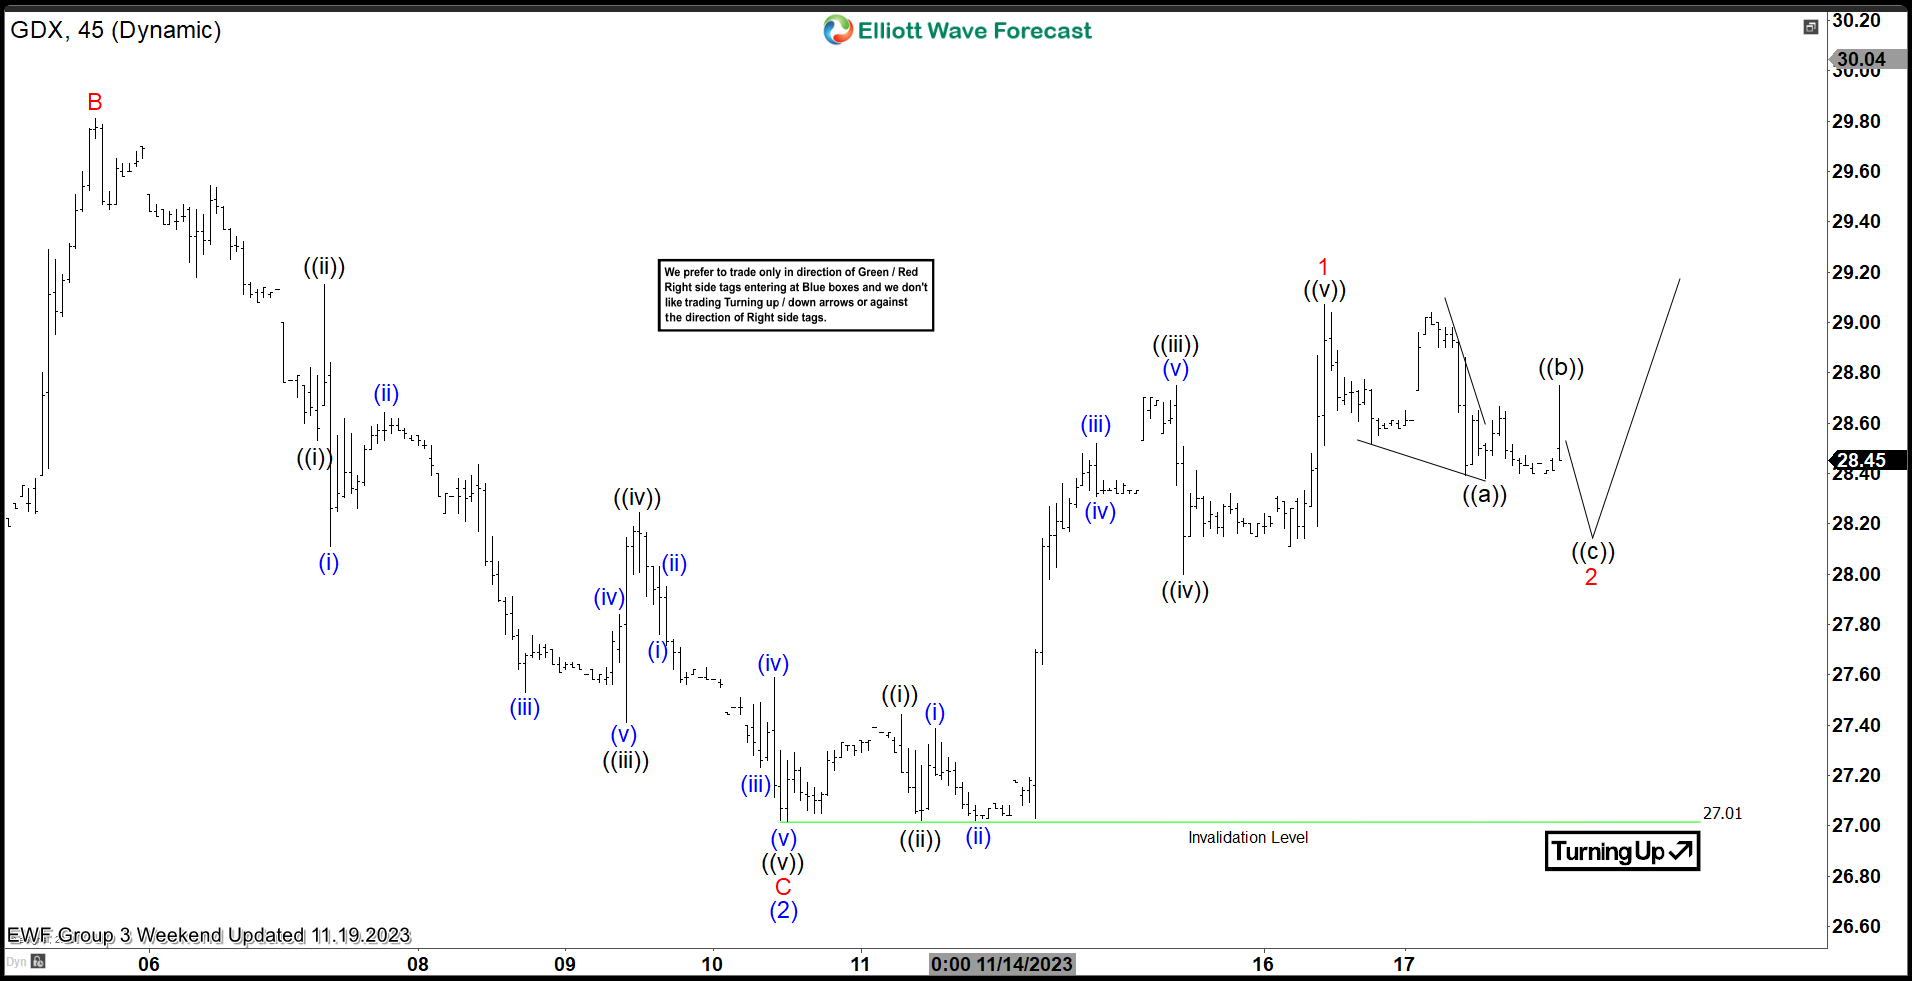
$GDX 1H Elliott Wave Chart 11.19.2023:
 Here is the 1H update from 11.19.2023 showing the bounce taking place as expected. The ETF reacted higher after reaching the equal legs area from 10.20 peak allowing longs to get a risk free position. We expect the ETF to continue higher as long as $27.01 remains intact.
Elliott Wave Forecast
We cover 78 instruments, but not every chart is a trading recommendation. We present Official Trading Recommendations in the Live Trading Room. If not a member yet, Sign Up for Free 14 days Trial now and get access to new trading opportunities.
Welcome to Elliott Wave Forecast!

