Uranium ETF (ticker: URA) spent the entire 2002 doing correction but this year it is ready to resume higher. This ETF invests in Uranium as well as several mining companies. With many countries looking for alternatives to fossil fuel, Uranium presents a viable alternative. Last year, there was a flurry of news about different countries announcing the building of new nuclear plants. Demand should pick up in the coming years. Below we will see the technical outlook of URA using Elliott Wave.
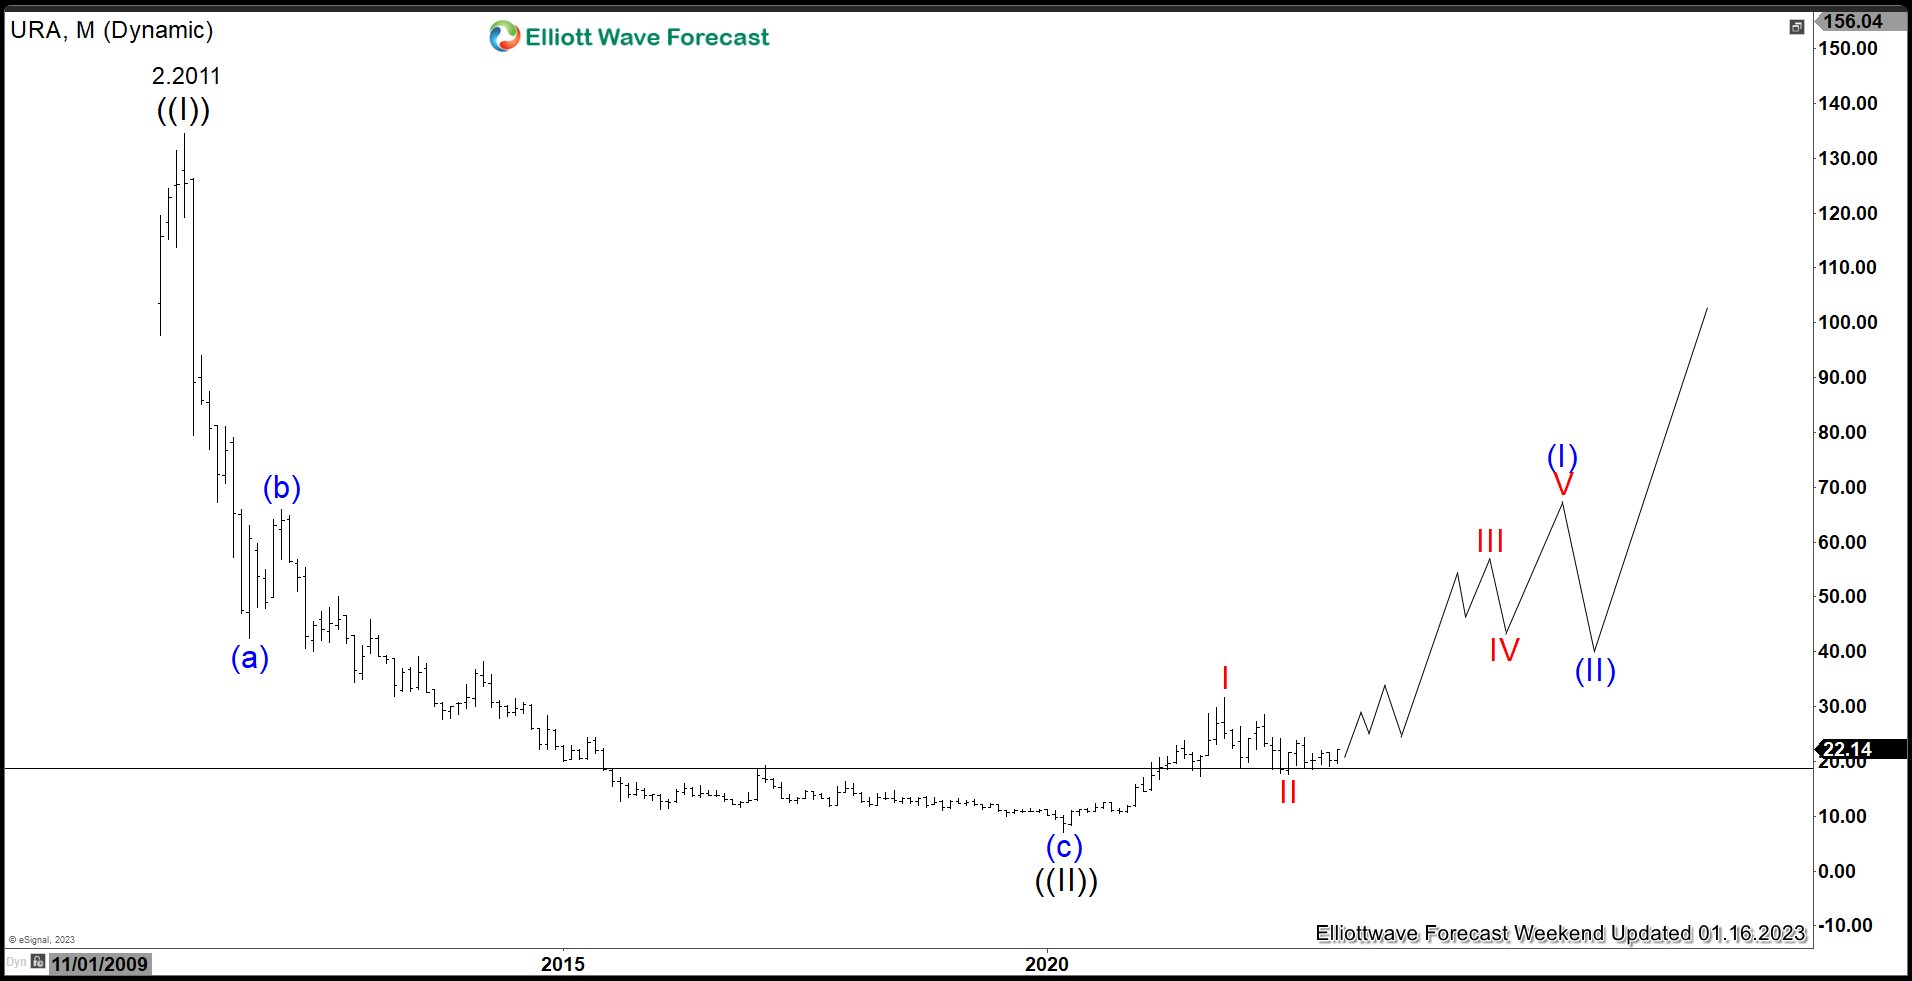
$URA Elliott Wave Chart Monthly Chart
Uranium ETF (URA) Monthly Chart above shows that the instrument has ended wave ((II)) pullback at 6.95 and now looking to do the next leg higher. Up from wave ((II)), wave I ended at 31.6 and pullback in wave II is proposed complete at 17.65. Expect the ETF to continue extending higher in wave III as far as it stays above wave II low at 17.65, and more importantly above wave ((II)) low at 6.95.
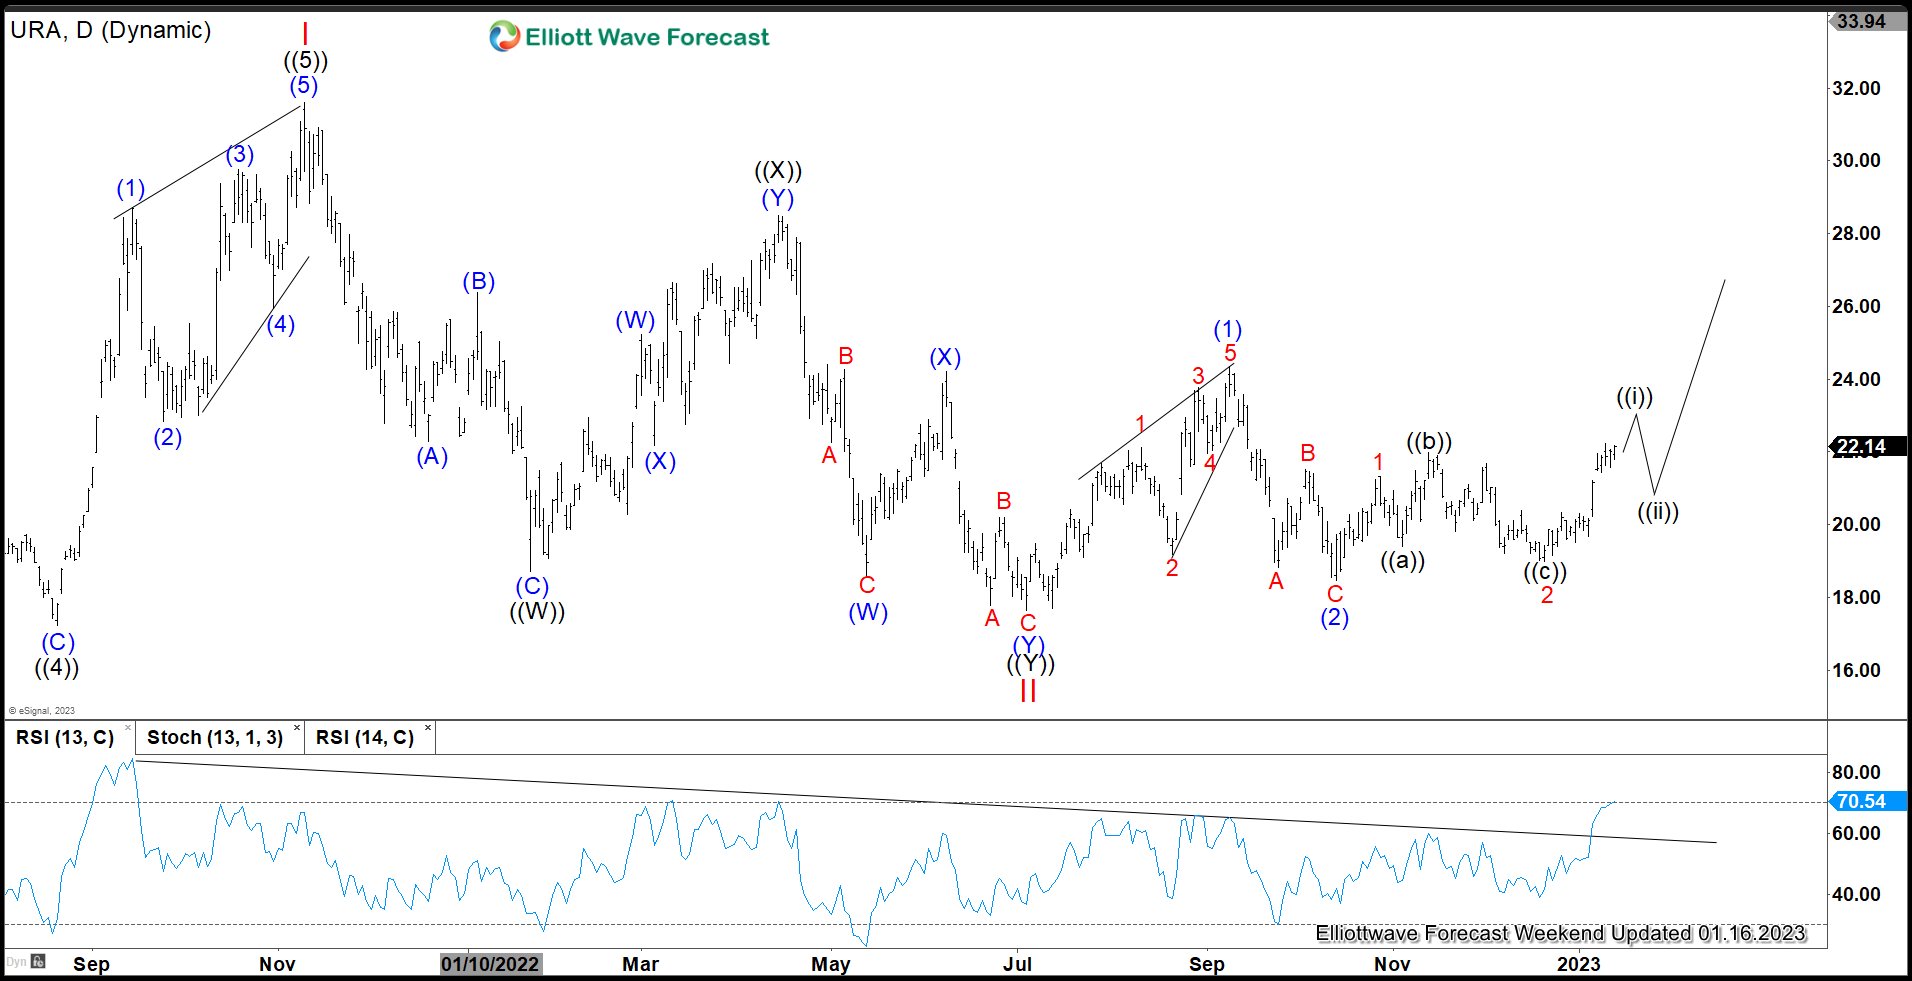
$URA Daily Elliott Wave Chart
Daily Elliott Wave Chart of Uranium ETF (URA) above shows that wave II has ended at 17.65 and the ETF has started to turn higher in wave III. Up from wave II, wave (1) ended at 24.34 and pullback in wave (2) ended at 18.47. Wave (3) higher is in progress with internal subdivision as another impulse in lesser degree. Up from wave (2), wave 1 ended at 21.33 and pullback in wave 2 ended at 19. Near term, expect the ETF to extend higher in wave 3 or (3).
Our service covers various financial instrument including forex, Indices, stocks, ETF, commodities, and crypto-currencies. If you’d like to get regular technical forecast, you may try our service here –> 14 days Trial
Back


