Hello Traders, in this article we will analyze the Weekly cycle of TSLA ( Tesla ) and explain how might be calling for new highs. Tesla, Inc is an American multinational automotive and clean energy company headquartered in Austin, Texas. It designs and manufactures electric vehicles (electric cars and trucks), battery energy storage from home to grid-scale, solar panels and solar roof tiles, and related products and services. Tesla is one of the world’s most valuable companies and, as of 2023, is the world’s most valuable automaker.
Incorporated in July 2003 by Martin Eberhard and Marc Tarpenning as Tesla Motors. The company’s name is a tribute to inventor and electrical engineer Nikola Tesla. In February 2004, via a $6.5 million investment, Elon Musk became the largest shareholder of the company. He has served as CEO since 2008.
Specifically, Tesla Stock ended the first leg of its Super Cycle back on 11.04.2021 following by an expected pullback. For each cycle or grand super cycle there is an end. A pullback needs to take place before any possible further continuation higher.
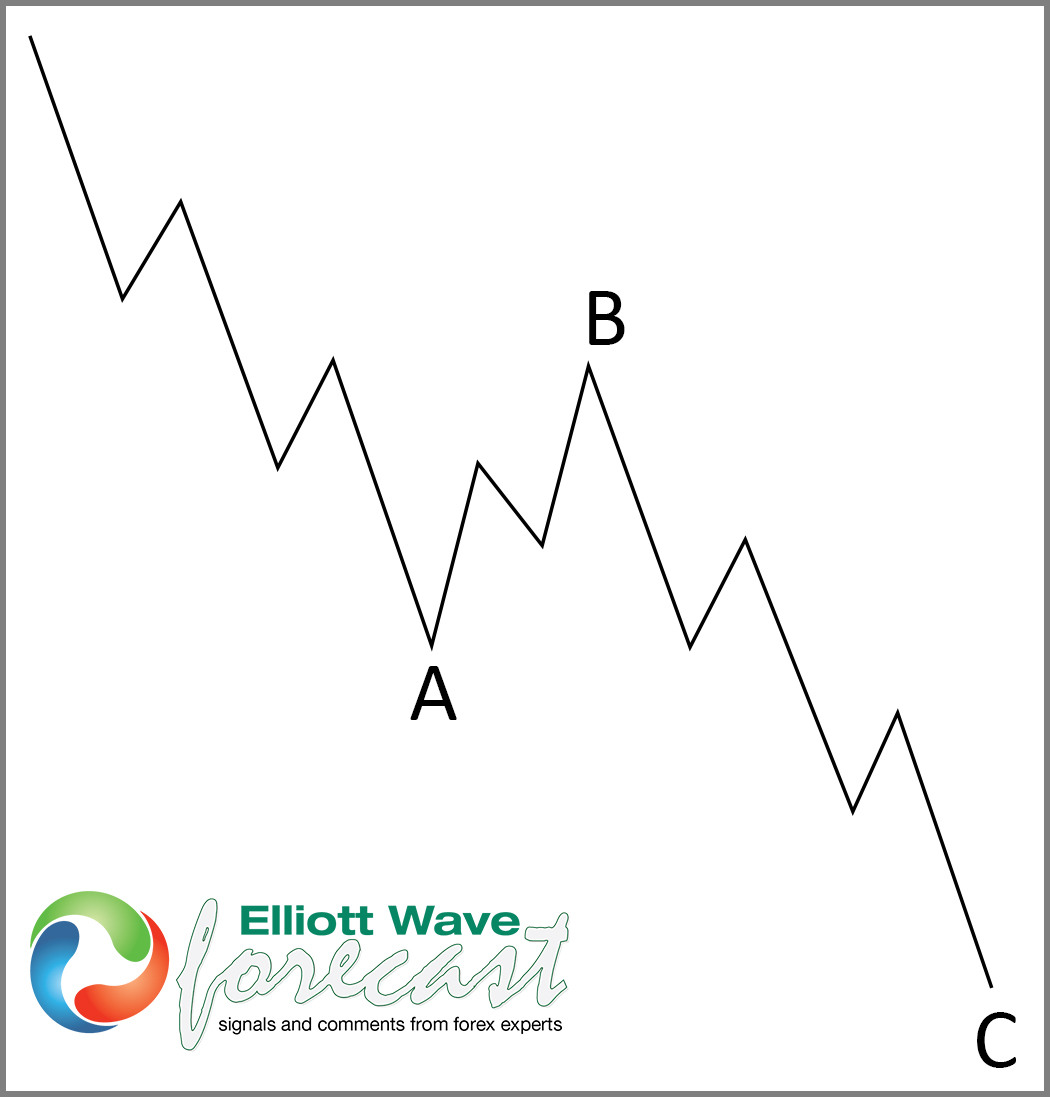
In TSLA, wave (I) ended at 414.33 from the all time lows since it has been listed in the stock exchange in 2010. The pullback came in the form of a Zig Zag (5-3-5). The Guidelines in Elliott Wave for the Zig Zag suggests that is a corrective 3 waves structure labelled as ABC with a subdivision of wave A and C is 5 waves, either impulse or diagonal. And wave B can be any corrective structure. Here’s how it looks:
Elliott Wave Zig Zag (5-3-5)
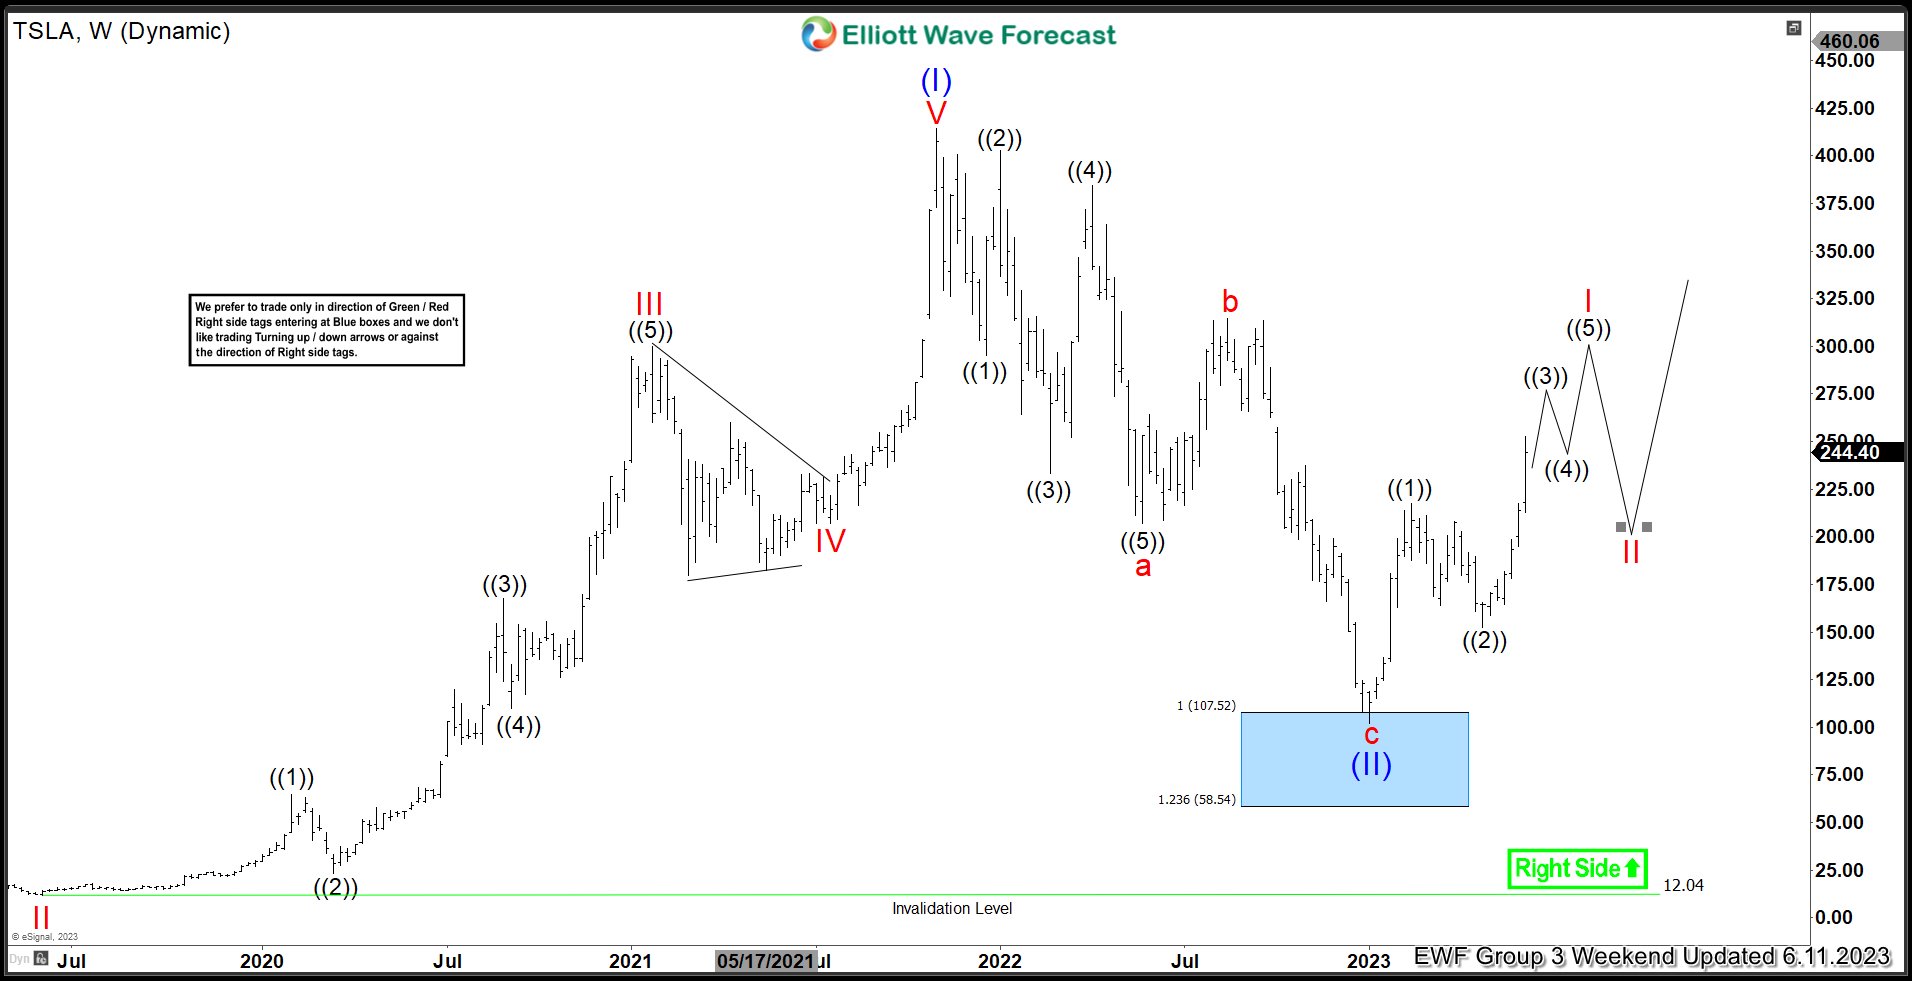
Let’s have a look now at TSLA weekly chart and analyze the move alongside what could be happening next.
TSLA Weekly Weekend Update 06.11.2023
Once ended the connector b wave within (II) we where able to present to our members the weekly blue box area. Between $107.52 – $58.54 area we were expecting it to end c of (II). Since the low from January 2023 at $101.82 the reaction looks impulsive and currently within it’s wave ((3)). Soon to be entering into a series of ((4)) and ((5)) before ending the first leg I higher. Furthermore the view is supported by correlating it with other Stocks or Indices as well.
Additionally, overall the stock should see further upside longer term and the wave (III) within the super cycle & may lead to much higher prices than 2021. Members of Elliott Wave Forecast that bought the stock within the blue box area are now risk free. The area may have provided a generational buying opportunity for the next couple of years.
You can learn what are the levels Tesla stock is heading towards and how we see the bigger picture by joining us at Elliott Wave Forecast. Learn how to trade or invest instruments at blue boxes and find potential long term trading ideas. Tesla belongs to our Group 3 amongst other Stocks and ETFs.
Become a member and improve your trading/investing decisions. Alongside with daily Live Analysis Sessions and Live Trading Room. On top of that we have a 24 hour live chat and chat room in which we answer any questions for each instrument. Click the links below to sign up or try first our 14 day trial.
Become a member today at: Elliott Wave ForecastElliott Wave Forecast Trial Plan Page
Or for a 14 day trial:


