TESLA (NASDAQ:TSLA) shares spiked 7% higher today before closing the day at $268 same level as late March of last year. What’s hiding behind the move and can investors be relieved ?
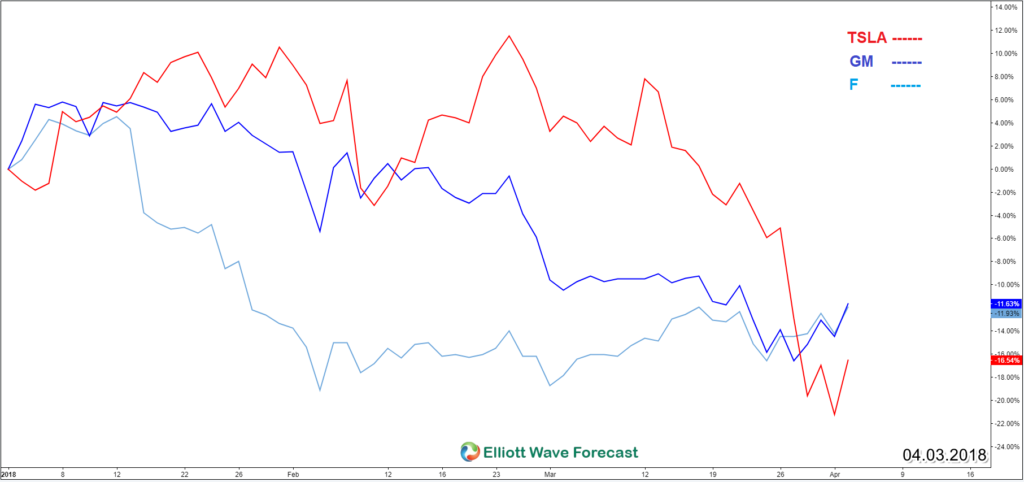
Shares of the electric-car maker are still down 16.5 percent since the beginning of the year, alongside other automakers like General Motors (NYSE:GM) Down 11.6% and Ford (NYSE:F) down 11.9%. This sector has been under-performing like the rest of the stock market in 2018 and related news isn’t helping.
Tesla missed its quarterly target for producing its hot Model 3 cars which turned to be the best-selling electric car in the U.S. Therefore, both bulls and bears has an argument in their favor and investors breathed a sigh of relief as the numbers weren’t that disappointing.
Is the worst to come for Tesla?
We at Elliott Wave Forecast believe the financial market is ruled by the technical aspect and fundamental news comes in the second place to drive the price to a pre-determined direction. Consequently, we’ll be using the Elliott Wave Theory to help us identify the expected path for TSLA.
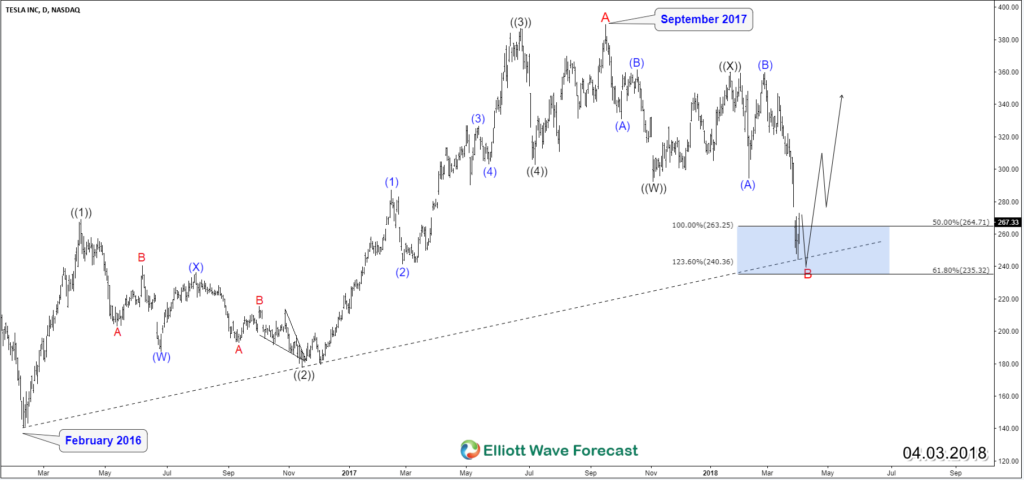
TSLA Elliott Wave Daily Chart 04/03/2018
In the above chart, we can notice that TSLA did 5 waves move to the upside from February 2016 low before ending that cycle at September 2017 peak. In our previous Article from 2016, we pointed out to the potential move higher for Tesla with a break in price above $300 and the stock achieved a target of $389.
Down from there, Tesla starting correcting the 2016 cycle in 7 swings double three structure and managed to reach the 50% – 61.8% area ($264 – $235) which is also the equal legs area coming from the peak. The blue box areas in our charts are a high frequency areas where the Markets are likely to end cycles and make a turn. Consequently, TSLA has currently in the bonus time after reaching the mentioned extreme area and it’s expected to react higher from there to do a 3 waves bounce at least.
We do understand The One Market concept and therefore the bounce in Tesla should be reflected on the rest of the stock market which is sharing the same cycle from 2016 lows. However, TSLA still needs to break above $389 peak to open a new bullish sequence to the upside toward $490 area, otherwise if the bounce fails then the stock can correct a larger degree cycle from 2010 low and retest $200 – $150 area.
If you’re interested in more insights about Tesla or other instruments then take this opportunity and try our services 14 days to learn how to trade Stocks and ETFs using our blue boxes and the 3, 7 or 11 swings sequence. You will get access to our 78 instruments updated in 4 different time frames, Live Trading & Analysis Session done by our Expert Analysts every day, 24-hour chat room support and much more.
Back


