Starbucks Corporation (SBUX) is an American multinational chain of coffeehouses and roastery reserves. It is the world’s largest coffeehouse chain. As of November 2021, the company had 33,833 stores in 80 countries, 15,444 of which were located in the United States. Out of Starbucks’ U.S.-based stores, over 8,900 are company-operated, while the remainder are licensed.
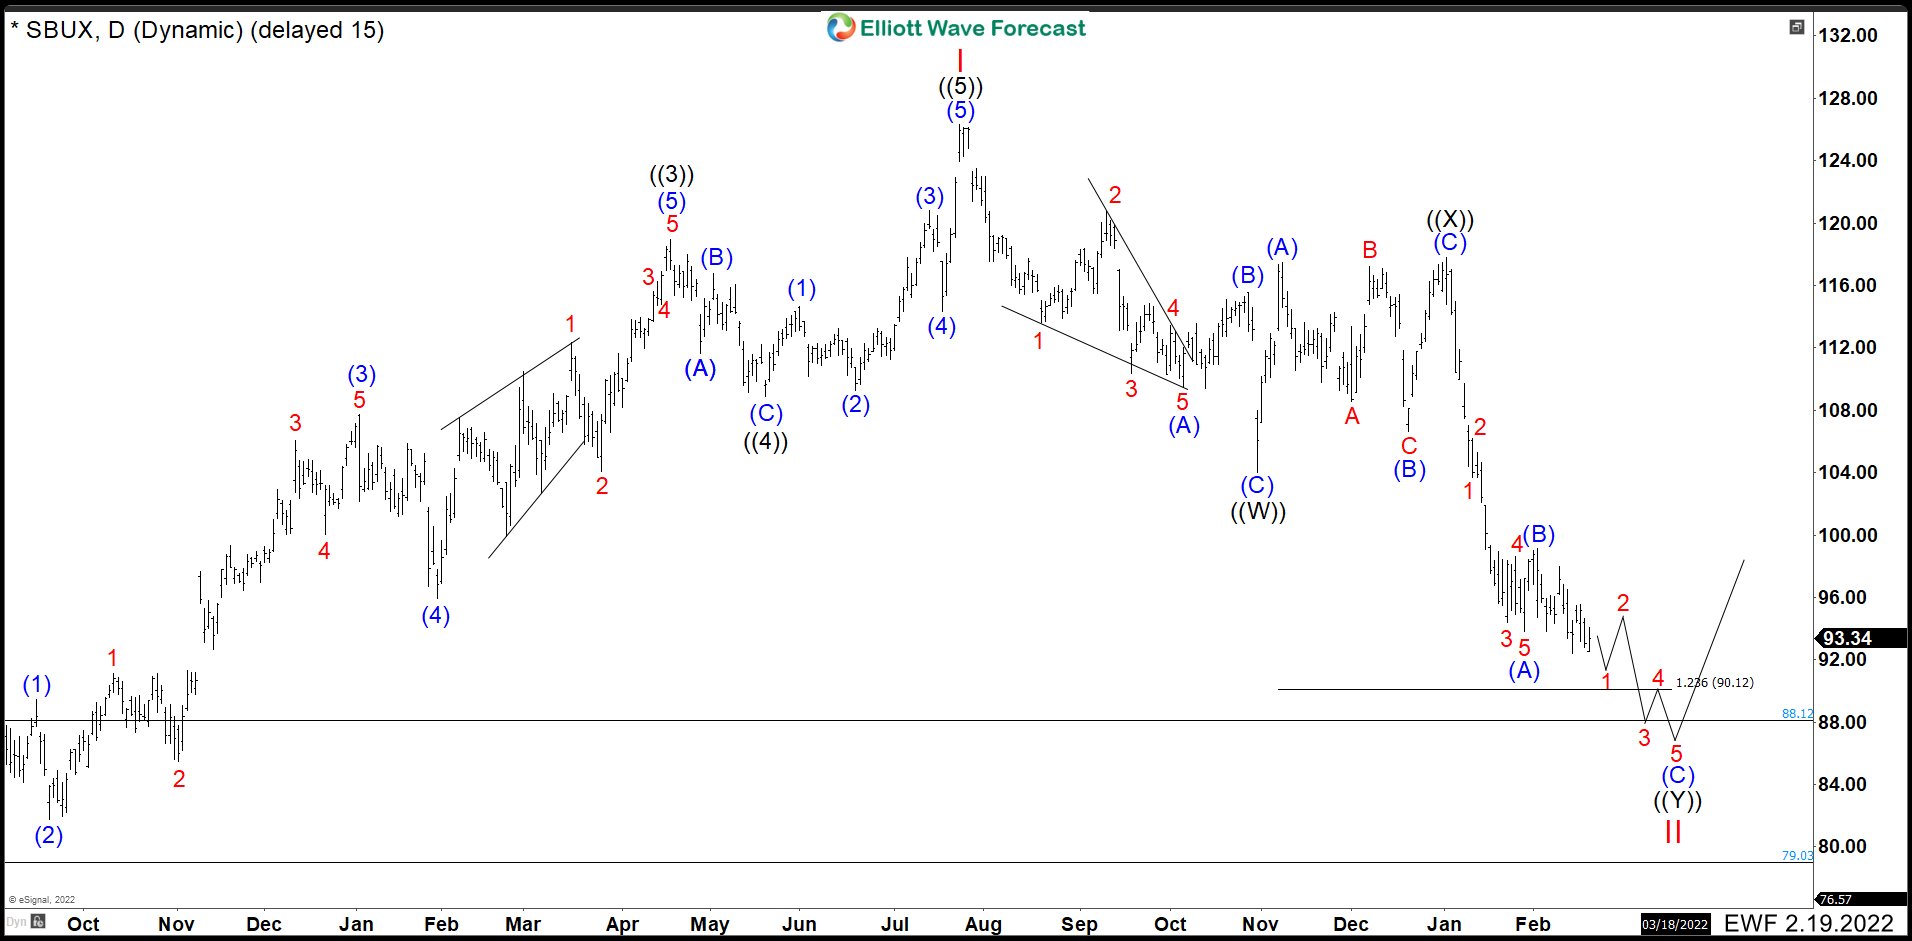
Starbucks (SBUX) Daily Chart
Starbucks (SBUX) completed an impulse structure from March 2020 low. It topped at $126.32 on July 2021. At that price, the stock started a correction of all cycle from March 2020. We can see from the peak a double correction, that means a ((W)), ((X)) and ((Y)) structure where each one is formed by 3 waves (A), (B), and (C) (If you want to learn more about Elliott Wave Theory, please follow these links: Elliott Wave Education and Elliott Wave Theory). The first 3 waves of ((W)) ended at 104.02, then we can see a pullback in 3 waves ending ((X)) at 117.80.
From here, we should see 3 swings more down to complete a double correction. Wave (A) made an impulse ending at 93.79, then a shallow correction as wave (B) completed at 99.15. We are already in wave (C) and we are calling more downside looking for an impulse structure. This drop should end below $90.12 and it should not extend below $79.03. Keep an eye when 5 waves structure finish, because after that, SBUX should continue rally.
Elliottwave Forecast updates one-hour charts 4 times a day and 4-hour charts once a day for all our 78 instruments. We do a daily live session where we guide our clients on the right side of the market. In addition, we have a chat room where our moderators will help you with any questions you have about what is happening in the market. Let’s trial 14 days for only $9.99 here: I want 14 days trial. Cancel Anytime.
Back

