Since the latest major US elections, a lot of fuss (mainly via Twitter and various “MAGA” rallies) has been made over how President Trump’s economic agenda(s) produced the current leg of the rally in the American equity indices. And how the tax cuts have accelerated the current rally. We, at elliottwave-forecast.com, we disagree with the idea. That the current president or any in the past has had anything really to do with how the equity indices have performed and much less how they will trend into the future. Let’s have a look at the $SPX500 Monthly Chart below.
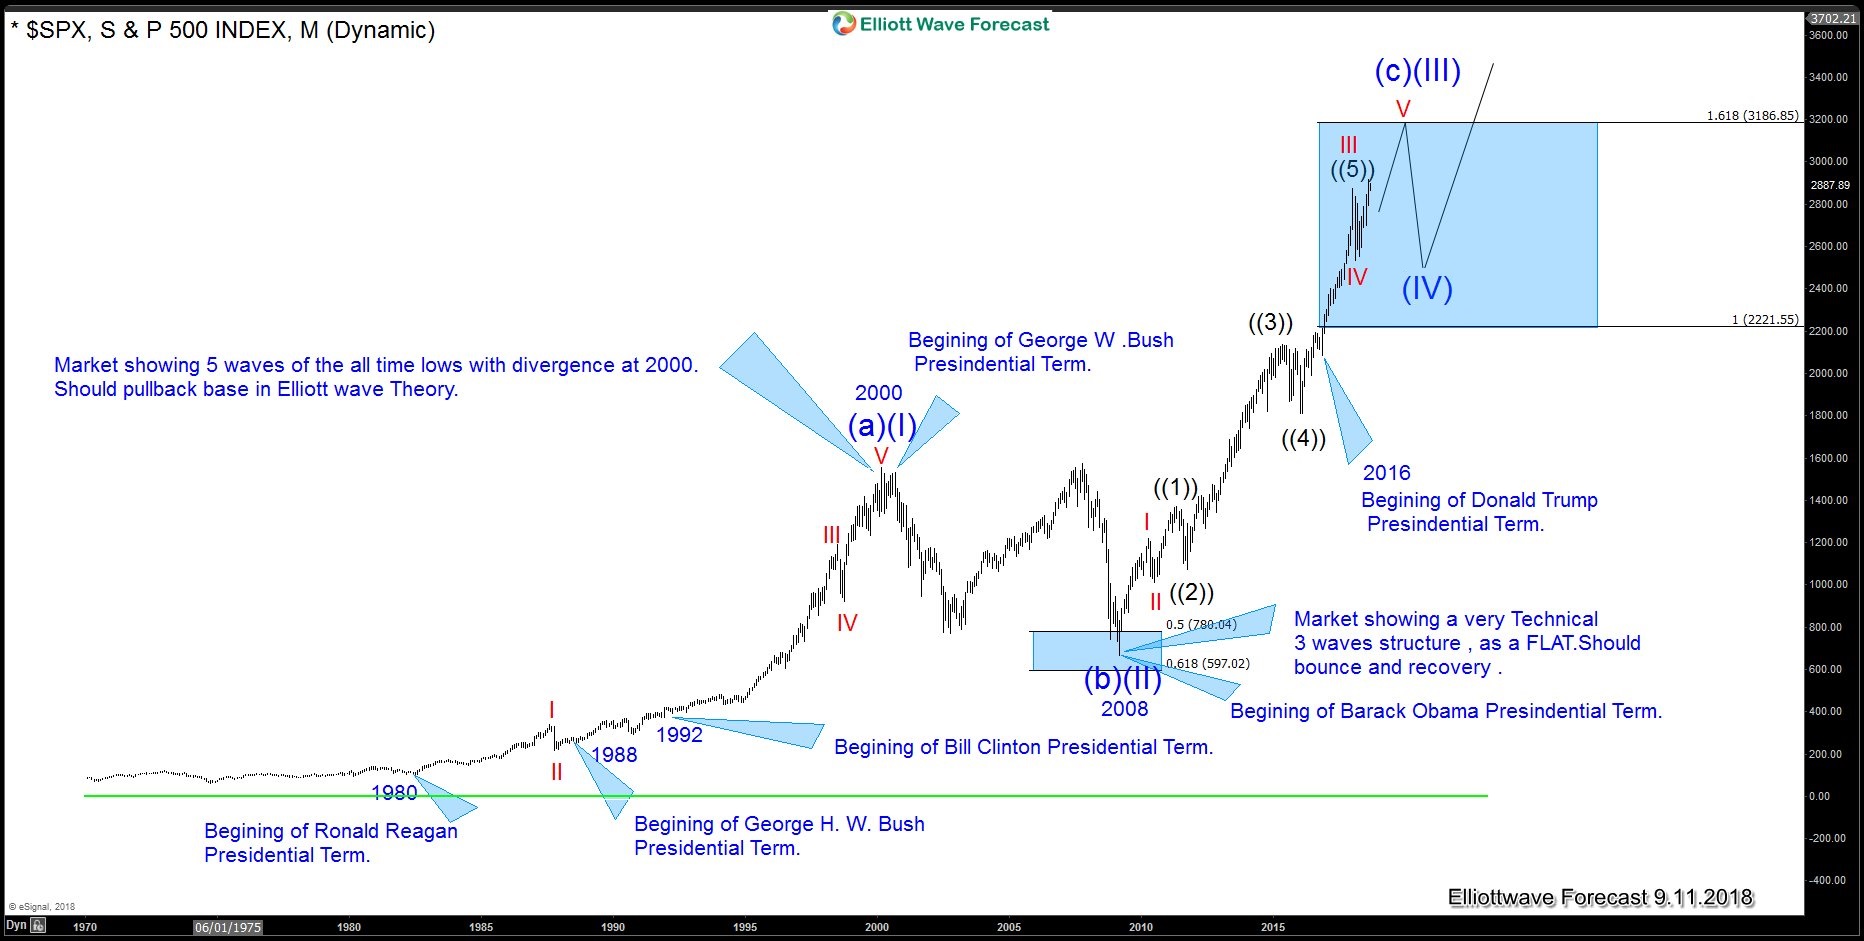
The latest rally in American indices is part of a Grand Supercycle trend which we portend is incomplete and has been supported by its own technical sequences. Furthermore, it is our view that the technical structure of the broader equity indices across the globe is incomplete. The rally since President Trump was elected is simply extending within the prior established sequence, trend, and structure having not been created by a political-economic agenda. The following chart illustrates our SPX500 Grand Supercycle sequence ($SPX500 Monthly Chart) with an overlay of Presidential tenure details.
$SPX500 Monthly Chart Elliott Wave Analysis vs Presidential Tenure $SPX500 Monthly Chart
What we can see is that since 1980 the $SPX has rallied regardless of the political party in power. In terms of pure Elliottwave theory, we can describe the chart as, at a minimum, an ABC pattern. As long as the 3189 area holds in the current ascent, represented as (a), (b), (c) in blue. Above the 3189 area, the cycle will become impulsive in nature and will extend higher with a waves (IV) and (V) in blue to come.
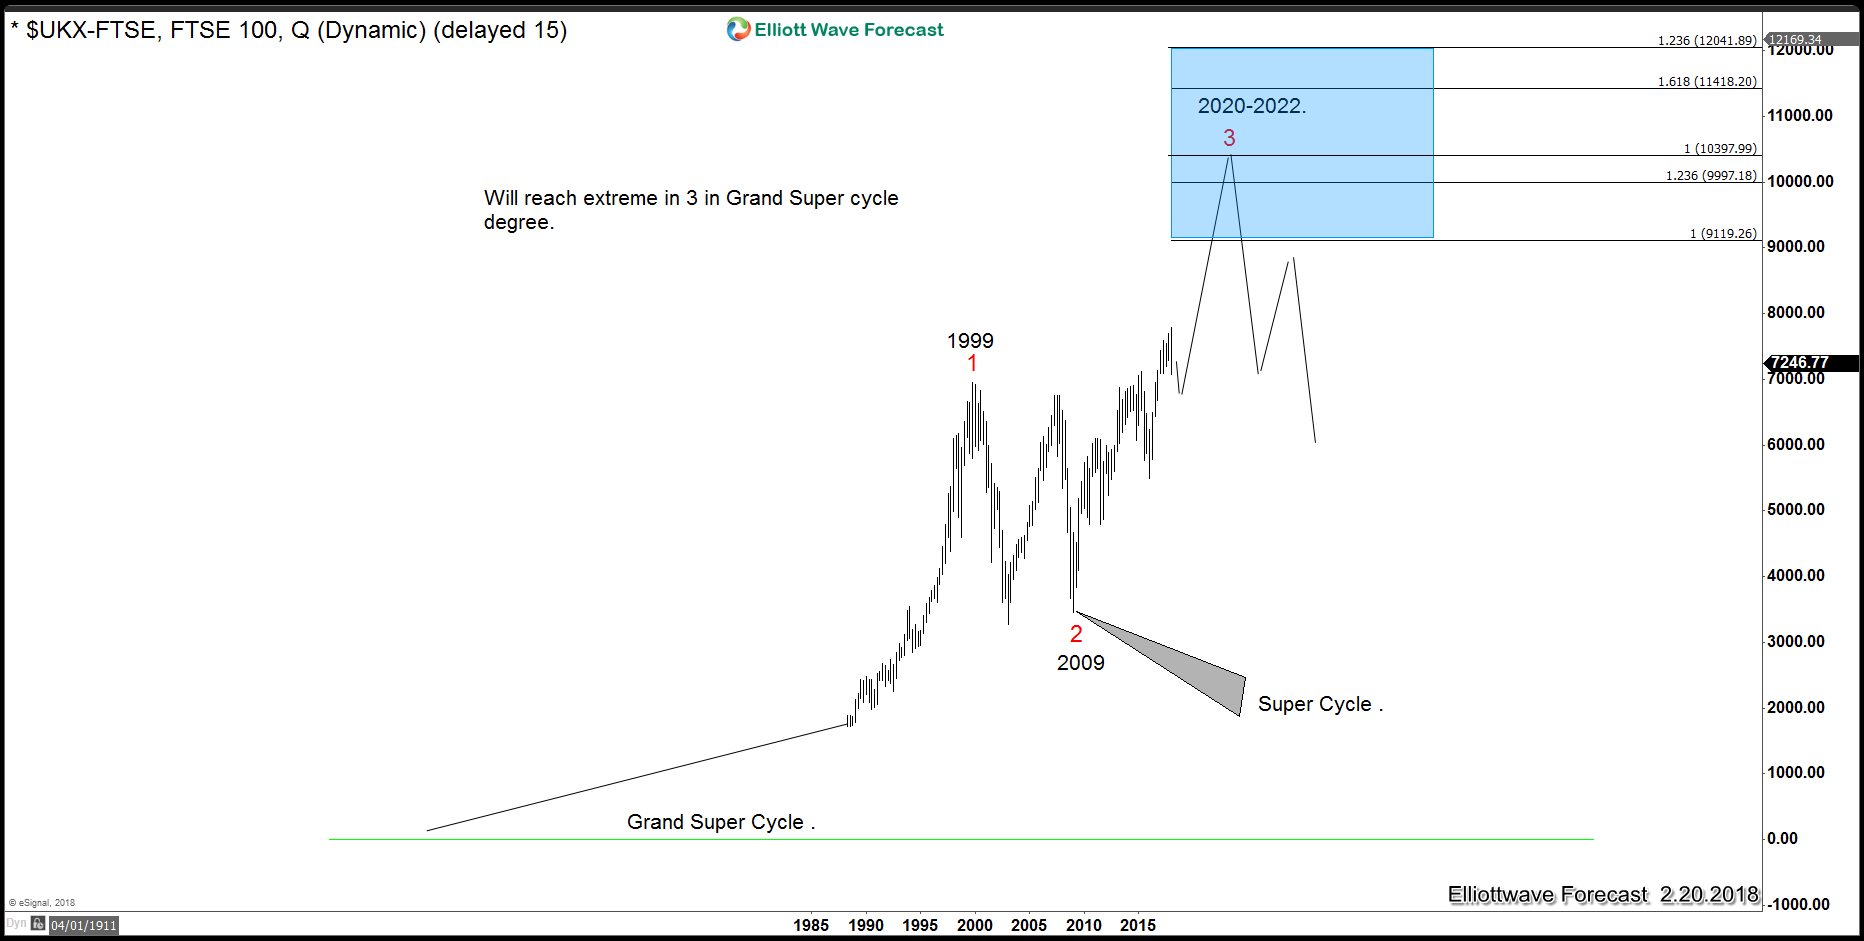
Notice that the wave ((3)) in (c) happened during President Obama’s term and wave III in red within (a)/(I) happened while Clinton held the office of POTUS. Candidly one could conclude President Obama got a bit lucky as the index ended a powerful 3 wave. The pullback by means of a FLAT into the 50-61.8% Fibonacci retracement buying area off what we are calling the all-time rally from the “real” high set in 2000. Many Presidents tend to claim that their own agenda has a lot to do with the market rally. But our charts prove otherwise. In simpler terms, if both parties run different market-affecting agendas, then the Market should be behaving logically within those respective political agenda(s). s you can decipher from the charts that’s not how we believe the markets end up working out. The following chart shows the Grand super-cycle in $FTSE100.
FTSE-100 Swing Sequences Quarterly Chart
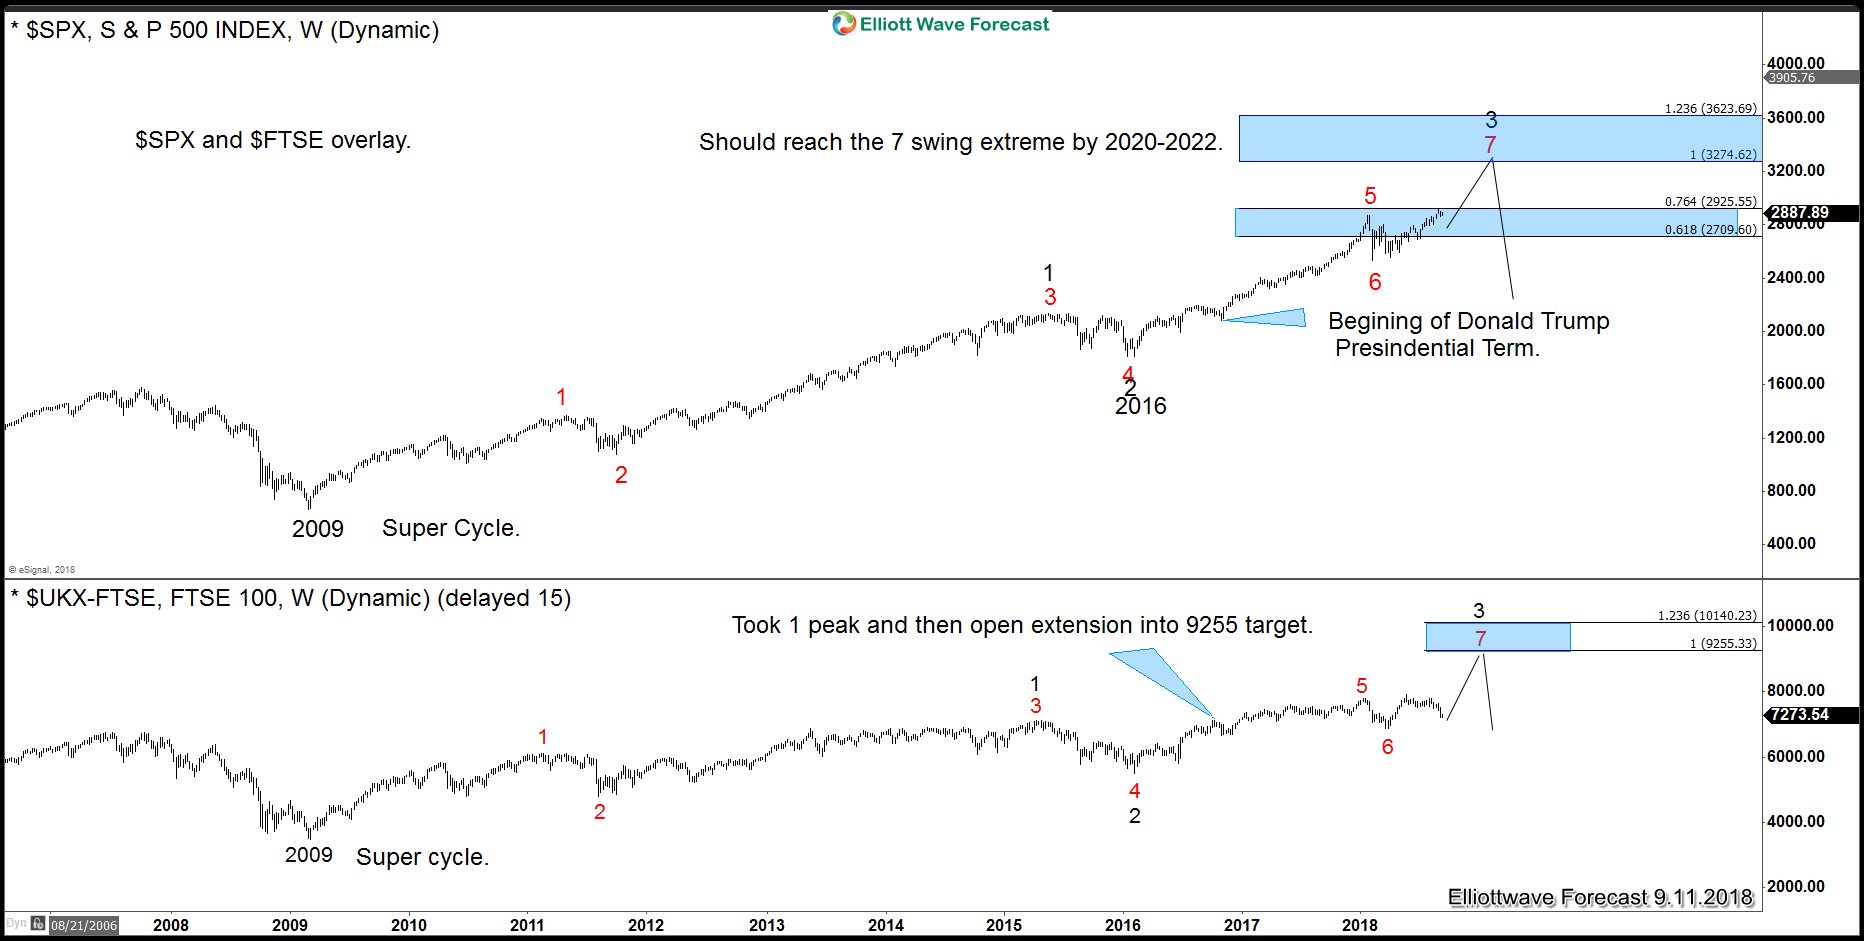
Which is showing an incomplete sequence that needs to reach the 9119 area before completion. This Index will remain supported regardless of the political agendas from Downing Street (or the Bank of England for that matter). As we overlay the $FTSE and $SPX, we observe some interesting analogs below.
SPX500 Supercycle Sequence vs FTSE-100 Index
Showing how the bullishness from 2009 in the super-cycle degree was incomplete at the time of the US Elections in 2016. So, no matter which candidate was elected, the market was in incomplete sequences in both indices. The $SPX500 was showing a new high above 1 black and calling higher and had taken out the real highs of 2000. The extension is the 100% area at 3274. The lower chart is the $FTSE which was also showing an incomplete sequence since its lows at 2009 super cycle bottom and had eclipsed the peak in 1 (black) by the time President Trump took office.
Again, so no matter the agenda, the Market should have rallied. We are looking for an extreme to be reached by 2020 with no regard to the next presidential election winner. Only then do we see a chance for a long lasting correction in all equity indices.
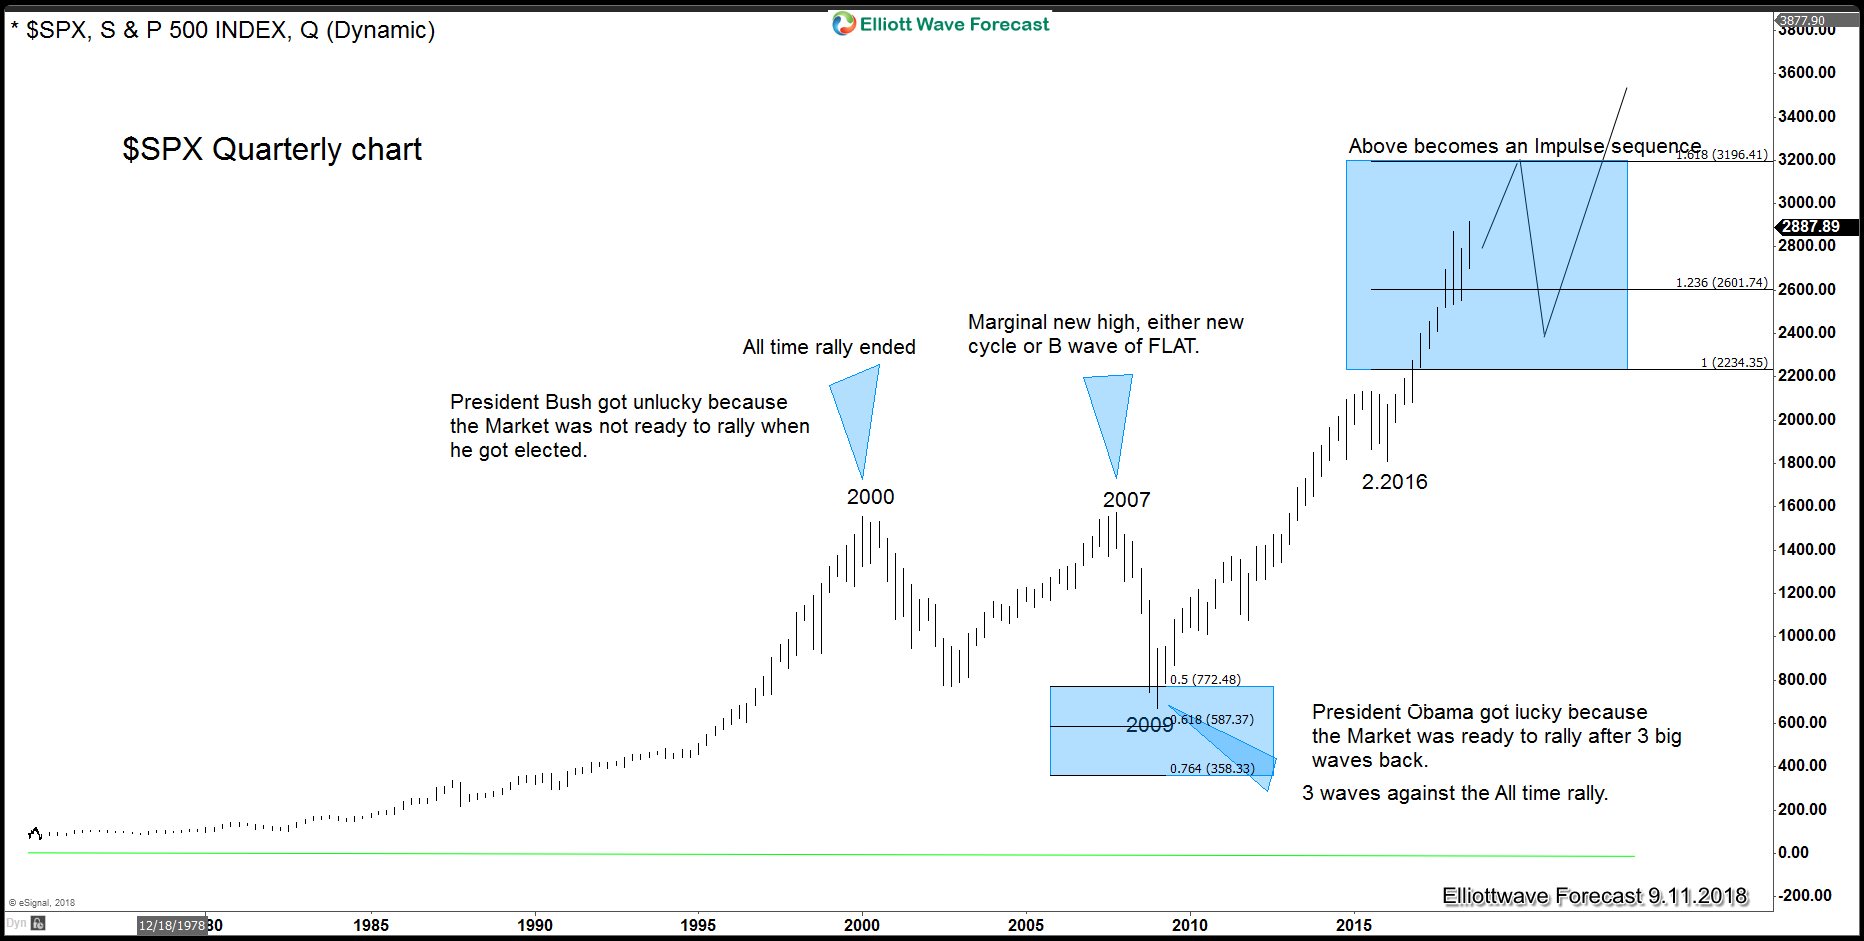
The Following chart shows the $SPX Grand Supercycle with projected targets in the 3274 area when time and price extensions will be alignment. At that time, our Market Code will call for possible years of pullbacks. Looking at the wave (II) blue and assuming that the $SPX passes the 1.618 of (a)/(b) at 3189, then a wave (4) will happen. Wave (2) took 9 years, so a sideways consolidation in wave (4) can also take place.
President George W.Bush gets a bad rep when the talking heads correlate the markets to Presidential tenures but, in reality, President Bush inherited a Market showing 5 waves (sign of fractal completion) in many of the world’s indices. $HSI-HKG (Hang Seng) was within our Blue Box, so at that time it did not matter if President Bush or Democrat Candidate Al Gore was elected as the market was due a Grand Supercycle degree correction which is exactly what took place. The following chart shows the $SPX500 cycle when President Bush got elected.
$SPX500 Quarterly Chart $SPX500 Monthly Chart
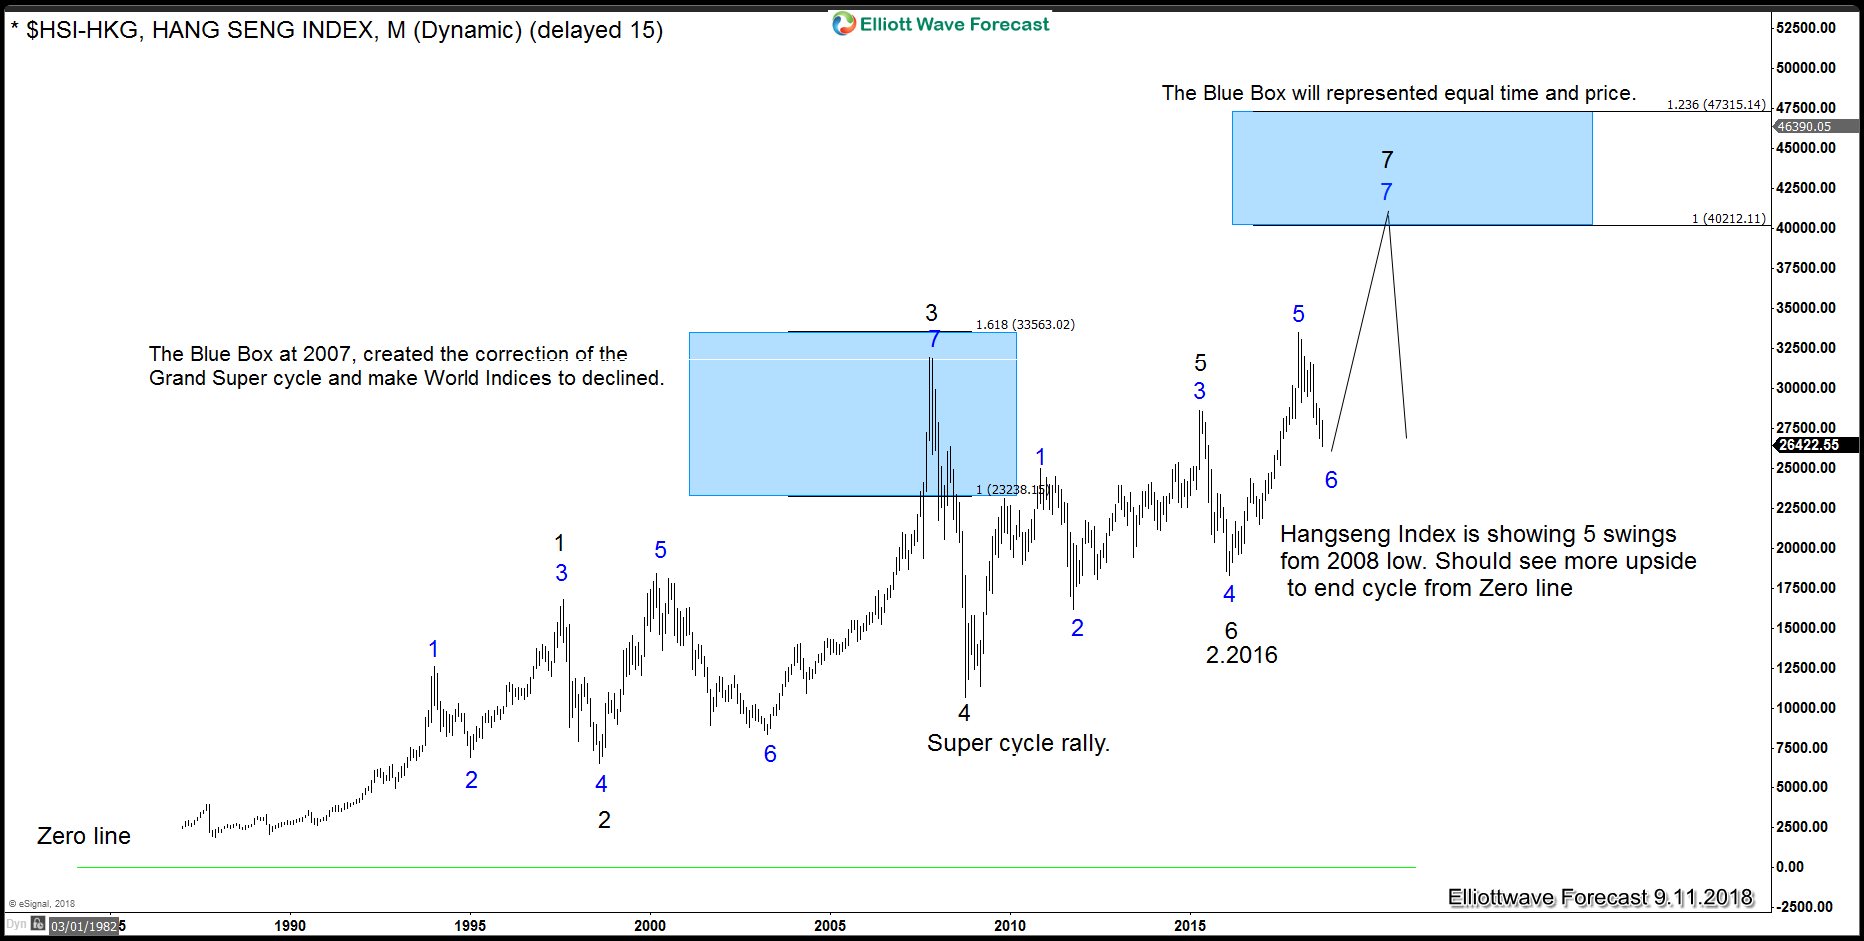
The correction took all President Bush’s 2 terms and even with a marginal new “fake” high during the final year of his presidency the fall, rise, and ultimate fall had nothing to do with his agenda(s). The Market position and correlating sequence(s) told the real story. The following chart is showing the $HSI-HKG (Hang Seng) at the Blue Box in 2007, which we contend created the decline in world indices.
HSI Index Swing Sequences Monthly Chart
The Index was showing 7 swings into a Blue Box and it was no doubt, extreme. We look for it to happen again.
In conclusion, Presidents are part of a Political world and, consequently, they need to claim victory when a Market rallies and remain silent or divert blame when the Market drops. In reality, it doesn’t matter which Party occupies the White House, the Market will follow its own code that had nothing to do with Presidential agendas or tax cuts. It is about the Market Code and the Market Makers. Learn more about the Market Code at our upcoming seminar here!
Back
