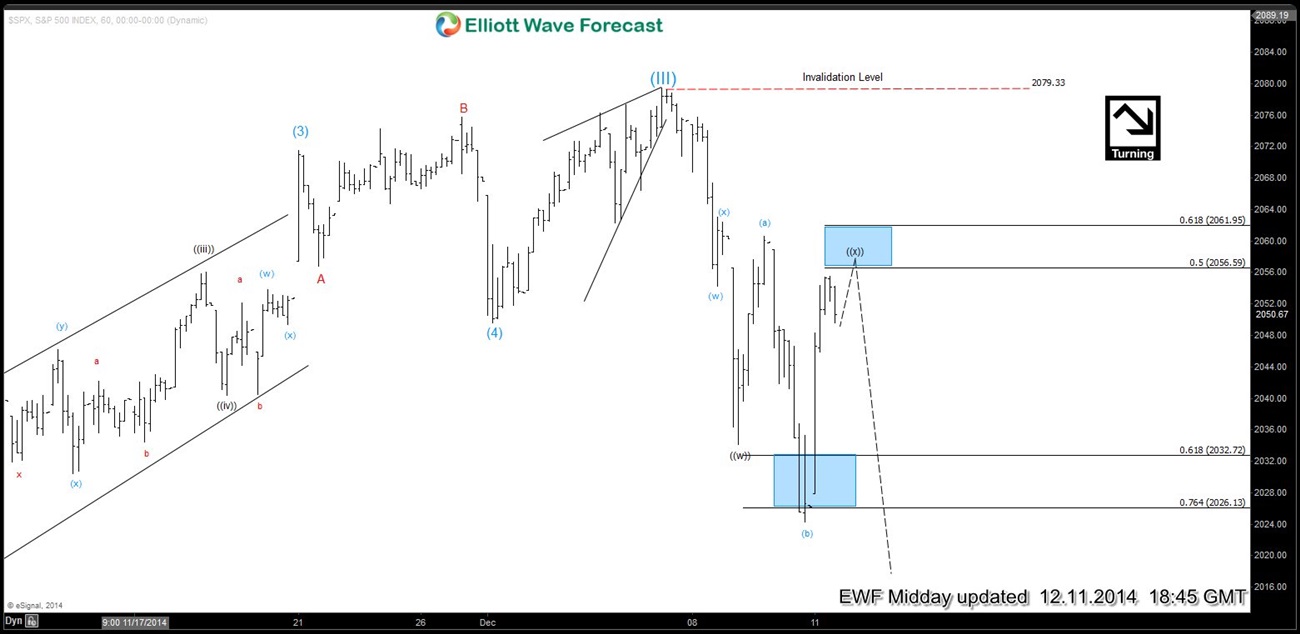
Preferred Elliott Wave view suggests Index has ended a cycle at least from Mid-October low and perhaps a larger daily cycle as well. Initial decline from the highs was in 3 waves that we have labelled as wave (( w )) and ended at 2034. After that we saw a sharp recovery to 2060 followed by new lows to 2024. Index didn’t reached equal legs @ 2015 and rallied at the open today which immediately had us thinking about the FLAT correction. So we think Index is doing a FLAT in wave (( x )) which is expected to end between 2056 – 2062 and then it should turn lower to resume the decline again. If we finish (( x )) at 2056, then equal legs of (( w )) – (( x )) would come at 2010 and 1.236 ext of (( w )) – (( x )) at 1999. This view remains valid as far as price holds below 2080 high.
We do Elliott Wave Analysis of 26 instruments in 4 time frames (Weekly, Daily, 4 Hour and 1 Hour) with 1 hour charts updated 4 times a day so clients are always in loop for the next move. Please feel free to come visit around the website and click Here to Start your Free 14 day Trial (No commitments, Cancel Anytime)
Back
