Every 4 years the elections arrive in the United States, the performance of the most important health indicator of the financial markets, such as SP500, is reviewed again. In recent years the SP500 has been well above other indices worldwide like the DAX or the FTSE. That leads us to think about the importance of the SP500, this index drags the world economy towards a better financial health because if it weren’t for the economy of the United States, other countries would be well below their current levels. In addition, we will take a look at the behavior of the DXY after the elections, which is another important index as it affects international trade.
SP500 and its performance in election years
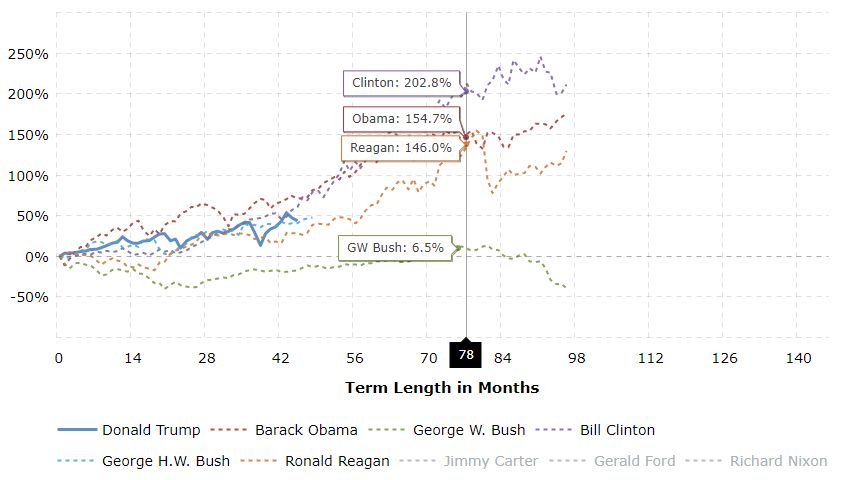
In the following chart we can look at how the SP500 keeps, in general, a positive behavior since President Ronald Reagan, but that does not mean that the president in office does not matter for there to be a good performance in the SP500, since we can see under President G. W. Bush the performance was well below average and a president with bad policies can push the SP500 underwater. Politics Matters but can’t change the underlying trend of the market!
source: macrotrends.net
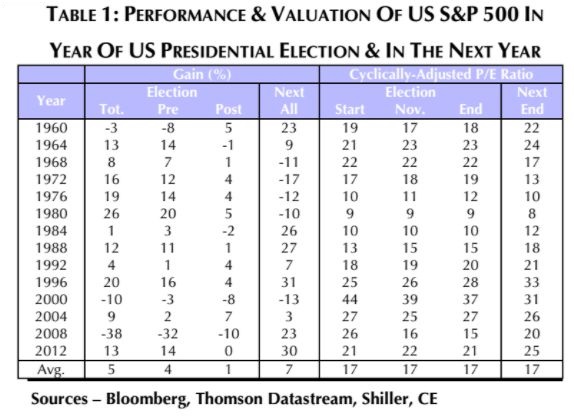
In table 1 we have the percentage of profit of the SP500 in the election year and in the following election year. We can determinate that in the SP500 71% of the time its performance drops between the pre-election and the post-election. For example in the year of 1988, where the pre-election yield was 11% and the post-election return was only 1%. While we saw a rebound in a few year like 1960, 1992, 2004 and 2008. For example in 2008 emerging from a recession of -32%, post elections the yield was -10% improving the yield of the pre elections.
What about the DXY?
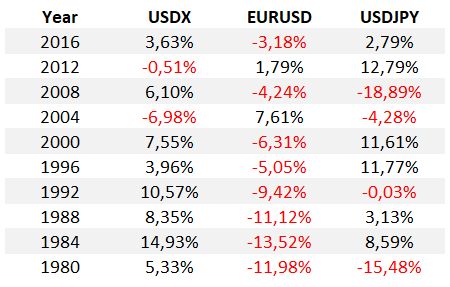
In the following table we analyse that the DXY generally has a favorable performance in election years, except for two years since 1980. The inverse correlation with the EURUSD remains, but with the USDJPY it is different. In years like 1980, 1992, and 2008, the USDJPY performance is worse that the DXY, and this is most likely due to a poor performance of the stock markets that year. While in the year 2012 the USDJPY looks much better than the DXY sure for a rebound in the stock market worldwide.
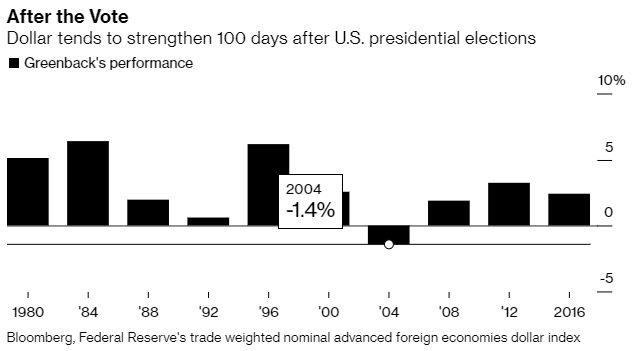
Now what about the first 100 days after electing a President in the United States. The DXY has a totally favorable performance. Only in 2004 it registered a negative balance of -1.4% since 1980.
Conclusion
Therefore, we can conclude that economic policies influence the performance of the SP500 and in the year after the elections it is most likely that its performance will decline. The DXY reports a favorable performance in the first 100 days of government of a new election. Will that performance be repeated this end of year 2020 and in beginning of the 2021?
To be aware of what could happen in the market day by day and have a better perspective of how to operate in it, join us and take our 2-month promotion for the price of one offer here which expires after US Elections.
In Elliottwave Forecast we update the one-hour charts 4 times a day and the 4-hour charts once a day for all our instruments and also the blue boxes and rigth side mark. We do a daily live session where we guide our clients on the right side of the market. In addition, we have a chat room where our moderators will help you with any questions you have about what is happening in the market at the moment. To get regular updates on SPX, DXY and other US + World Indices, Forex pairs, Commodities or Stocks and ETFs, start your Free 14 day Trial now.
Back


