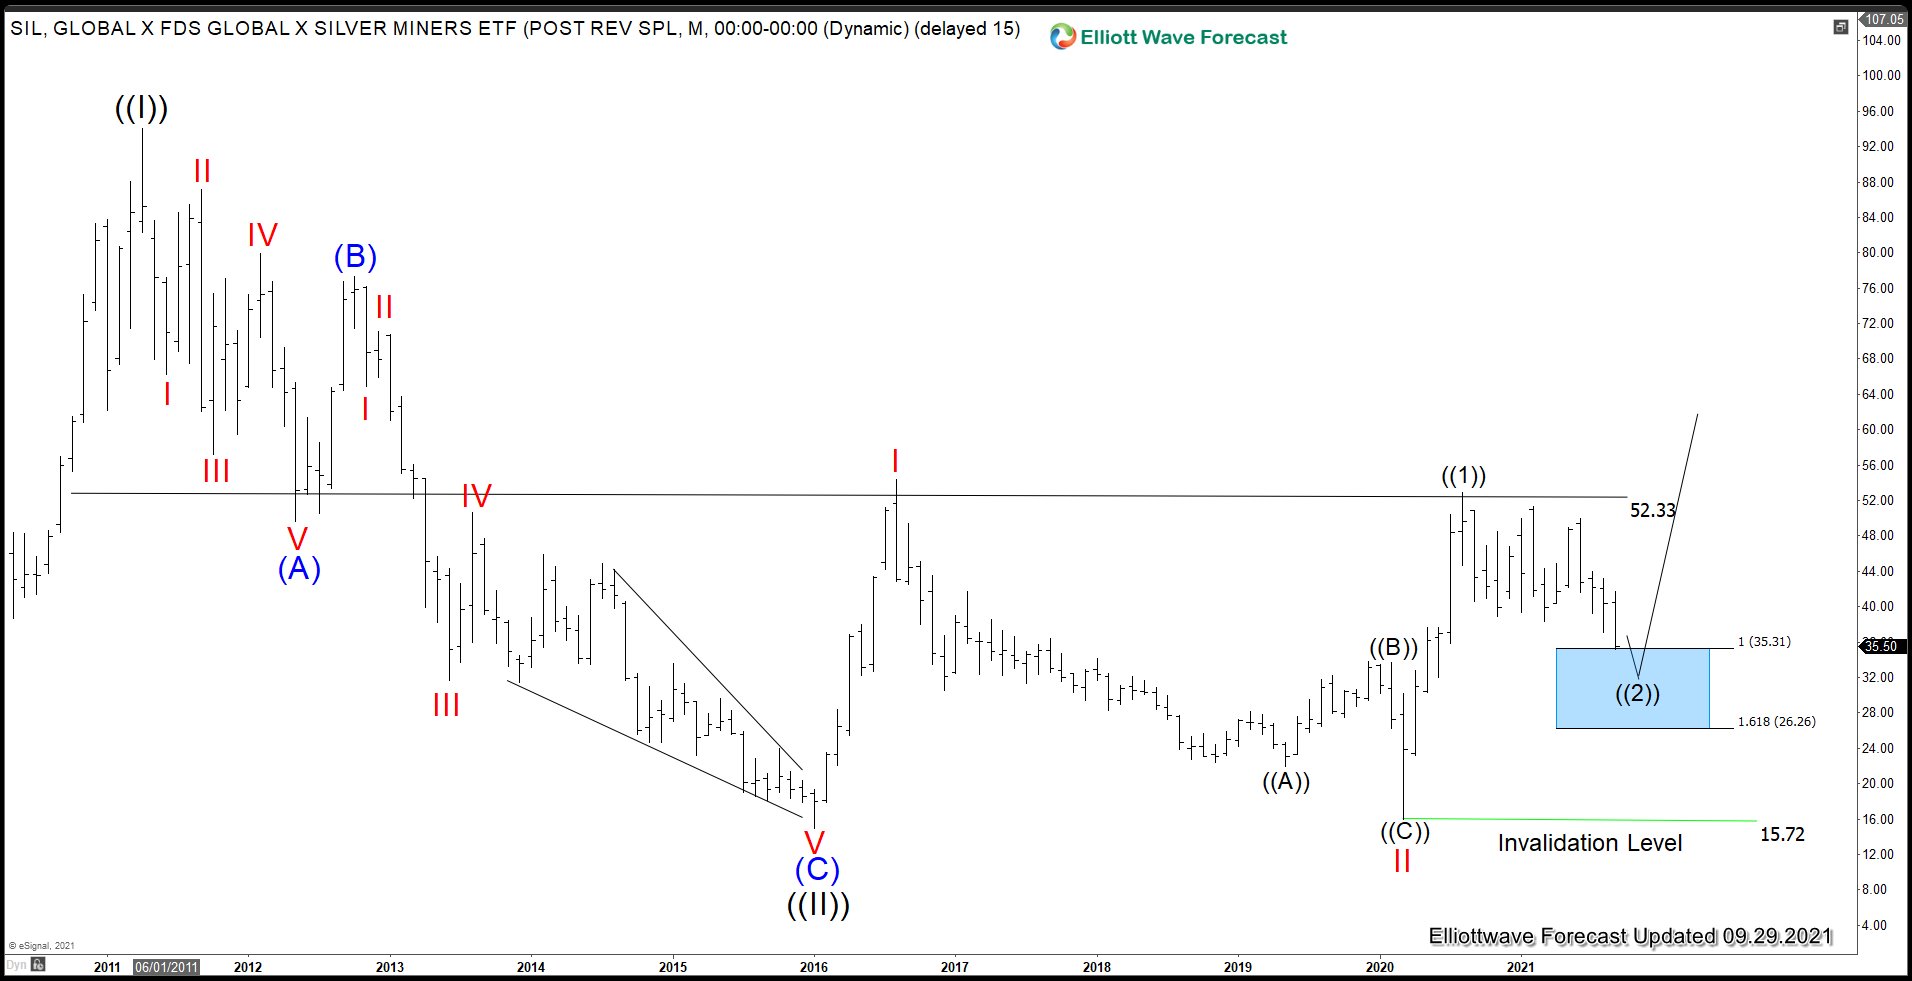
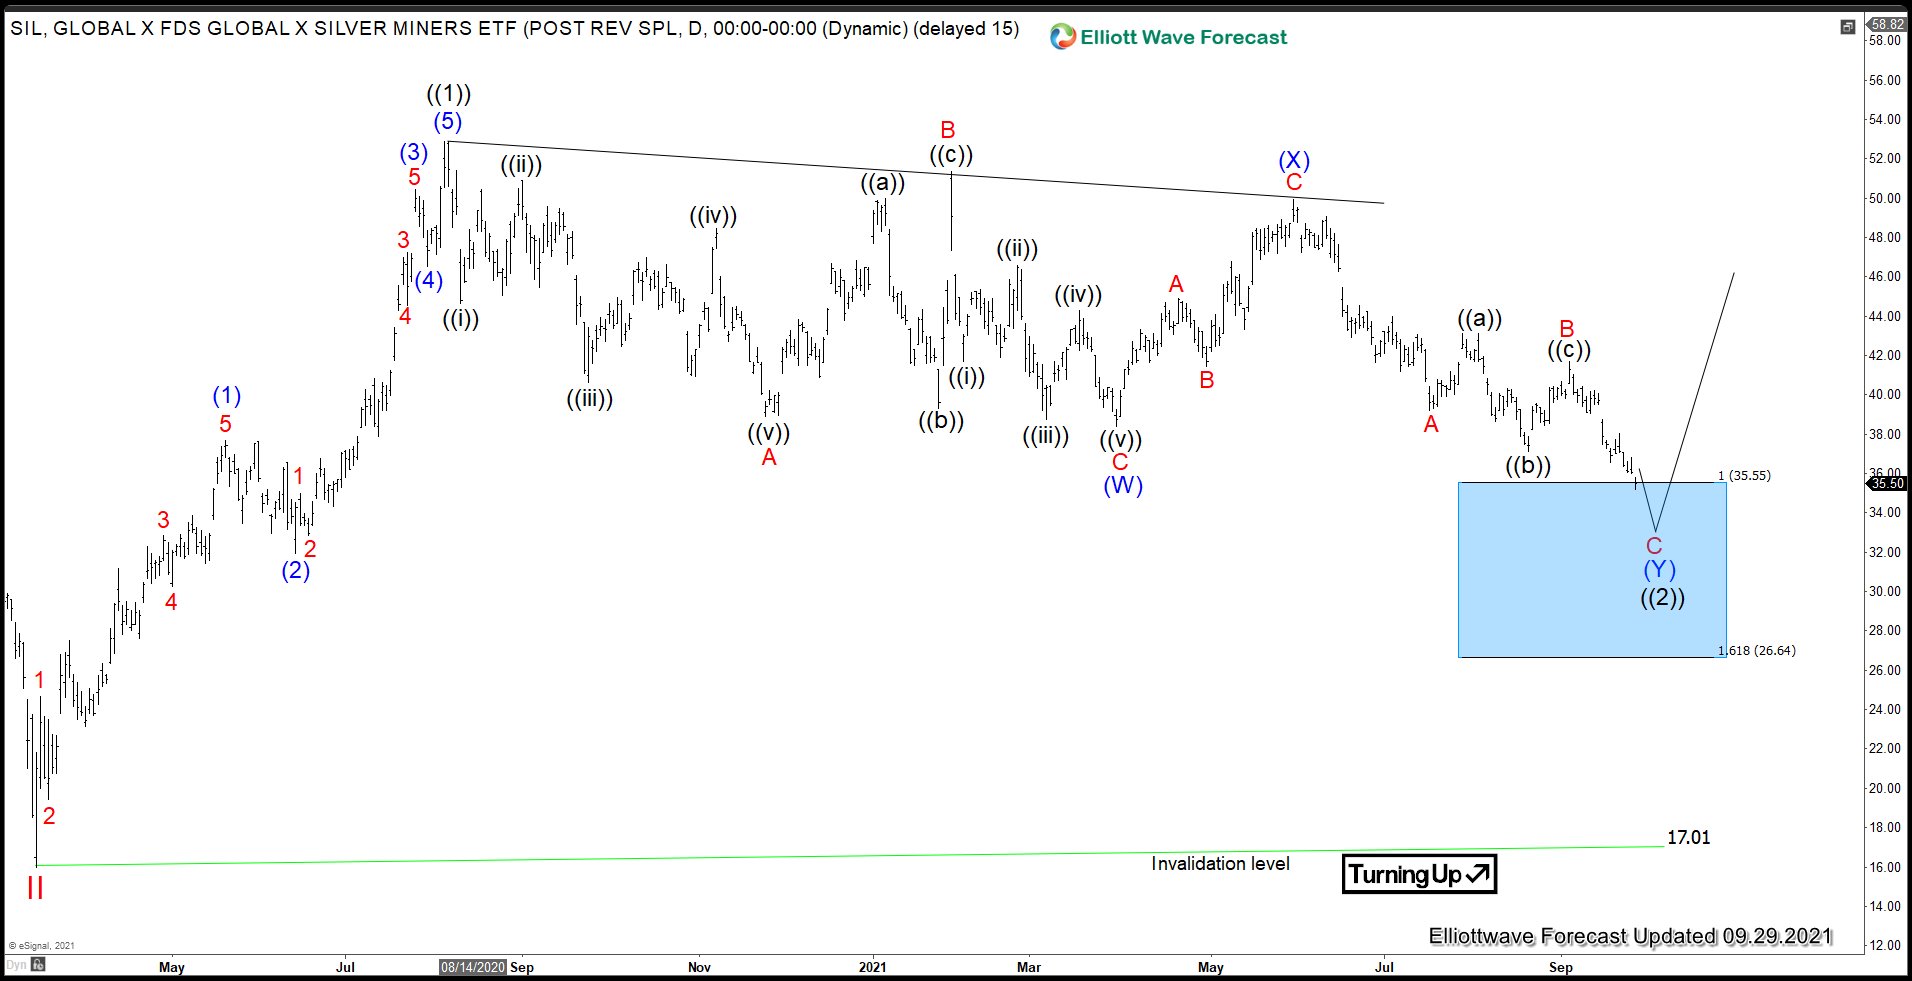
Silver Miners ETF (SIL) has been consolidating since bottoming on January 2016 low at 14.94. Presently, it has reached 100% fibonacci extension from August 2020 peak at $26.2 – 35.3. This means the instrument can soon see support and rally in 3 waves at least if not resuming higher. Let’s take a look at the Elliott Wave chart below:
SIL Monthly Elliott Wave Chart
The rally from January 2016 low is unfolding as a possible next where wave I ended at 54.24 and wave II ended at 16. The ETF has rallied higher in wave III with internal subdivision as another impulse in lesser degree. Up from wave II, wave ((1)) ended at 52.87 and pullback in wave ((2)) remains in progress. While pullback remains above March 2020 low (15.72), it should soon see another push higher.
SIL Daily Elliott Wave Chart
SIL is correcting cycle from March 2020 low as a double zigzag Elliott Wave structure. Rally from March 2020 low ended wave ((1)) at 52.87 as an impulse. Pullback in wave ((2)) has reached the 100% fibonacci extension towards 26.64 – 35.55 but short term still can see a bit lower. As far as March 2020 low pivot at 17.01 remains intact, expect pullback to soon find support at blue box area for more upside.
For regular updates on stocks, ETF, forex and commodities, feel free to take our trial here –> 14 days FREE Trial
Back


