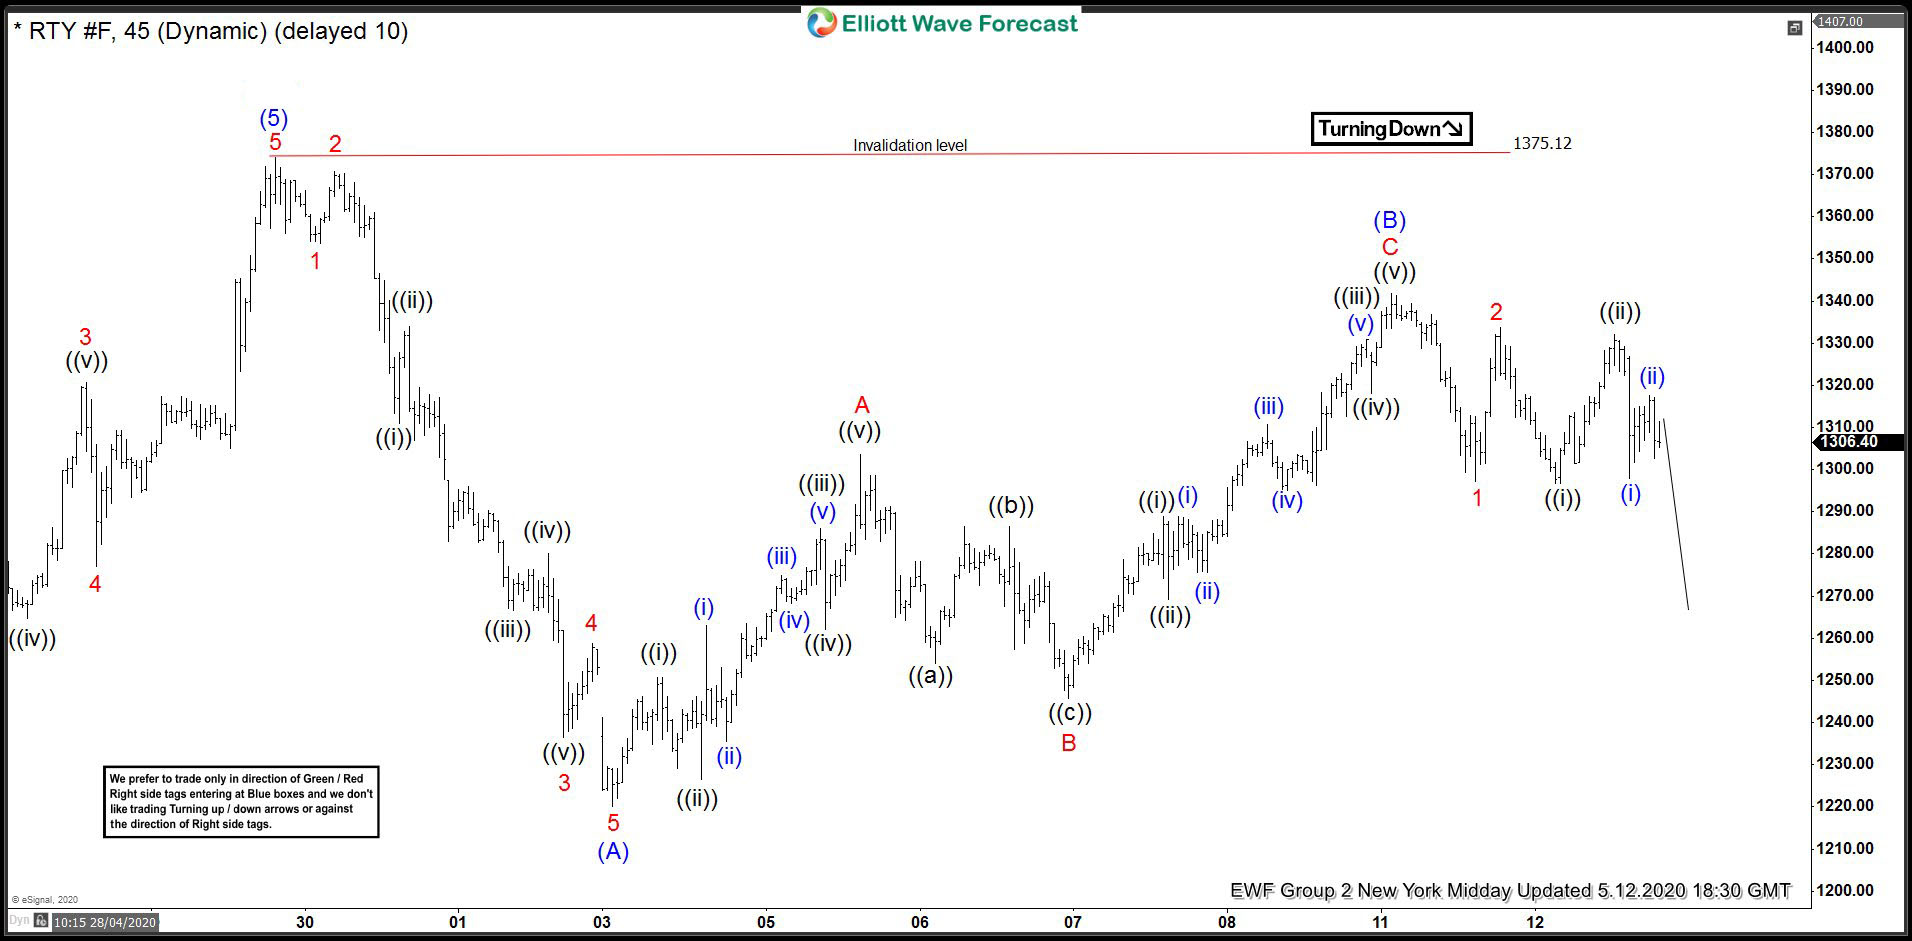
In this blog, we are going to take a look at the Elliott Wave chart of RTY_F (E-mini Russell 2000). The 1 hour NY Midday chart update shows that the cycle from April 29 peak is unfolding as a zig-zag pattern. Wave (A) ended at 1220.1 low and wave (B) bounce ended at 1341.7 high. While below 1375.12 high, the bounce in 3,7 or 11 swing is expected to fail. Since wave (A) unfolded as 5 waves structure, the index can see another 5 waves leg lower in wave (C).
RTY_F 5.12.2020 1 Hour NY Midday Elliott Wave Update
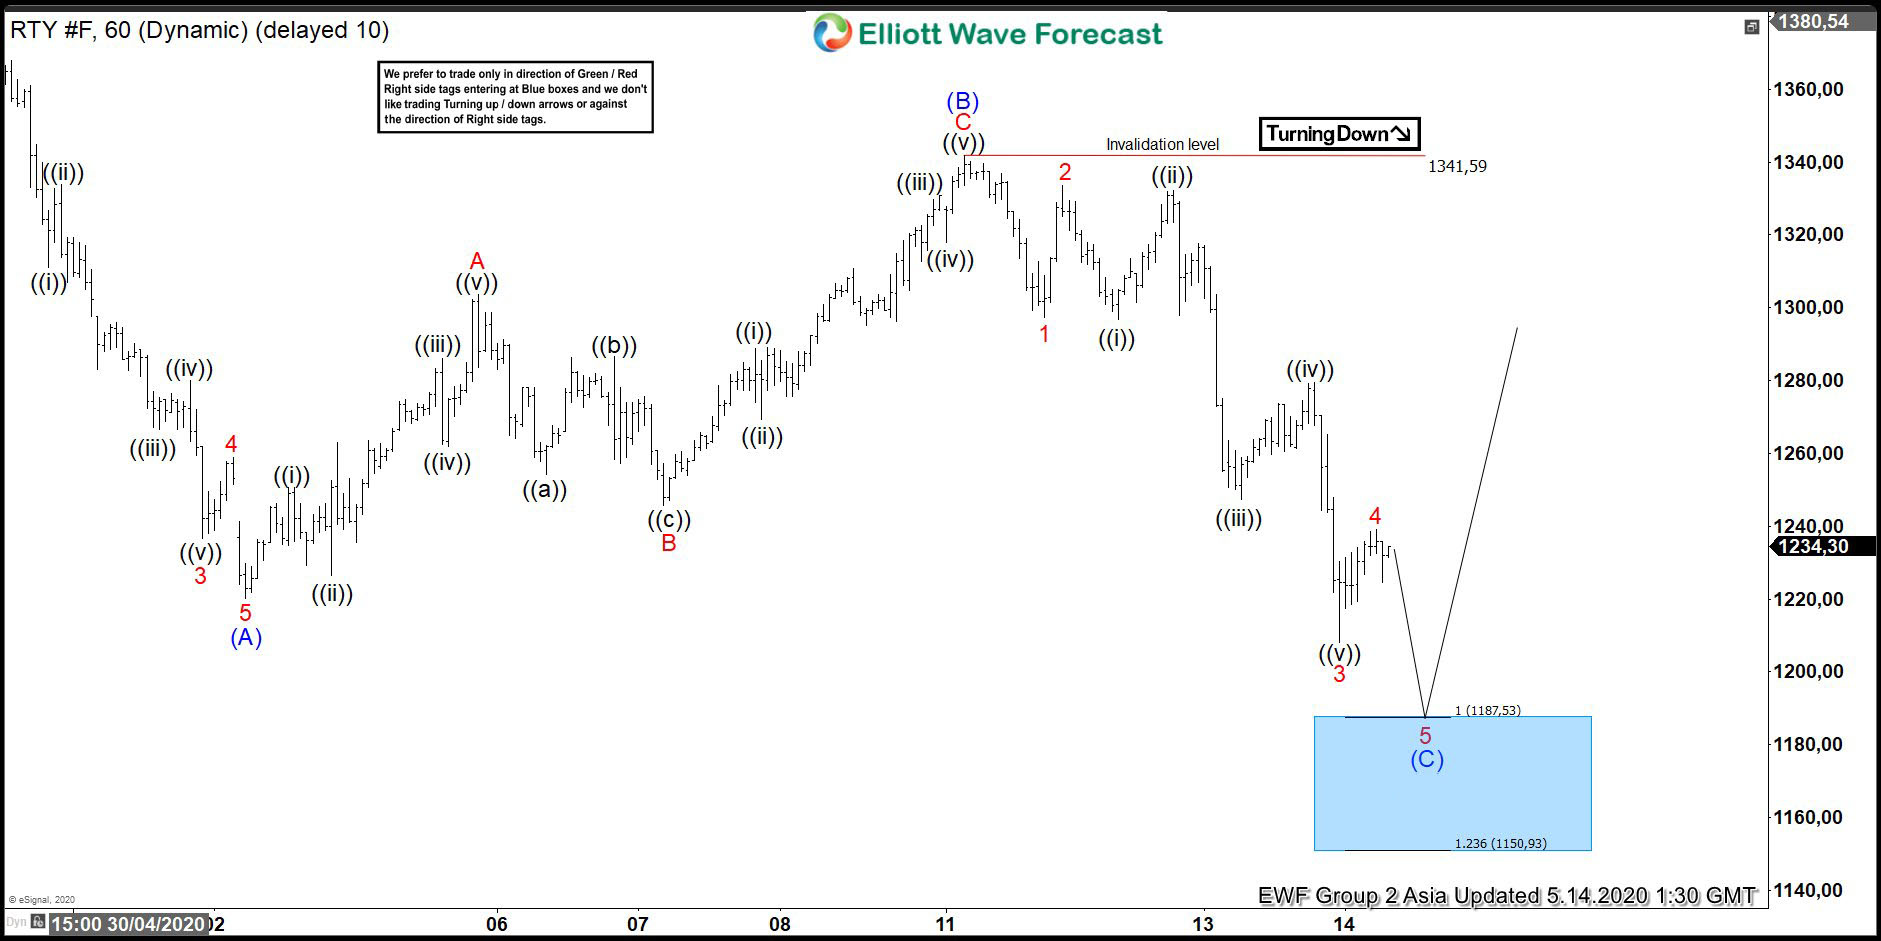
The 1 hour Asia chart update from May 14 shows that the pullback extended lower and broke below previous wave (A) low. The pullback looks incomplete, but is close to ending. The 100% extension of wave (A)-(B) where wave (C) can potentially end is at 1150.93-1187.53 area. This area is shown with a blue box, where we expect buyers to appear for 3 waves bounce at least.
RTY_F 5.14.2020 1 Hour Asia Elliott Wave Update
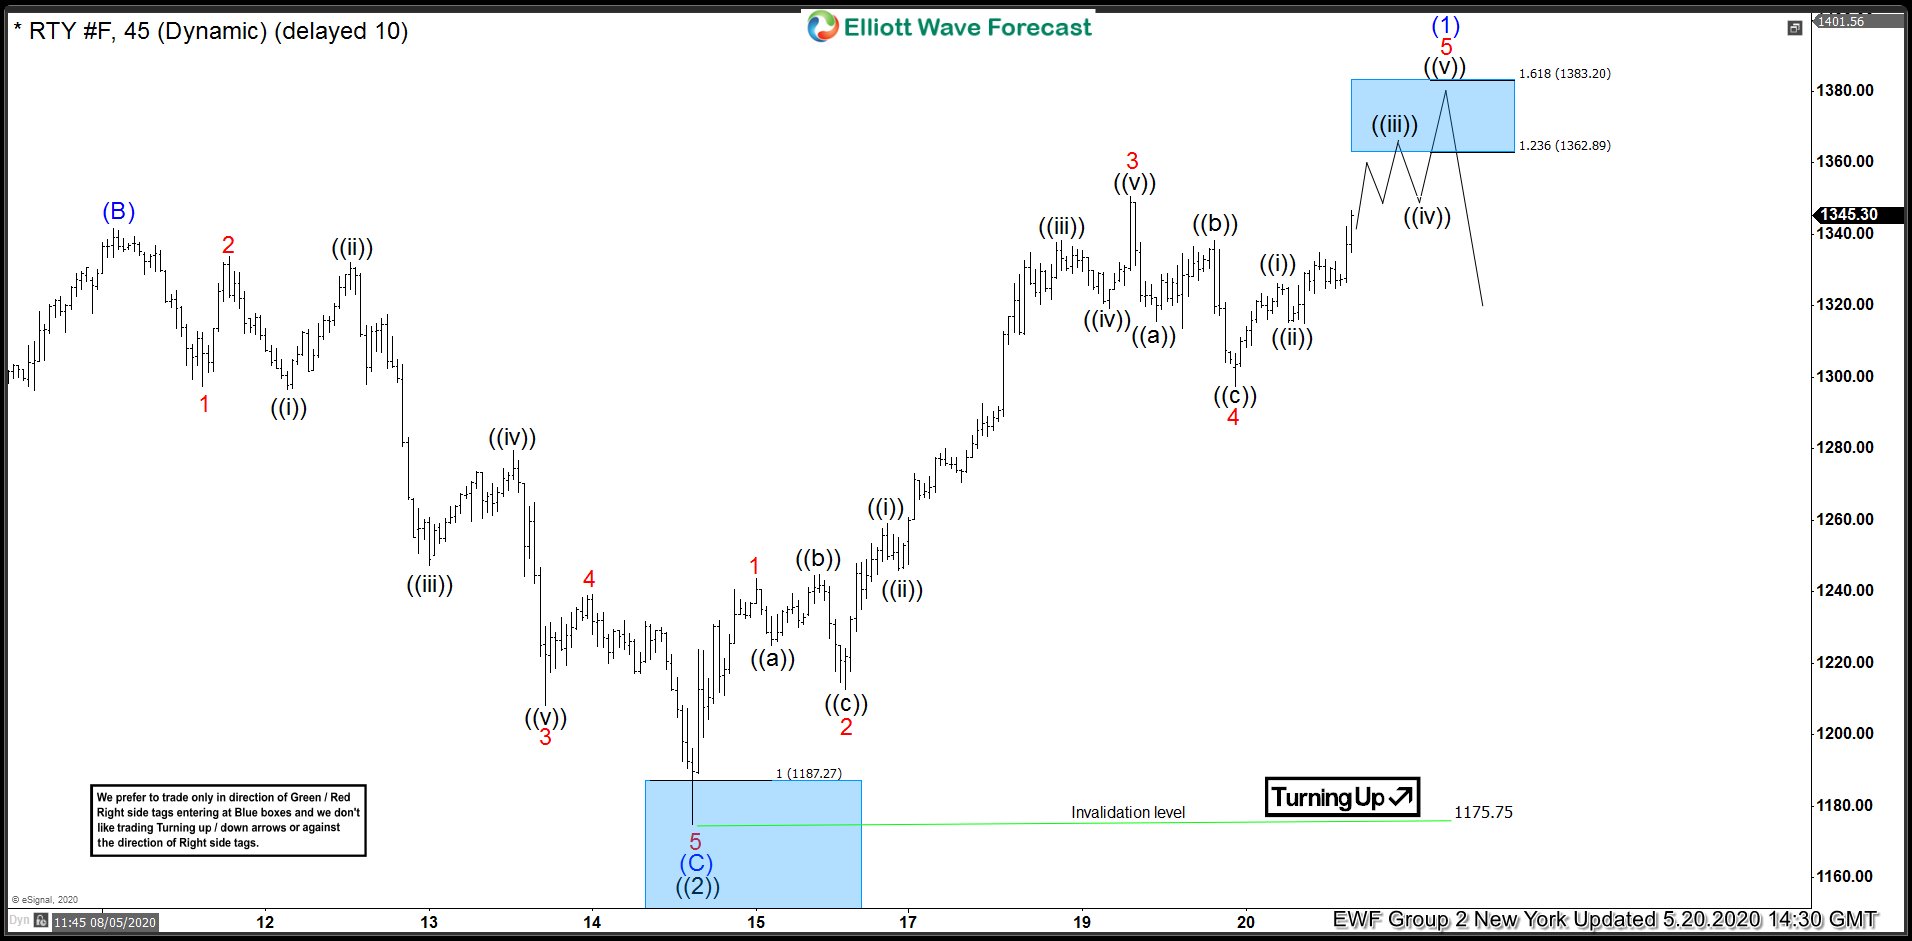
May 21 London chart update shows that the index ended the pullback at the blue box area at 1174.96 low and bounced higher from there. Wave ((i)) ended at 1243.6 high. Wave ((ii)) ended as a flat correction at 1212.60 low. From there, the index pushed higher and ended wave ((iii)) at 1350.7 high. Wave ((iv)) pullback ended at 1297.5 low. Afterwards, wave ((v)) ended at 1354.2 high. Currently, RTY_F has ended the cycle from May 14 low. The index is now expected to pullback in 3,7 or 11 swings before extending for another leg higher in wave C. The index still needs to break above April 29 peak to confirm that the low is in place and to confirm that the next leg up is in progress.
RTY_F 5.20.2020 1 Hour New York Elliott Wave Update
Get FREE access with 14 days Trial to see more chart updates and learn how to trade blue boxes using 3,7, or 11 swing sequence. We cover 78 instruments in 4 different time frames. Sign up now to get live session, daily technical video, 24 hour chat room, live trading room, and more.
Back


