Hello everyone! In today’s article, we will follow up on the past performance of the SPDR Utilities Select Sector ETF ($XLU) forecast. We will also review the latest weekly count. First, let’s take a look at how we analyzed it back in October 2023.
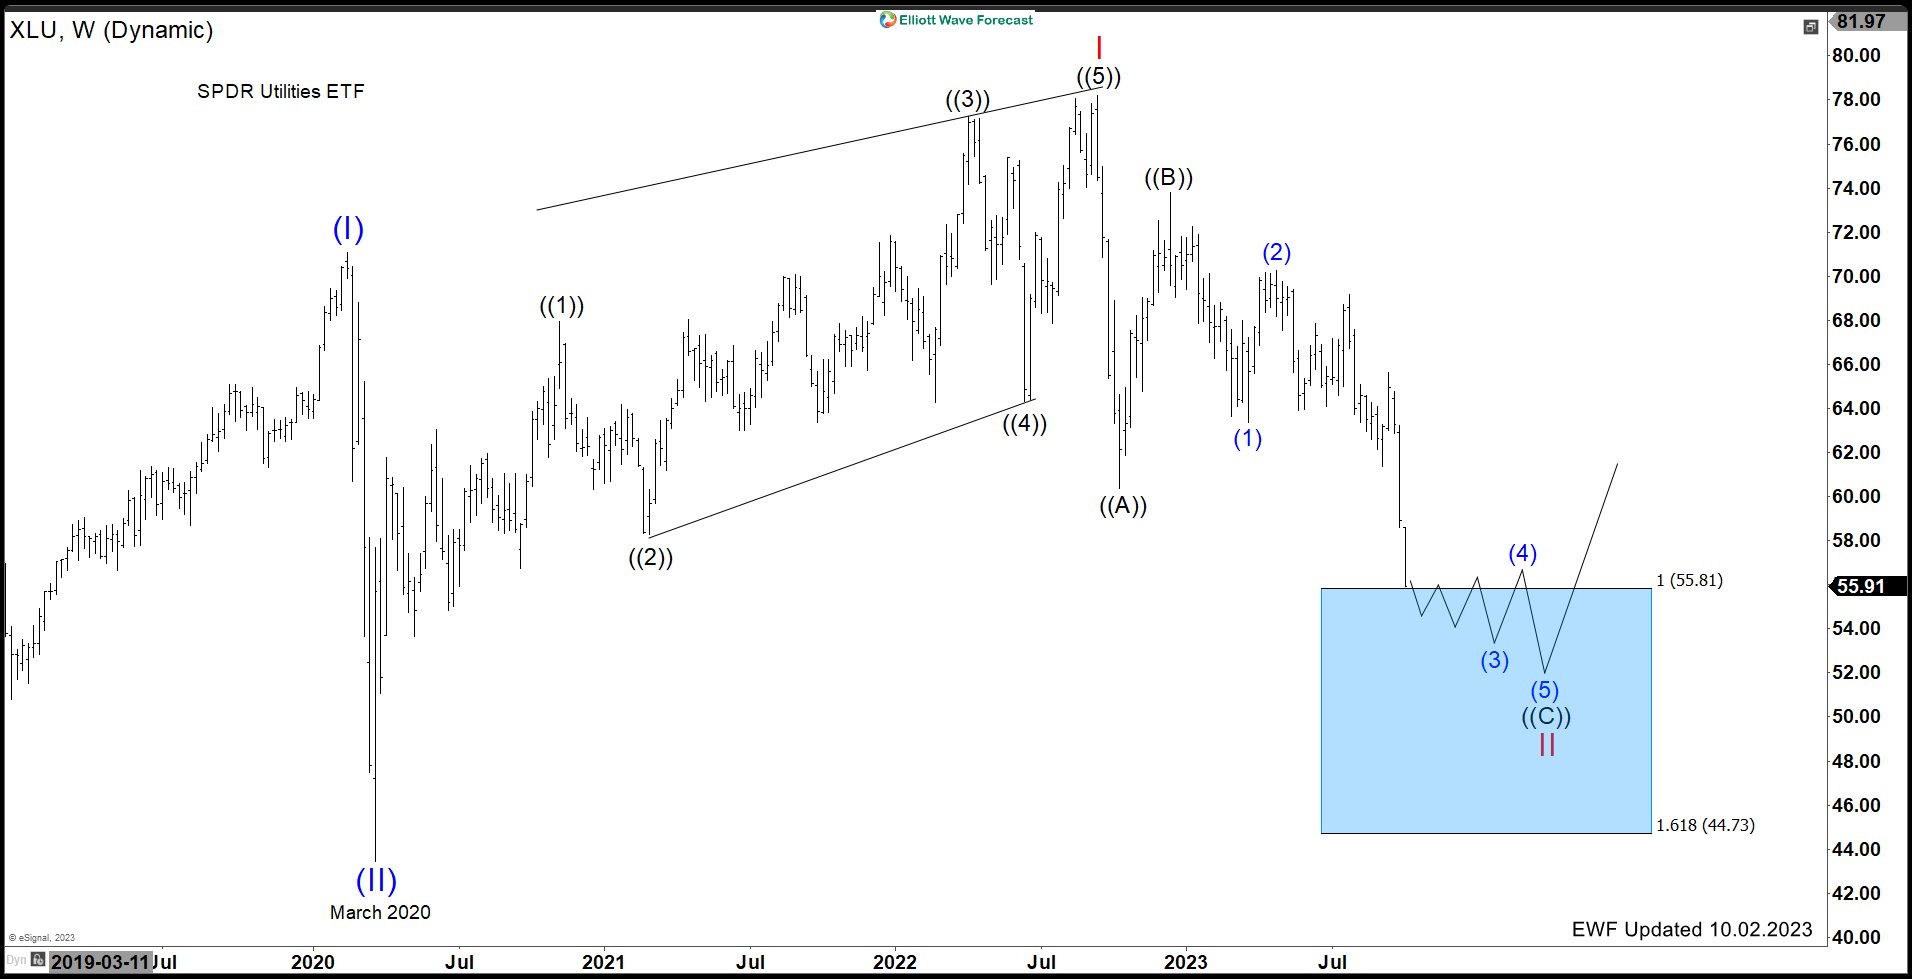
$XLU Weekly Elliott Wave View – October 2023:
In October 2023, we explained that $XLU had reached the Blue Box area at $55.81 – $44.73. A bounce was anticipated at this level. This area was a critical support zone identified by our Elliott Wave analysis.
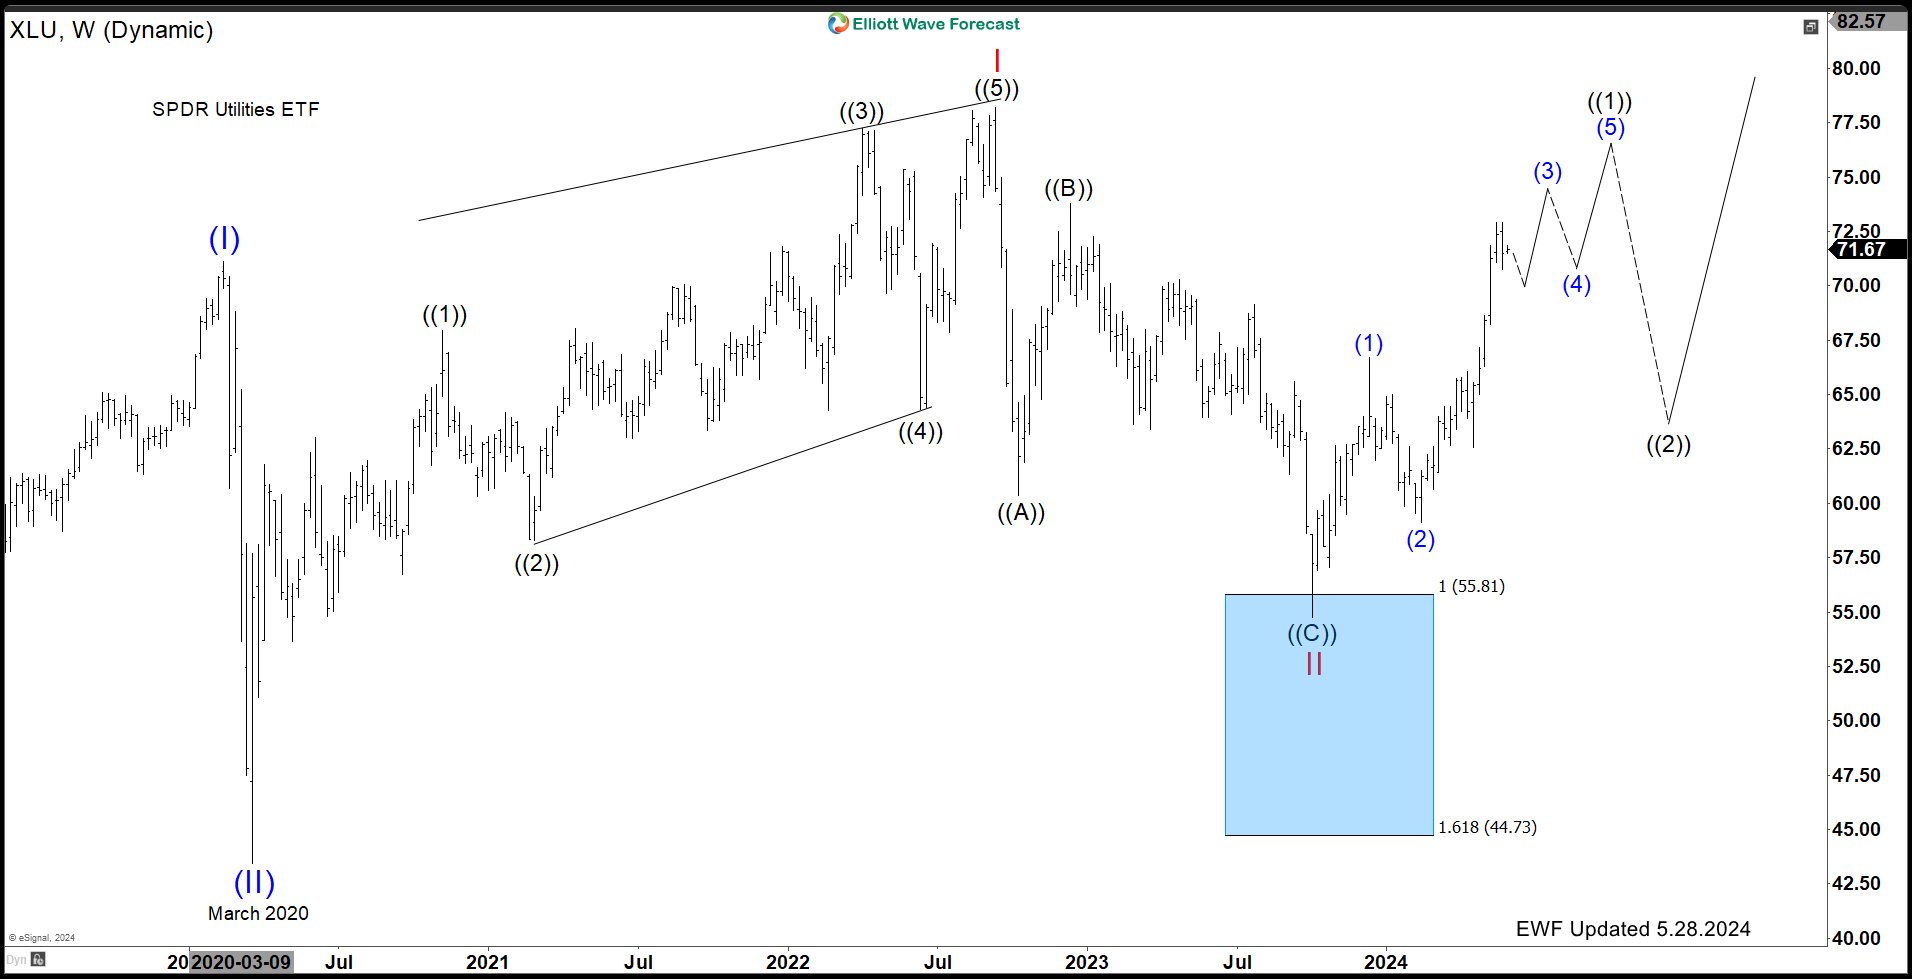
$XLU Weekly Elliott Wave View – May 28, 2024:
In May 2023, we explained that $XLU has bounced from the Blue Box area. As a result, the ETF has moved higher, allowing long positions to become risk-free. We expect $XLU to continue its rally towards the $74.00 – $79.00 range in a 5-wave pattern. This rally is favored to happen before another pullback occurs. Traders should look for re-entry opportunities at black ((2)) in 3 or 7 swings. Moreover, a break above the all-time highs (ATHs) will start a bullish sequence towards the $89 – $111 range.
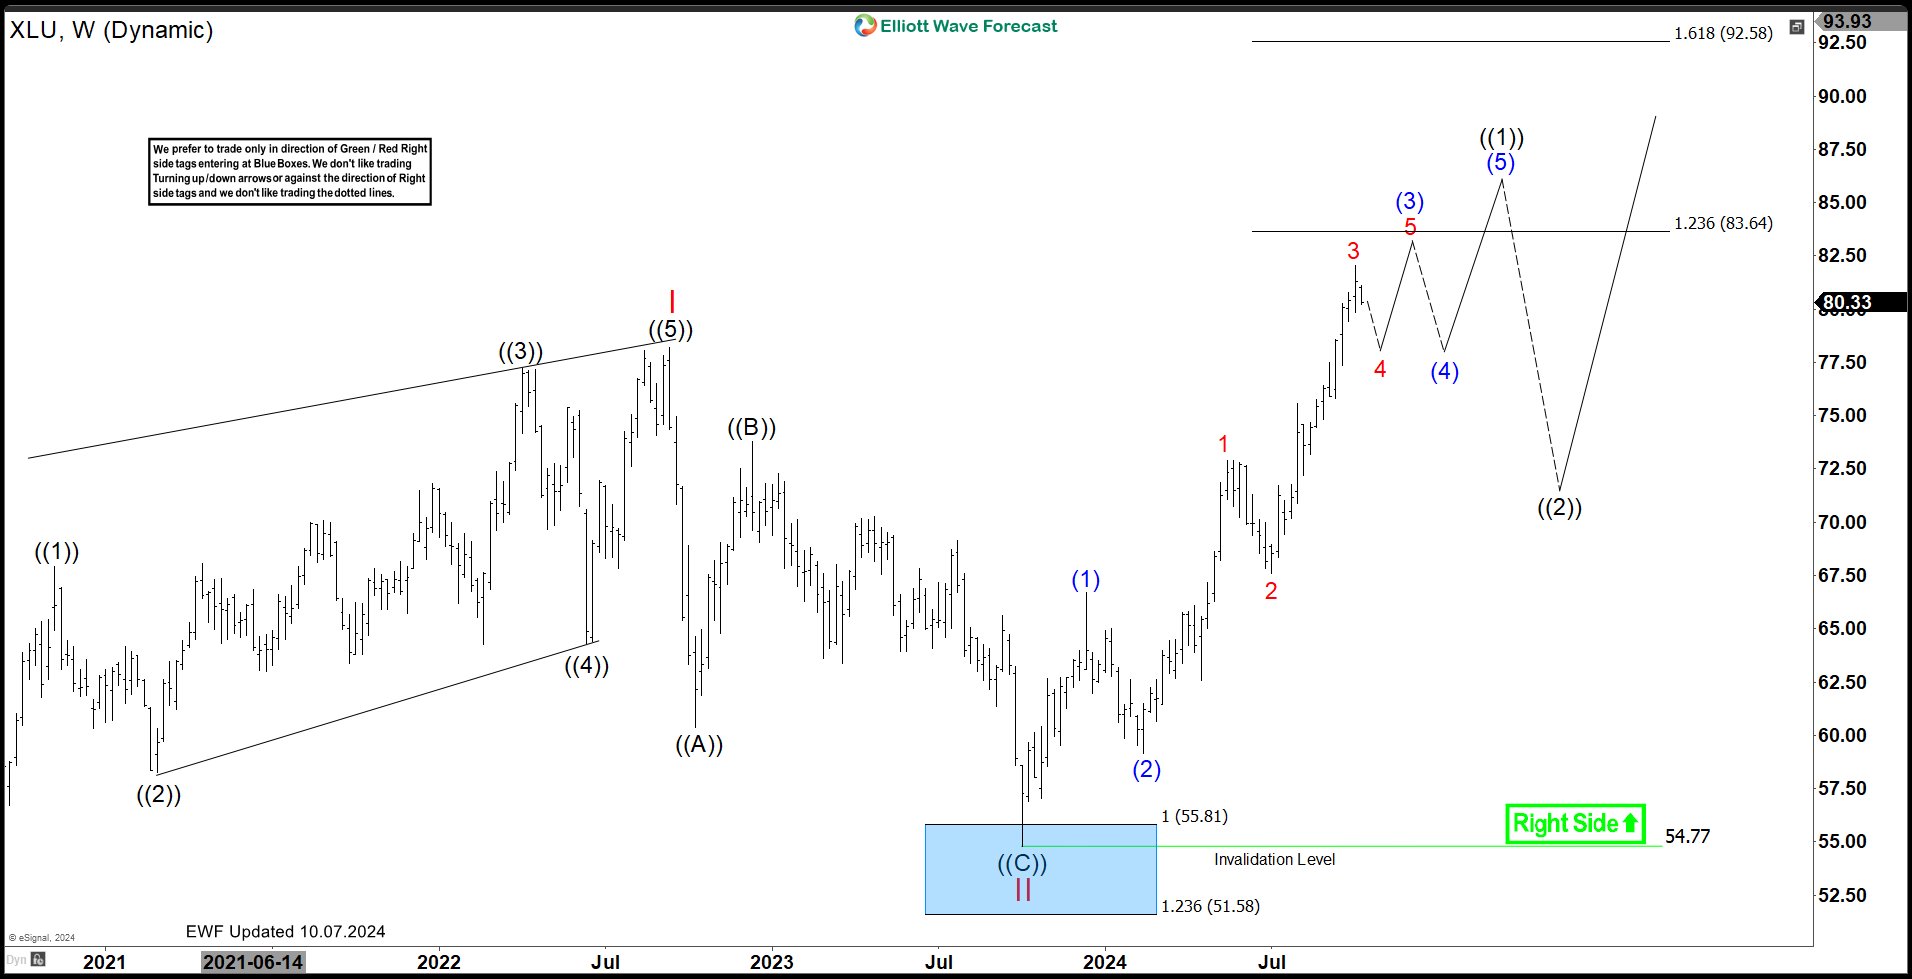
$XLU Weekly Elliott Wave View – Oct 07, 2024:
The latest weekly update is showing that the ETF has broke above the all-time highs. As a result, it has opened a bullish sequence. We expect The ETF to continue its rally towards the $83.64 – $92.58 range in a series of wave 4 and 5 pattern. Traders can look for re-entry opportunities at red 4 and blue (4) in 3 or 7 swings. Once the pattern is complete, a larger degree pullback in black ((2)) is expected to take place to correct the entire cycle from Oct 2023 low.
Elliott Wave Forecast
At Elliott Wave Forecast, we cover 78 instruments, providing comprehensive analysis and updates. Please note that not every chart is a trading recommendation. Official Trading Recommendations are available in our Live Trading Room. If you’re not a member yet, Sign Up for 14 days Trial to access new trading opportunities and enhance your trading strategy.
Welcome to Elliott Wave Forecast!


