Hello everyone! In today’s article, we will follow up on the past performance of the Real Estate ETF ($IYR) forecast. We will also review the latest weekly count. First, let’s take a look at how we analyzed it back in March 2023.
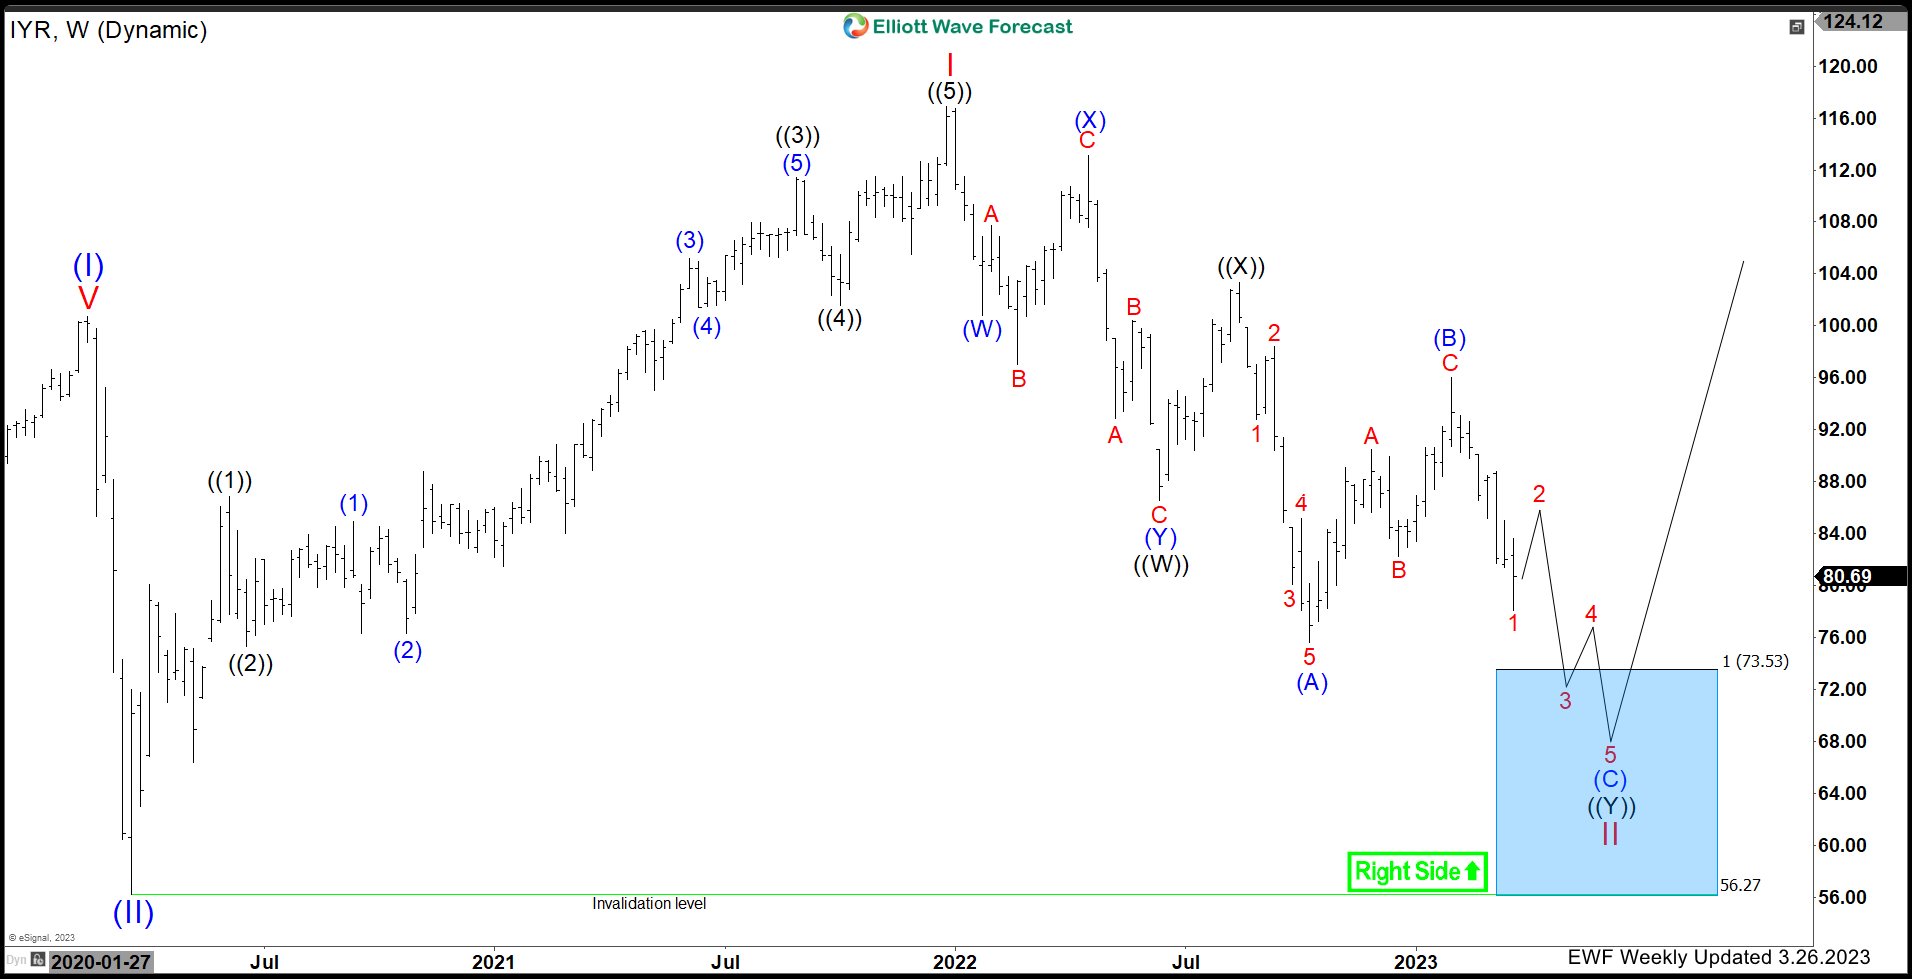
$IYR Weekly Elliott Wave View – March 2023:
 In our last article, we said that “we don’t believe in a crash but a correction is clearly unfolding and soon buyers will appear at the Blue Box area for a reaction higher. Once the reaction higher unfolds, we will be able to tell if the low is in place and continue higher or more downside will follow.”
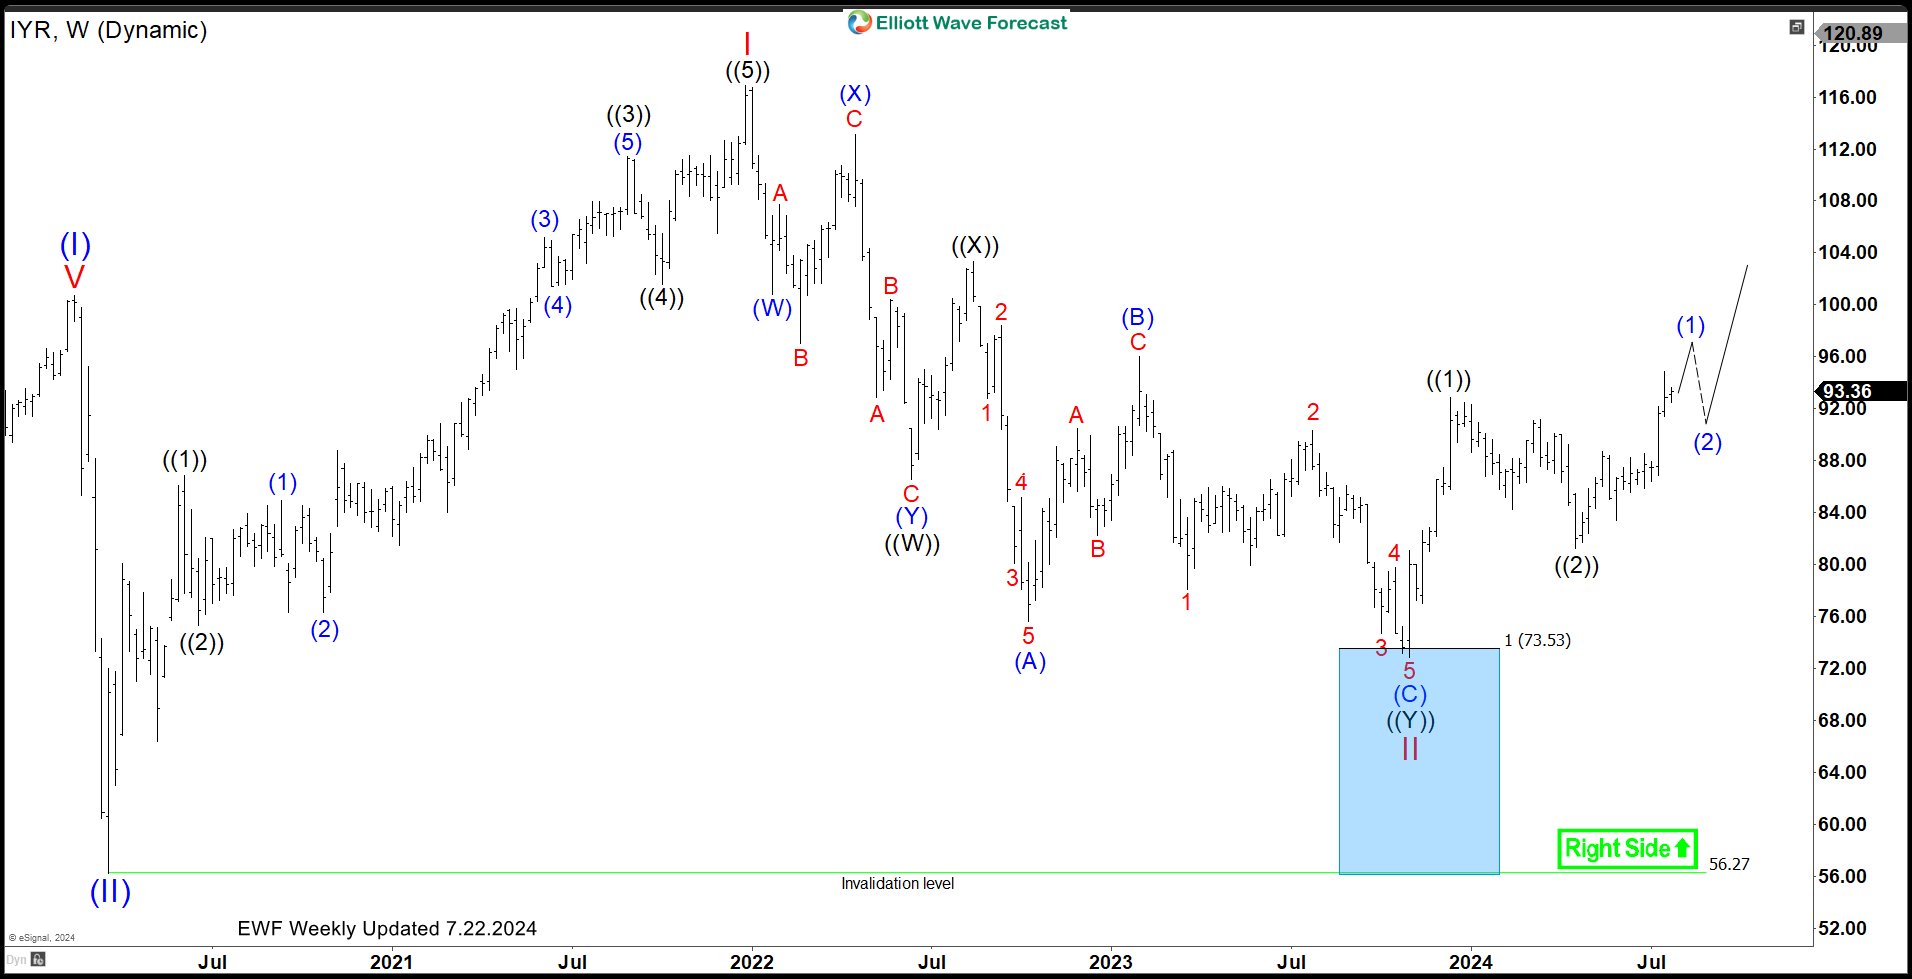
$IYR Weekly Elliott Wave View – July 22, 2024:
 The latest weekly update confirms that $IYR has ended the cycle lower after bouncing from the Blue Box area at $73.53 – 56.27. As a result, the ETF has moved higher, allowing long positions to become risk-free. We expect $IYR to rally in one more push to make a 5-wave pattern before another pullback occurs. Traders should look for re-entry opportunities at blue (2) in 3 or 7 swings due to the incomplete bullish sequence with a target of $101 – 114.
Elliott Wave Forecast
At Elliott Wave Forecast, we cover 78 instruments, providing comprehensive analysis and updates. Please note that not every chart is a trading recommendation. Official Trading Recommendations are available in our Live Trading Room. If you’re not a member yet, Sign Up for 14 days Trial to access new trading opportunities and enhance your trading strategy.
Welcome to Elliott Wave Forecast!
Back
