Paypal (NASDAQ: PYPL) is an American online payments company that enables digital and mobile payments on behalf of consumers and merchants worldwide.
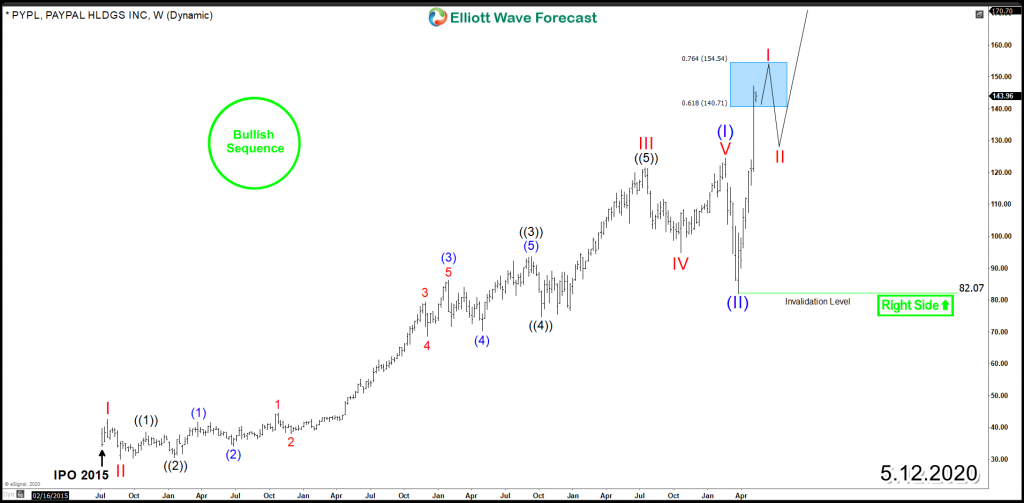
Last week, PYPL broke above February 2020 peak to hit an all-time high few days before its first-quarter results then after the earnings came out it soared again. It’s currently up 30% year-to-date and up 68% off March low.
Earlier this year, PYPL ended the rally from 2015 low at $124 as an impulsive 5 waves advance within wave (I) then it corrected that cycle lower in wave (II)) which didn’t take much as the stock dropped 33% in 1 month before buyers stepped again at $82.. Based on the Elliott Wave Theory, a 5 waves advance is followed by a corrective 3 waves pullback then the instrument would resume the main trend looking for another 5 waves to take place at least.
The break higher that took place last week, confirmed the resumption of the bullish trend and opened an incomplete sequence for the stock toward 100% – 161.8% Fibonacci extension area $176 – $235. Consequently, Paypal is now looking to remain supported above march low $82 and buyers will be looking to join the rally. The next potential opportunity could be soon taking place in short term as the stock entered an extreme area at $140 – $154 which can provide a pullback in 3 or 7 swings which can be used to enter the market before further upside takes place.
PYPL Weekly Chart
Get our latest updates about Technology Sector by taking this opportunity to try our services 14 days for Free and learn how to trade Stocks and ETFs using our blue boxes. You will get access to our 78 instruments updated in 4 different time frames, Live Trading & Analysis Session done by our Expert Analysts every day, 24-hour chat room support and much more.
Back

