

The Power of 3-7-11 and the Grand Super Cycle: How We Saw the Bullish Turn in April 2025 Back on April 9, 2025, while World Indices were dropping sharply and global sentiment had turned overwhelmingly bearish, we published an article that challenged the fear-driven narrative. We explained why selling was not the right approach and […]
-
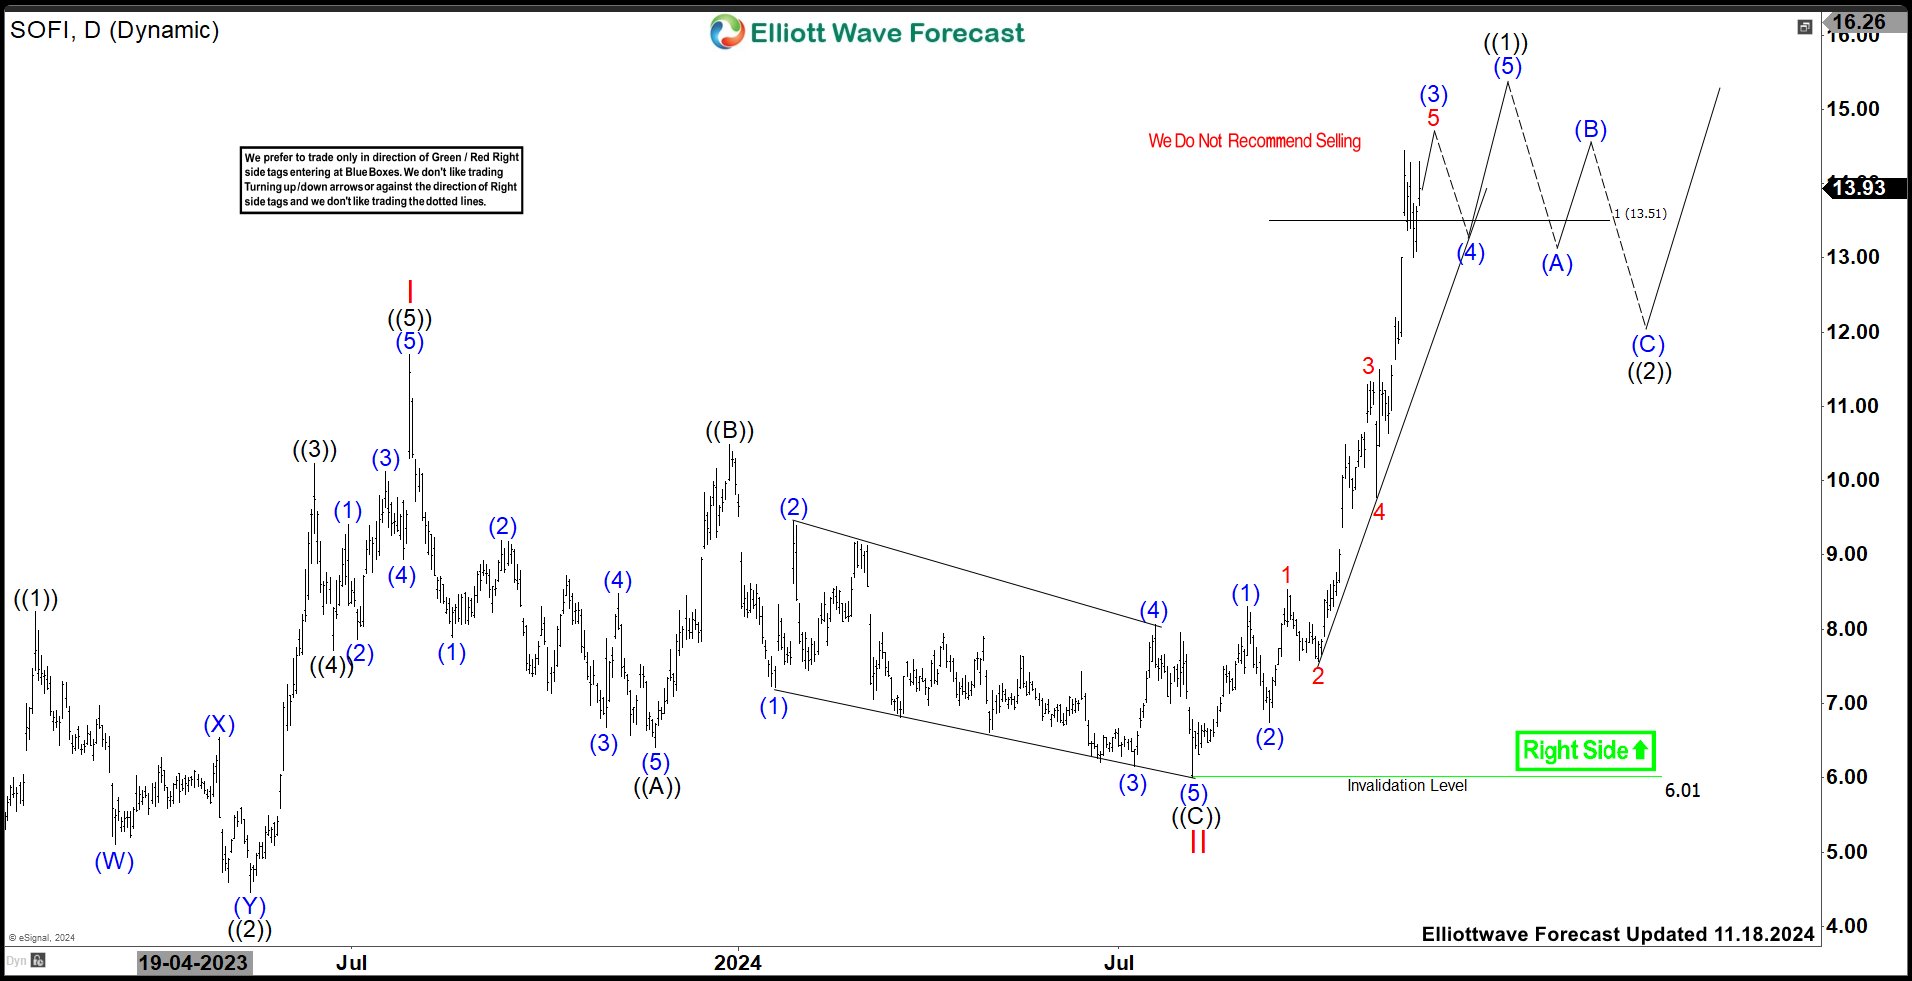
Will SoFi Technologies (SOFI) Continue Rally Or Correct Soon?
Read MoreSoFi Technologies, Inc., (SOFI) provides various financial services in the US, Latin America & Canada. It operates through three segments; Lending, Technology Platform & Financial services. It is based in San Francisco, CA, comes under Financial Services sector & trades as “SOFI” ticker at Nasdaq. As mentioned in the last article, SOFI confirmed bullish sequence […]
-

Gold Miners Junior (GDXJ) Looking for Correction to End Soon
Read MoreGold Miners Junior ETF (GDXJ) is looking to End Correction Soon. This article and video look at the Elliott Wave path for the ETF.
-
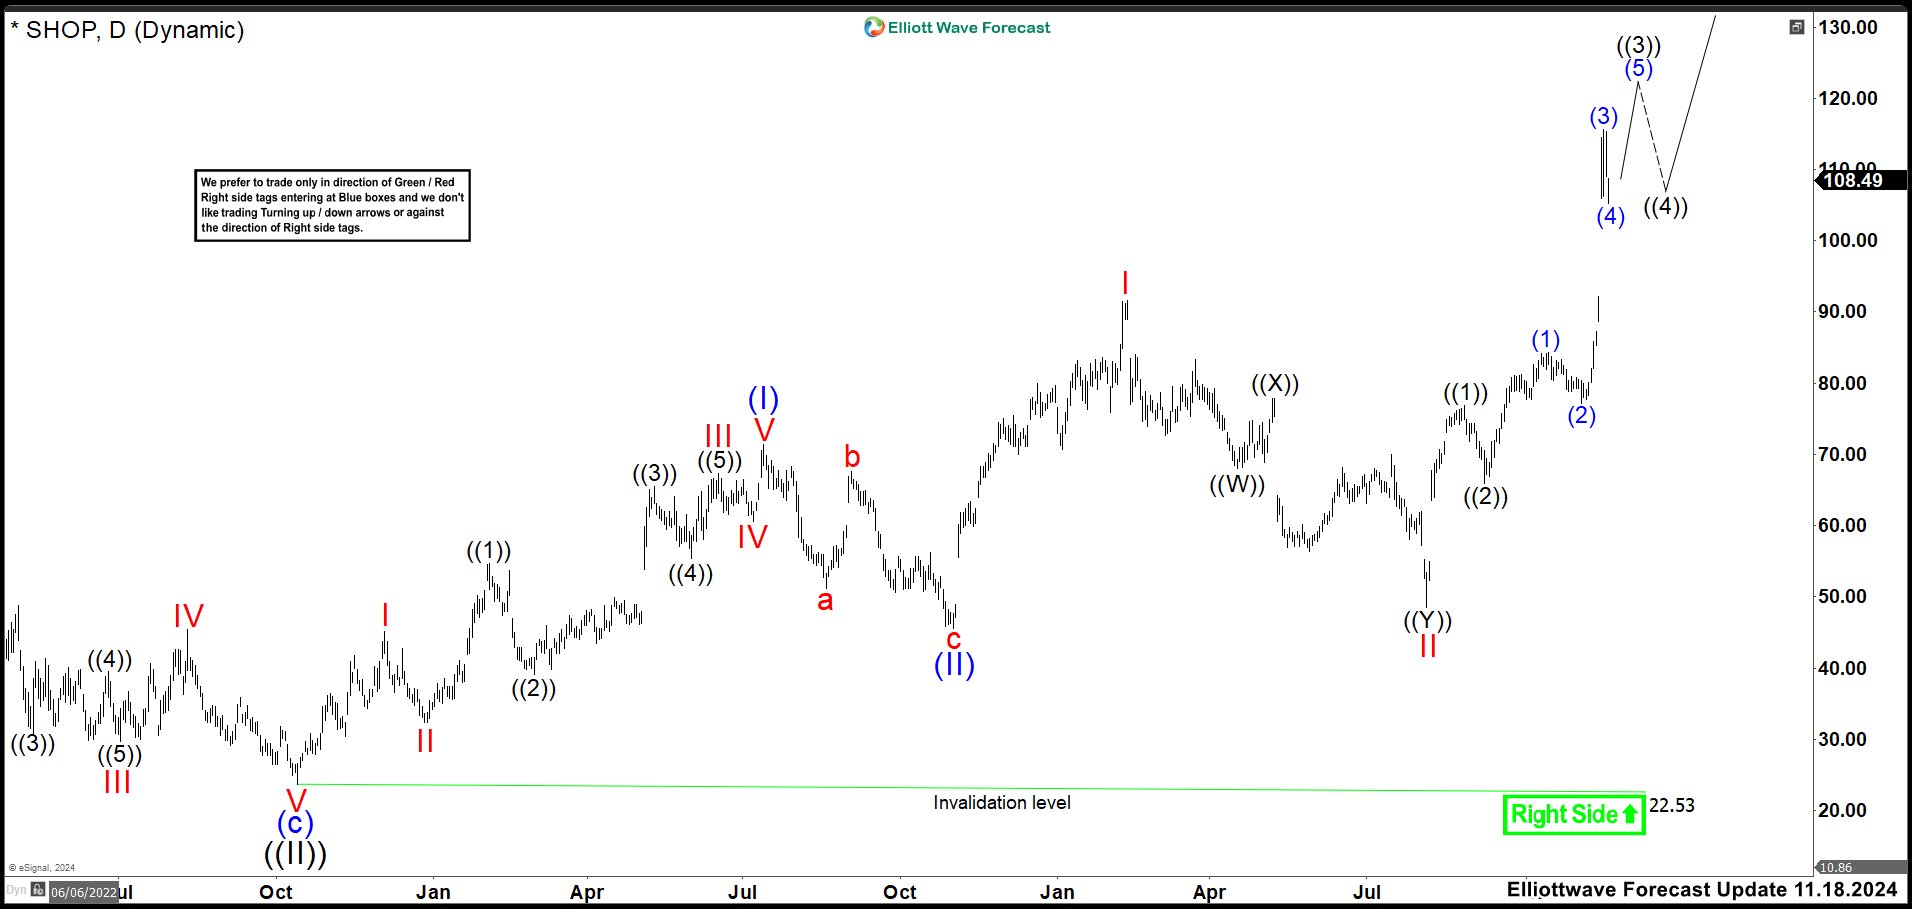
Shopify (SHOP) Rallied Suggesting Nest Completed.
Read MoreShopify Inc. is a Canadian multinational e-commerce company in Ottawa, Ontario. Shopify (SHOP) is the name of its proprietary e-commerce platform for online stores and retail point-of-sale systems. The Shopify platform offers online retailers a suite of services including payments, marketing, shipping and customer engagement tools. Shopify ended a Grand Supercycle in July 2021 and we labeled it as wave ((I)). Since then, it entered in a flat […]
-
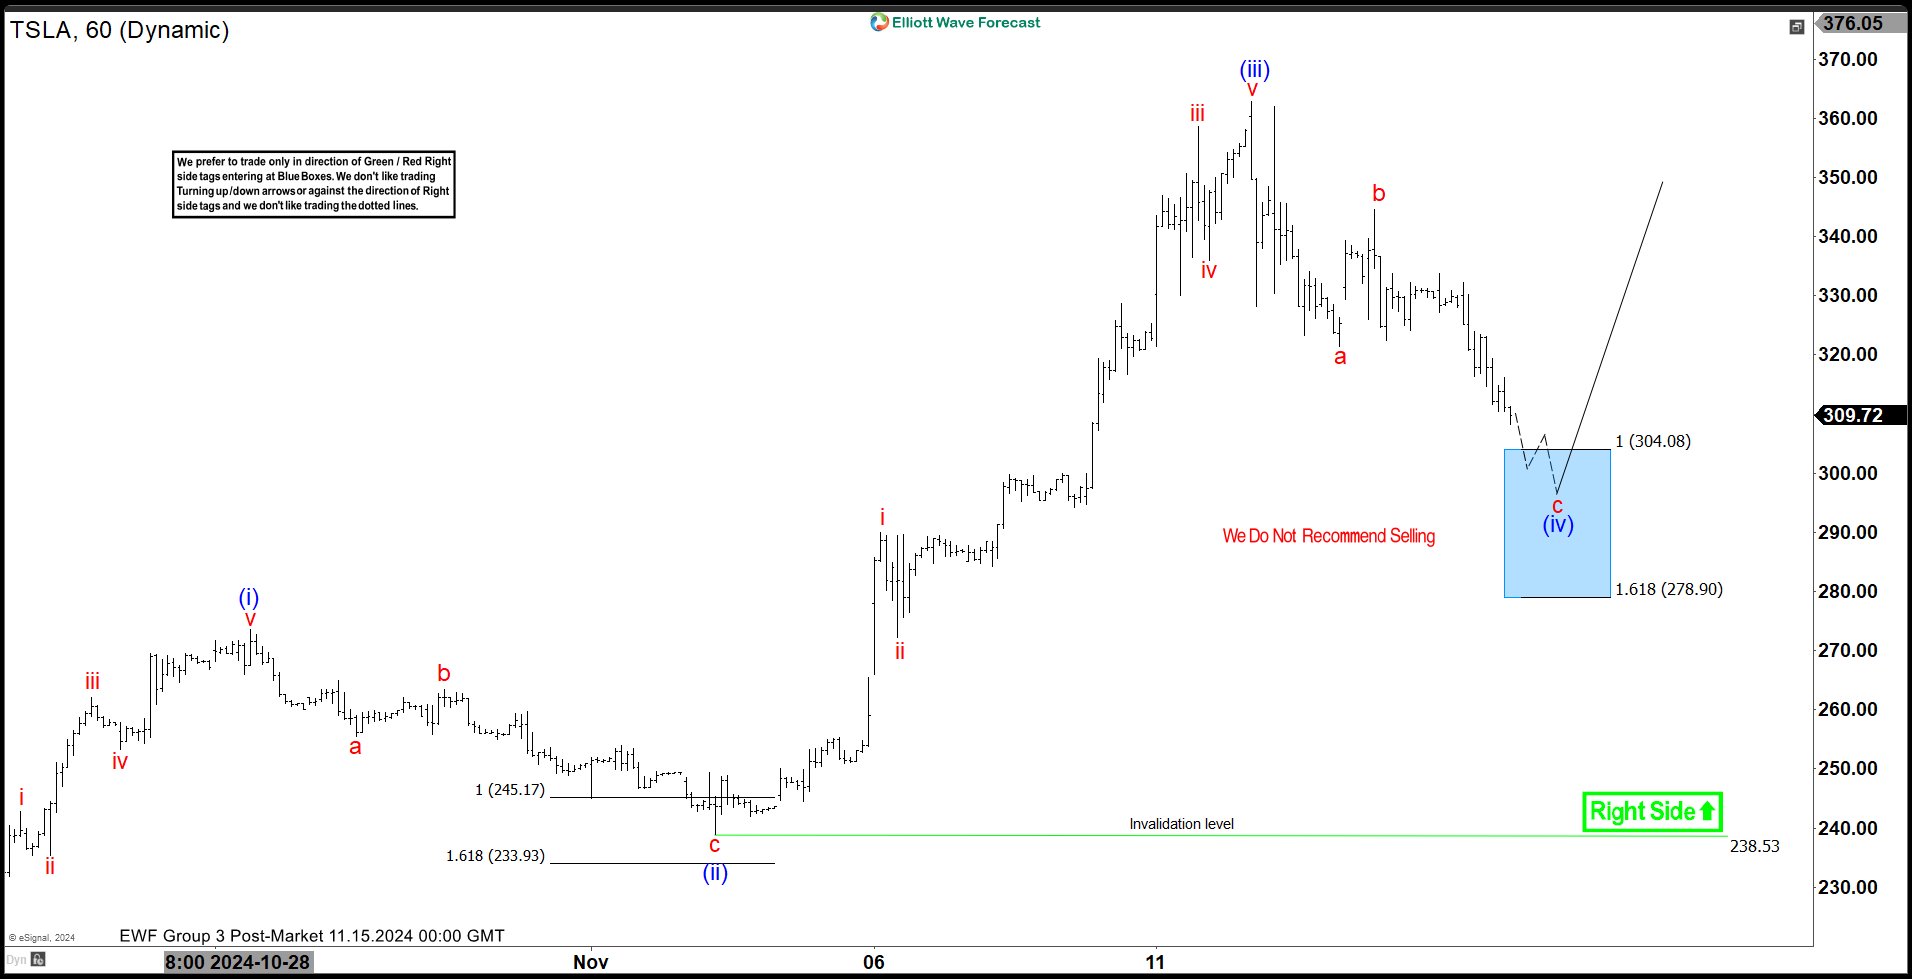
Tesla Inc. ( $TSLA) Elliott Wave Analysis: The Rally and What’s Next
Read MoreHello everyone! In today’s article, we’ll examine the recent performance of Tesla Inc. ($TSLA) through the lens of Elliott Wave Theory. We’ll review how the rally from the November 4, 2024, low unfolded as a 5-wave impulse and discuss our forecast for the next move. Let’s dive into the structure and expectations for this stock. 5 Wave Impulse Structure […]
-
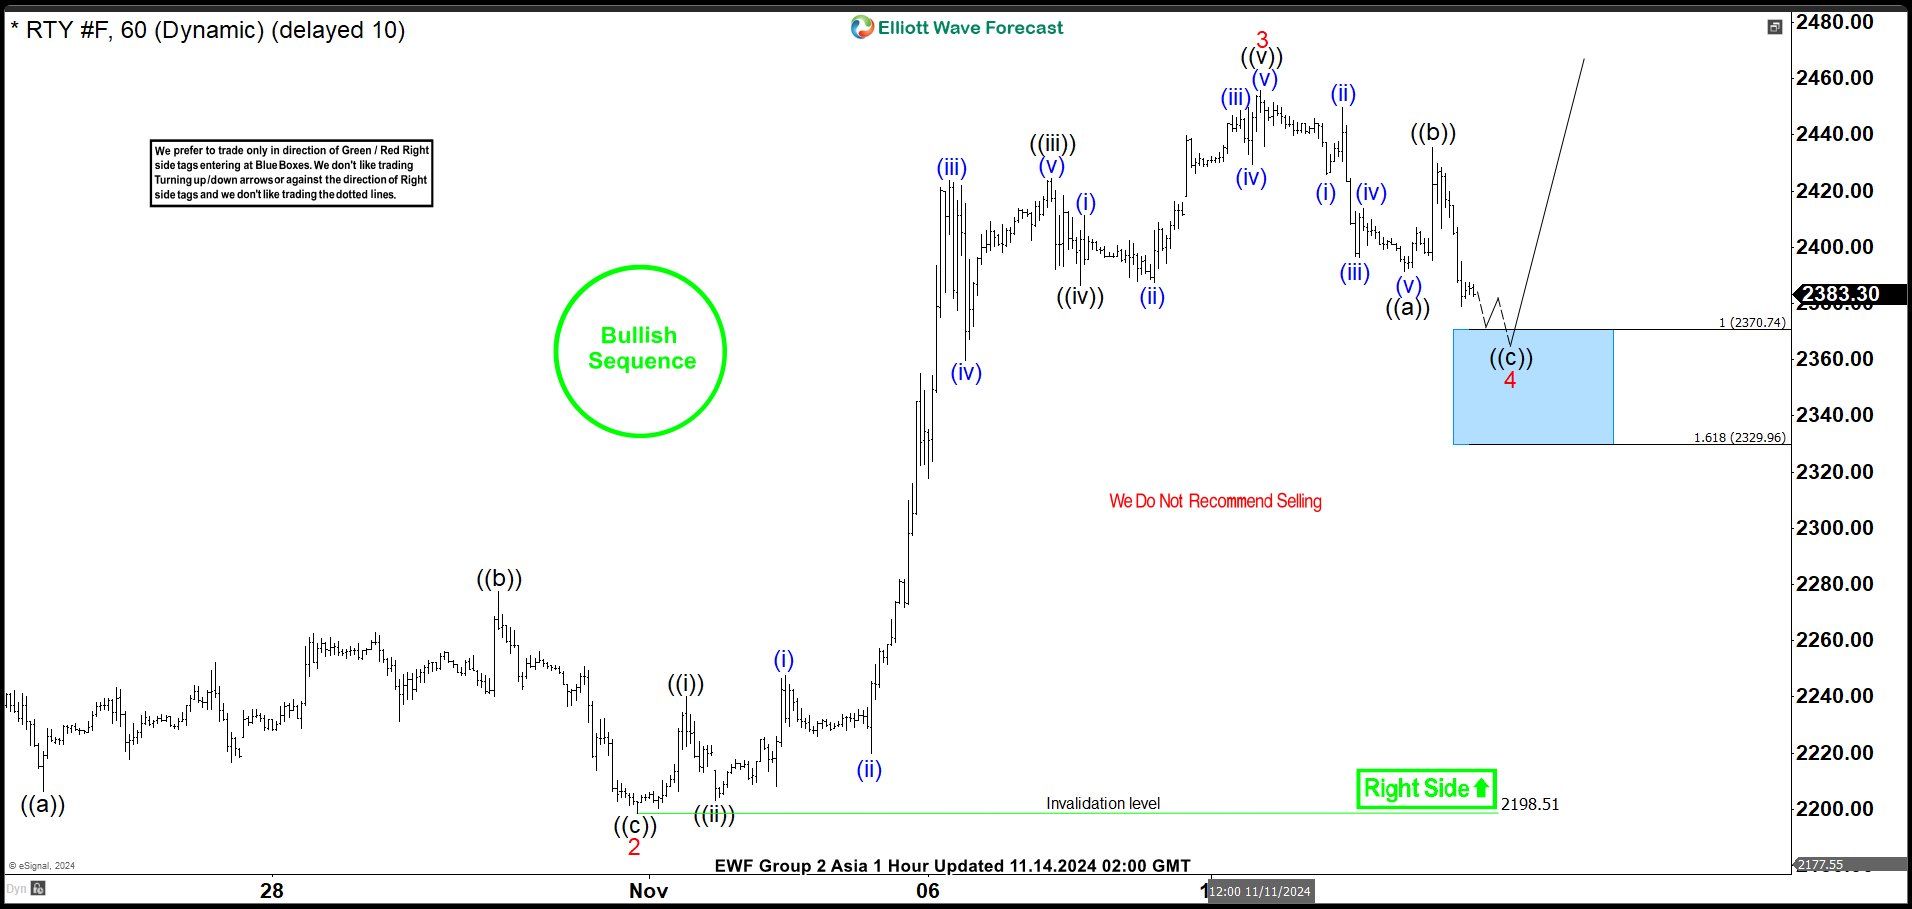
Elliott Wave Intraday View on Russell 2000 (RTY) Calling for Index to Resume Higher
Read MoreRussell 2000 (RTY) pullback is expected to find buyers in 3, 7, or 11 swing. This article and video look at the Elliott Wave path.
-
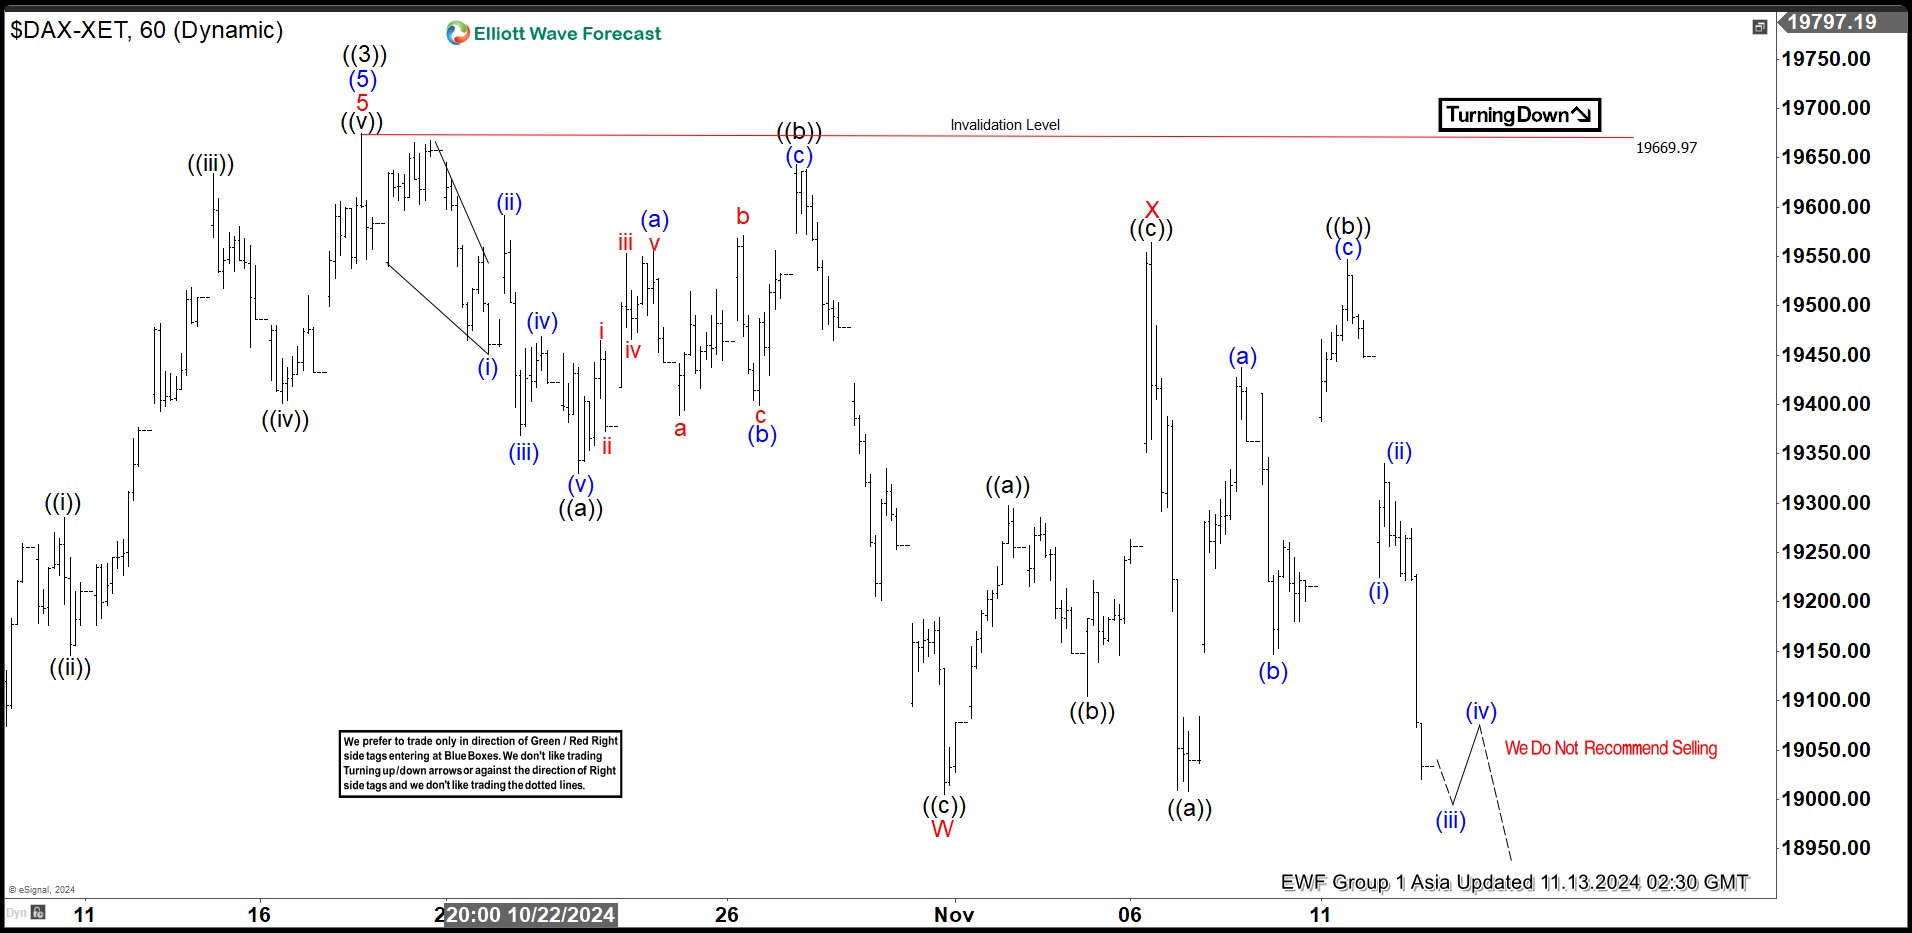
Elliott Wave View on DAX Looking for Larger Degree Correction
Read MoreDAX is looking for a bigger degree correction and rally should fail in 3, 7, 11 swing. This article and video look at the Elliott Wave path.