

The Power of 3-7-11 and the Grand Super Cycle: How We Saw the Bullish Turn in April 2025 Back on April 9, 2025, while World Indices were dropping sharply and global sentiment had turned overwhelmingly bearish, we published an article that challenged the fear-driven narrative. We explained why selling was not the right approach and […]
-
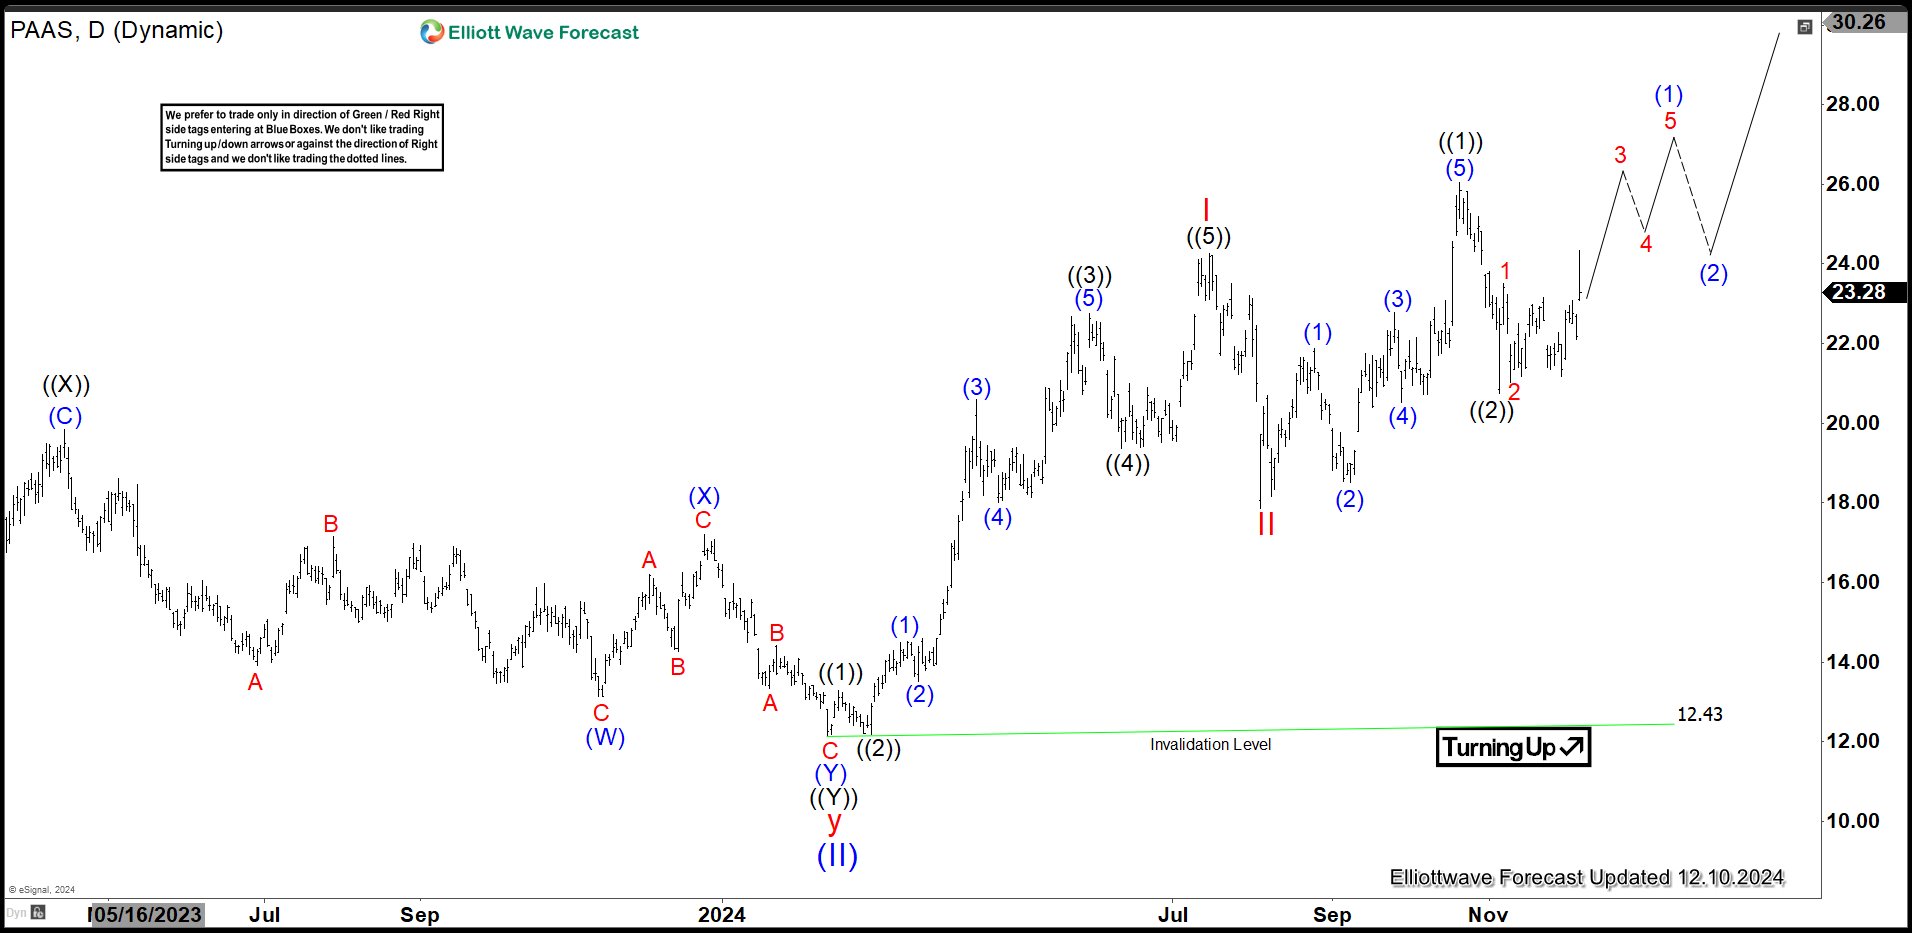
Pan American Silver (PAAS) Impulsive Rally in Progress
Read MorePan American Silver Corp. (PAAS) is a mining company headquartered in Vancouver, Canada. It specializes in the exploration, development, extraction, processing, refining, and reclamation of silver, gold, zinc, lead, and copper mines. Established in 1979, the company operates mines across Canada, Mexico, Peru, Bolivia, Argentina, Chile, and Brazil. PAAS Monthly Elliott Wave Chart Monthly Elliott […]
-
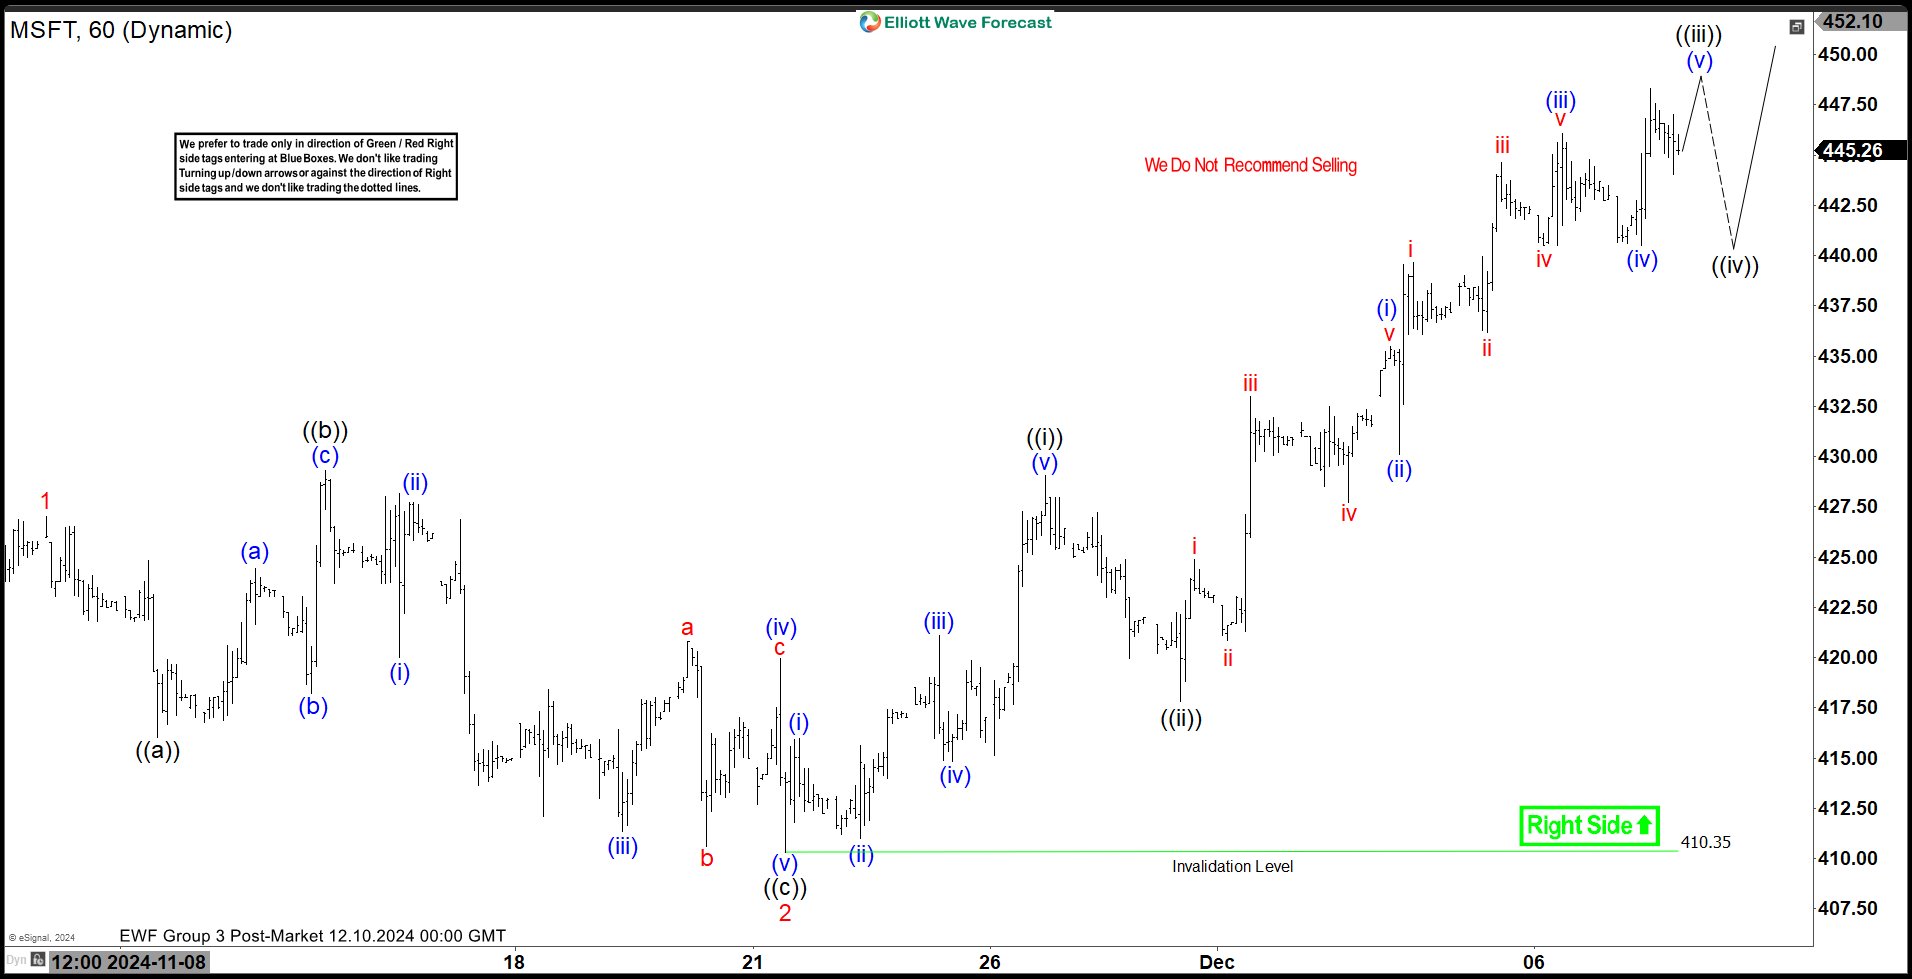
Elliott Wave View: Microsoft (MSFT) Shows Incomplete Impulsive Structure
Read MoreMicrosoft (MSFT) shows incomplete impulsive structure favoring upside. This article and video look at the Elliott Wave path of the stock.
-
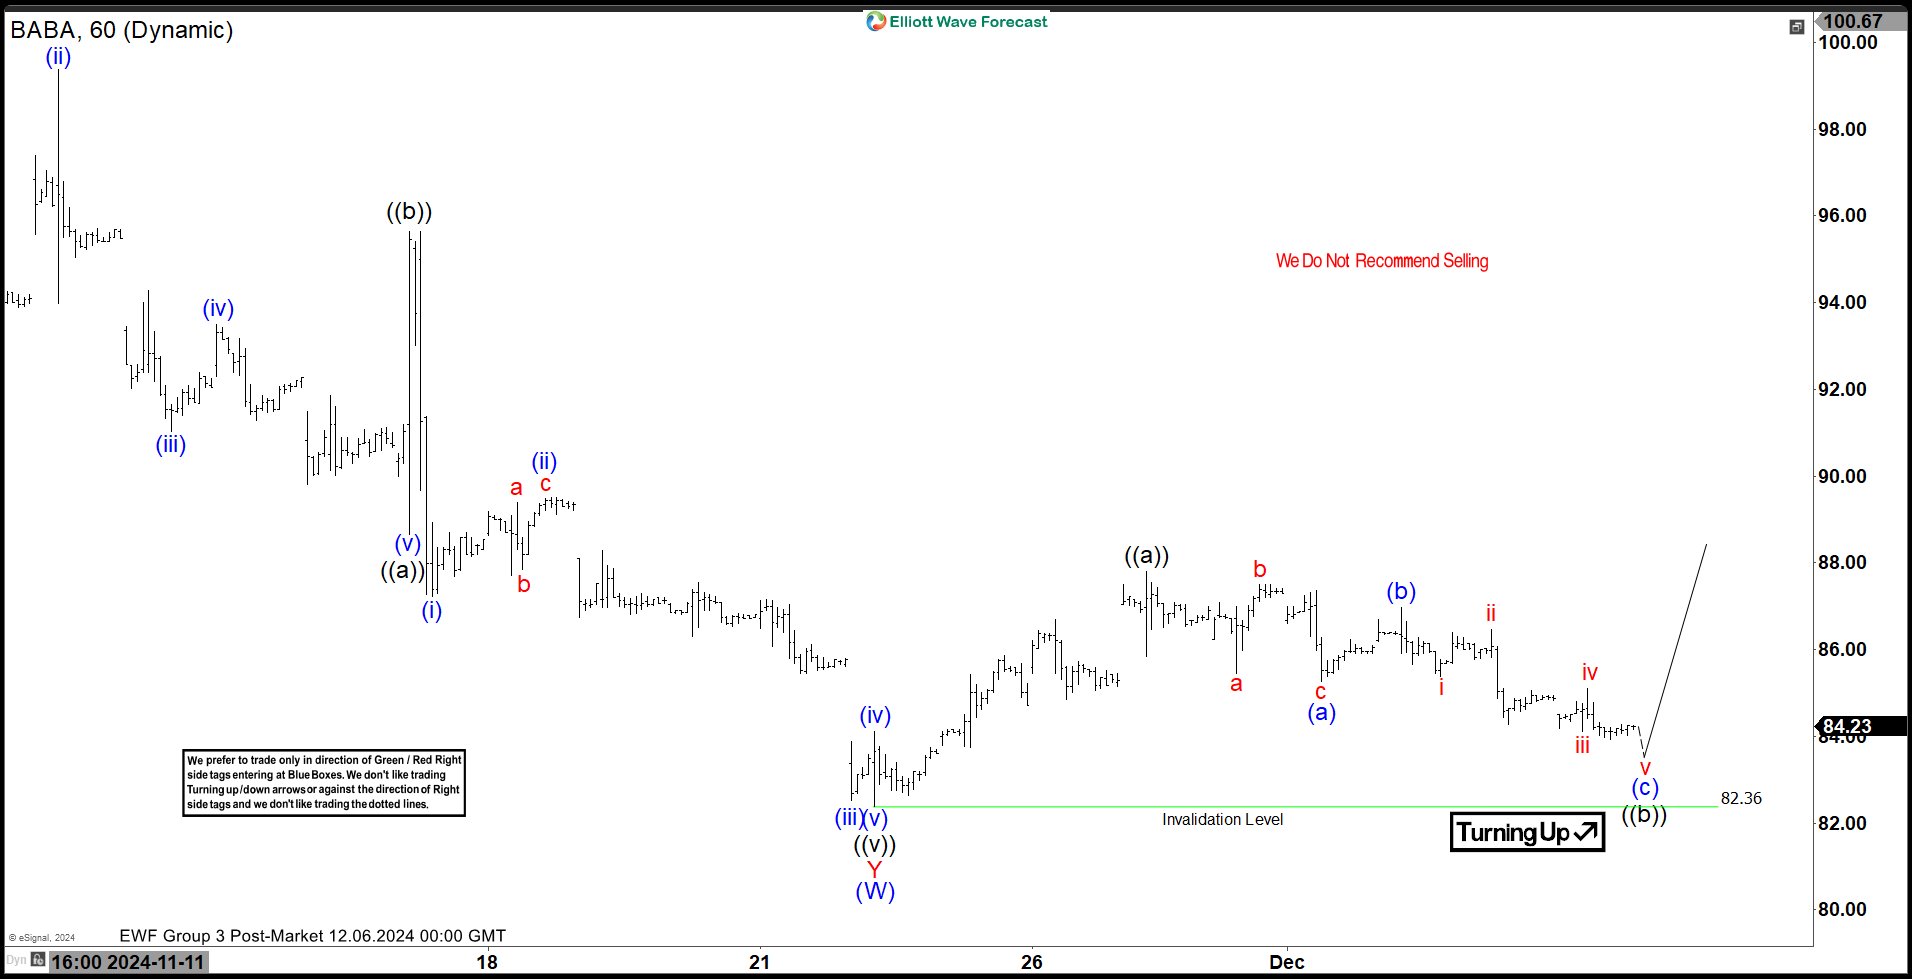
Elliott Wave Suggests Alibaba Group $BABA Can Reach $130 in 2025
Read MoreHello everyone! In today’s article, we’ll examine the recent performance of Alibaba Group ($BABA) through the lens of Elliott Wave Theory. We’ll review how the rally from the November 22, 2024, low unfolded as a 5-wave impulse and discuss our forecast for the next move. Let’s dive into the structure and expectations for this stock. 5 Wave Impulse Structure + […]
-
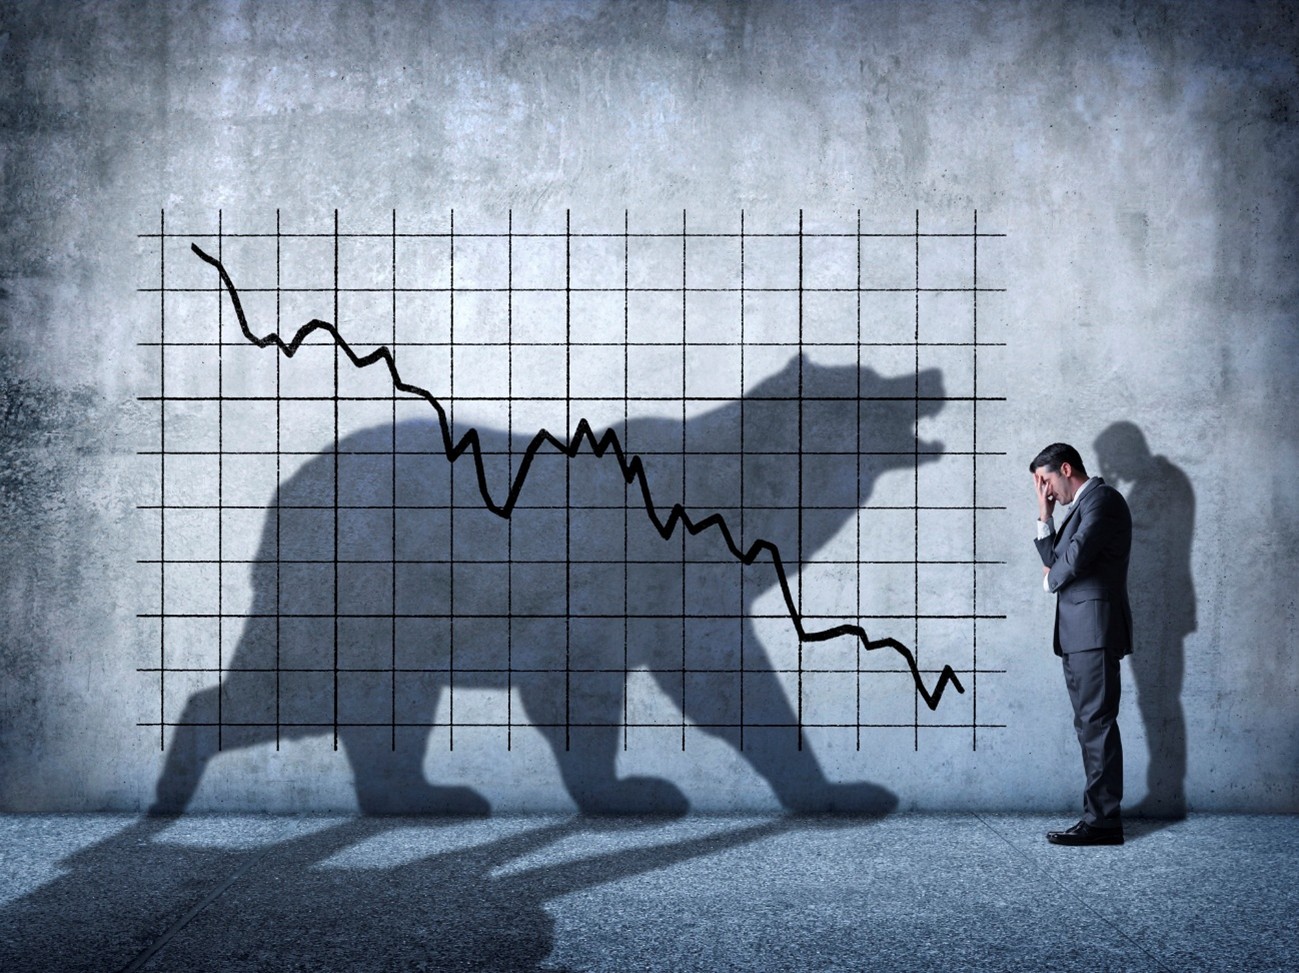
The Impact of a Potential WWIII on Financial Markets
Read MoreThe ongoing conflict between Russia and Ukraine has raised concerns about the possibility of it escalating into a global conflict, potentially leading to World War III. While such a scenario remains speculative, the economic impact of a large-scale war would be profound, affecting various sectors of the financial markets, including stocks, commodities, forex, and cryptocurrencies. […]
-
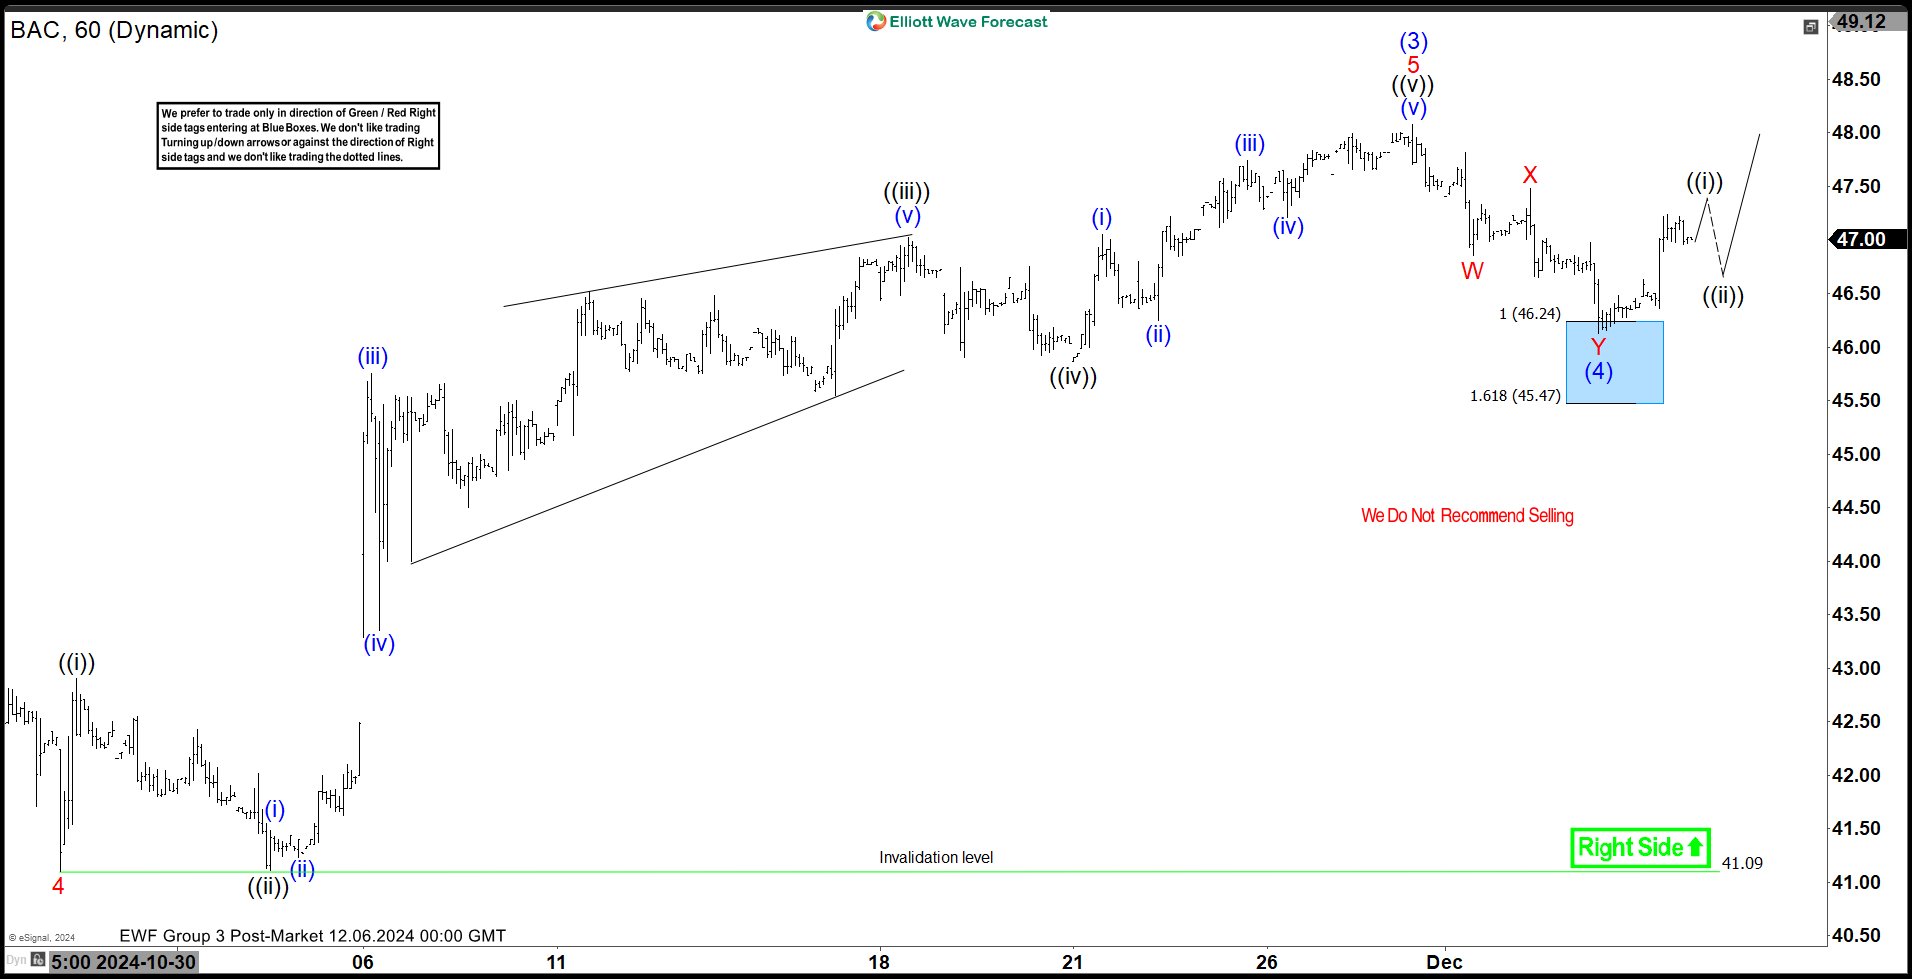
Elliott Wave Analysis: BAC Found Support From Blue Box
Read MoreHello traders. Welcome to another blog post where we share how members of Elliottwave-Forecast trade using the Elliott wave theory. In this post, the spotlight will be on the Bank of America Corporation BAC, which has the ticker $BAC. BAC is one of the stocks still recovering from the 2008 global financial crisis. After plunging […]
-
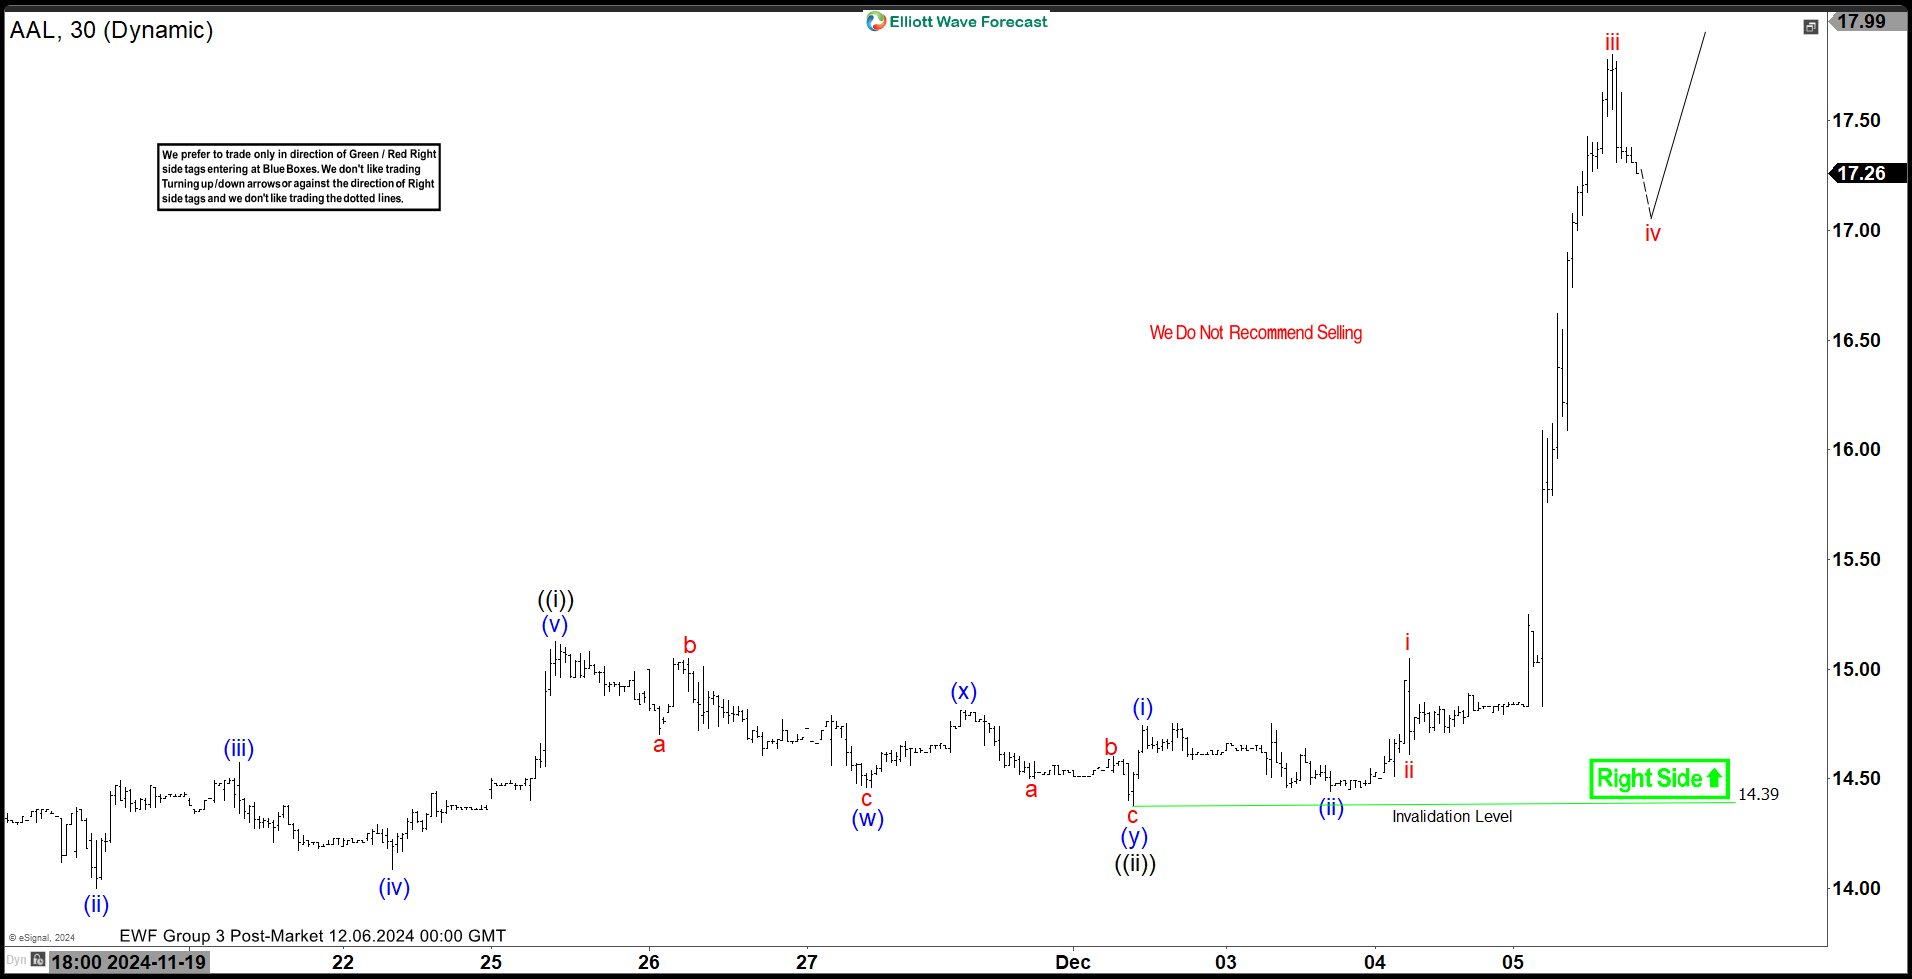
Elliott Wave View: Strong Impulsive Rally in American Airlines (AAL) Favors Upside
Read MoreAmerican Airlines (AAL) Rally Strongly as Impulse Favoring Upside. This article and video look at the Elliott Wave path of the stock