
The Power of 3-7-11 and the Grand Super Cycle: How We Saw the Bullish Turn in April 2025 Back on April 9, 2025, while World Indices were dropping sharply and global sentiment had turned overwhelmingly bearish, we published an article that challenged the fear-driven narrative. We explained why selling was not the right approach and […]
-

Gold Miners Junior ETF (GDXJ) Has Resumed the Rally Higher
Read MoreGold Miners Junior ETF (GDXJ) has completed correction and resumed higher. This article and video look at the Elliott Wave path.
-

BAC Rebounds From Blue Box, Buyers Hit Easy Target
Read MoreHello traders. Welcome to another blog post where we discuss recent trade setups from the blue box. In this post, the spotlight will be on the Bank of America, BAC with the ticker $BAC. The stock recently reached the blue box where buyers went long. How did we come about this setup and what should […]
-

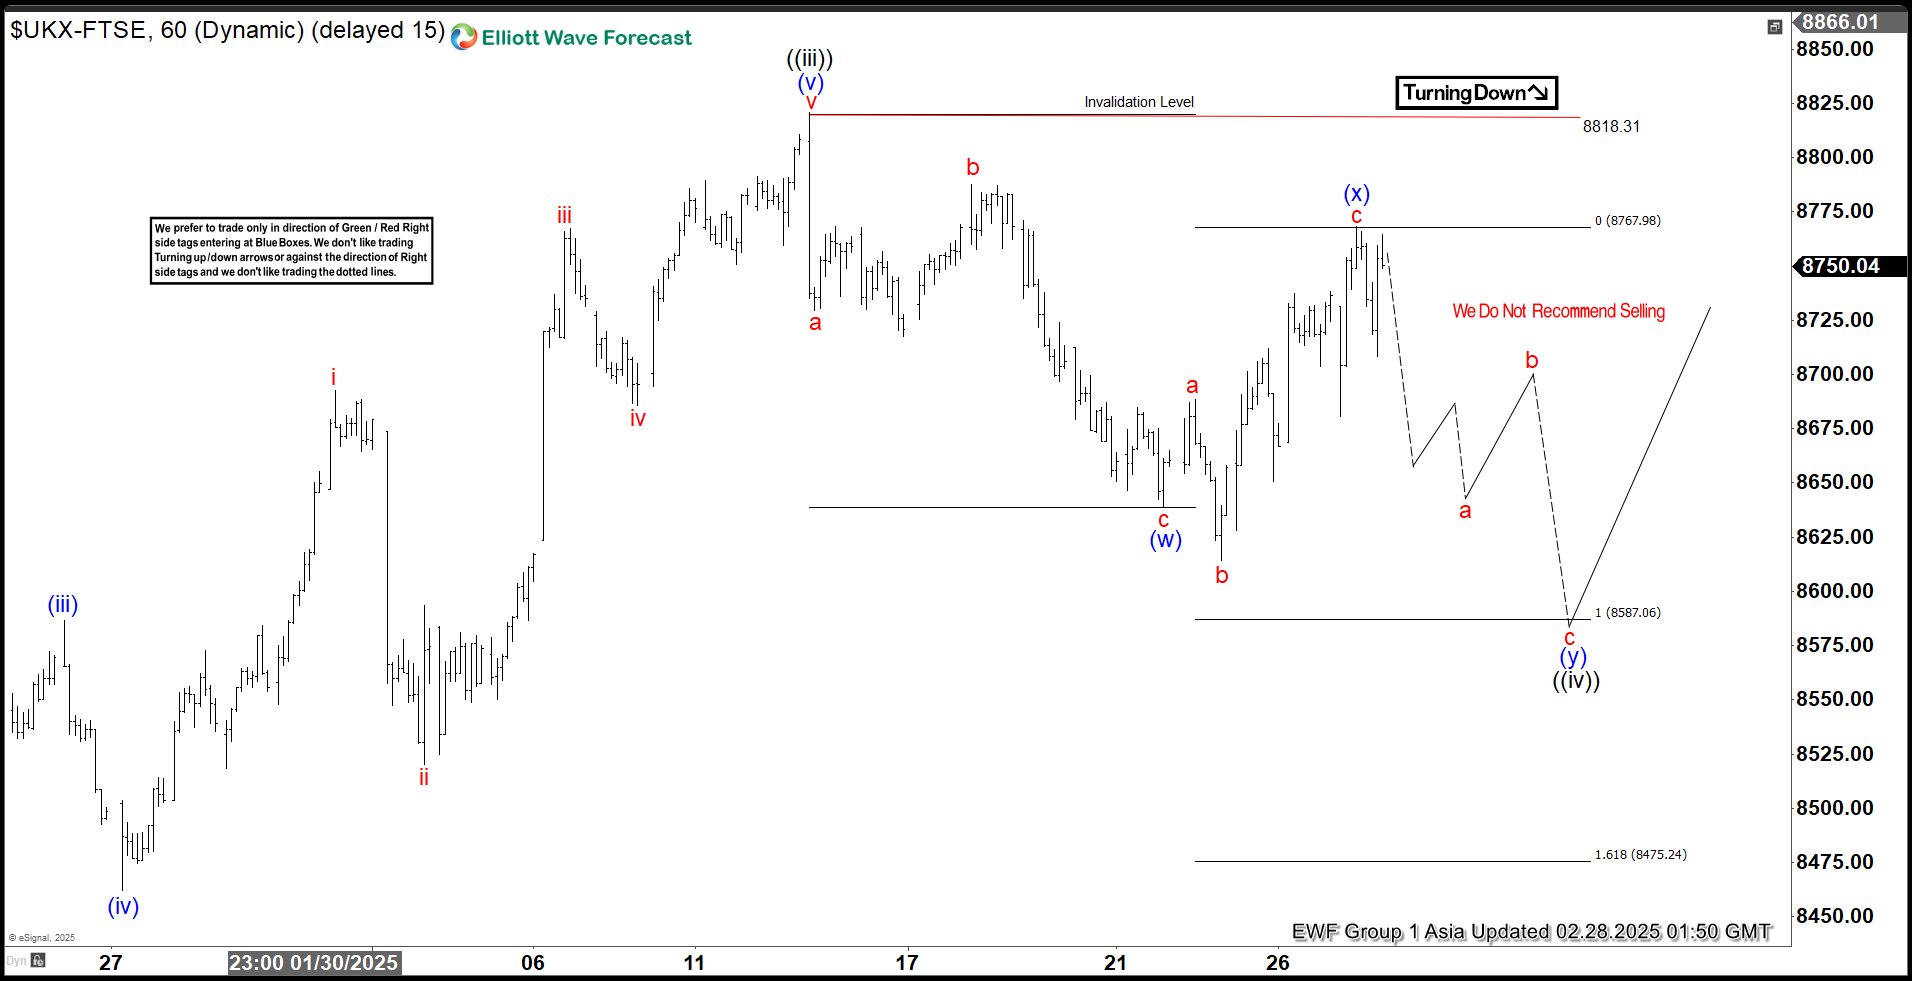
Elliott Wave View: FTSE Should See More Downside
Read MoreFTSE is looking to correct further as a double three Elliott Wave structure. This article and video look at the Elliott Wave path.
-

Boyd Gaming Corp (NYSE: BYD) Bullish Sequence Supports Upside
Read MoreBoyd Gaming Corp (NYSE: BYD) is a multi-jurisdictional gaming company, which engages in the management and operation of gaming and entertainment properties. In this article, we delve into the Elliott Wave analysis of BYD, uncovering bullish structure that could captivate the attention of both long-term investors and short-term traders. The super cycle for BYD is showing an impulsive 3 […]
-

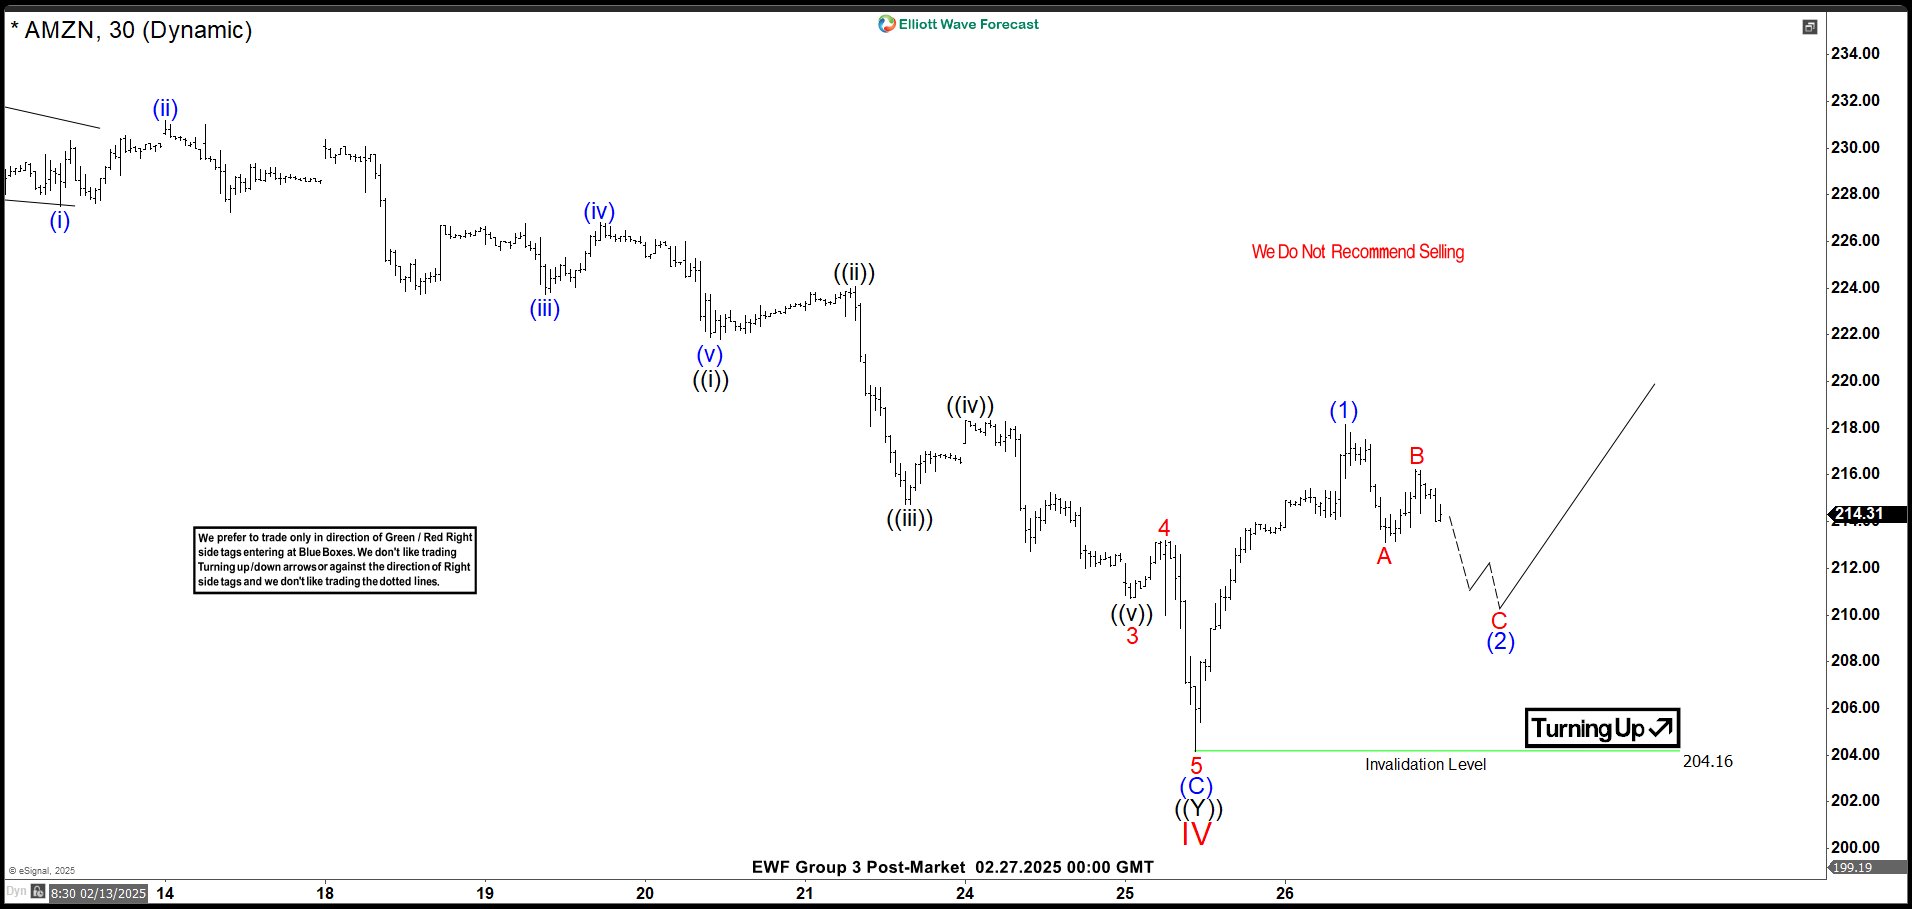
Elliott Wave View: Amazon (AMZN) Short Term May See Further Upside
Read MoreAmazon (AMZN) has ended a double three correction and turned higher. This article and video look at the Elliott Wave path of the stock.
-

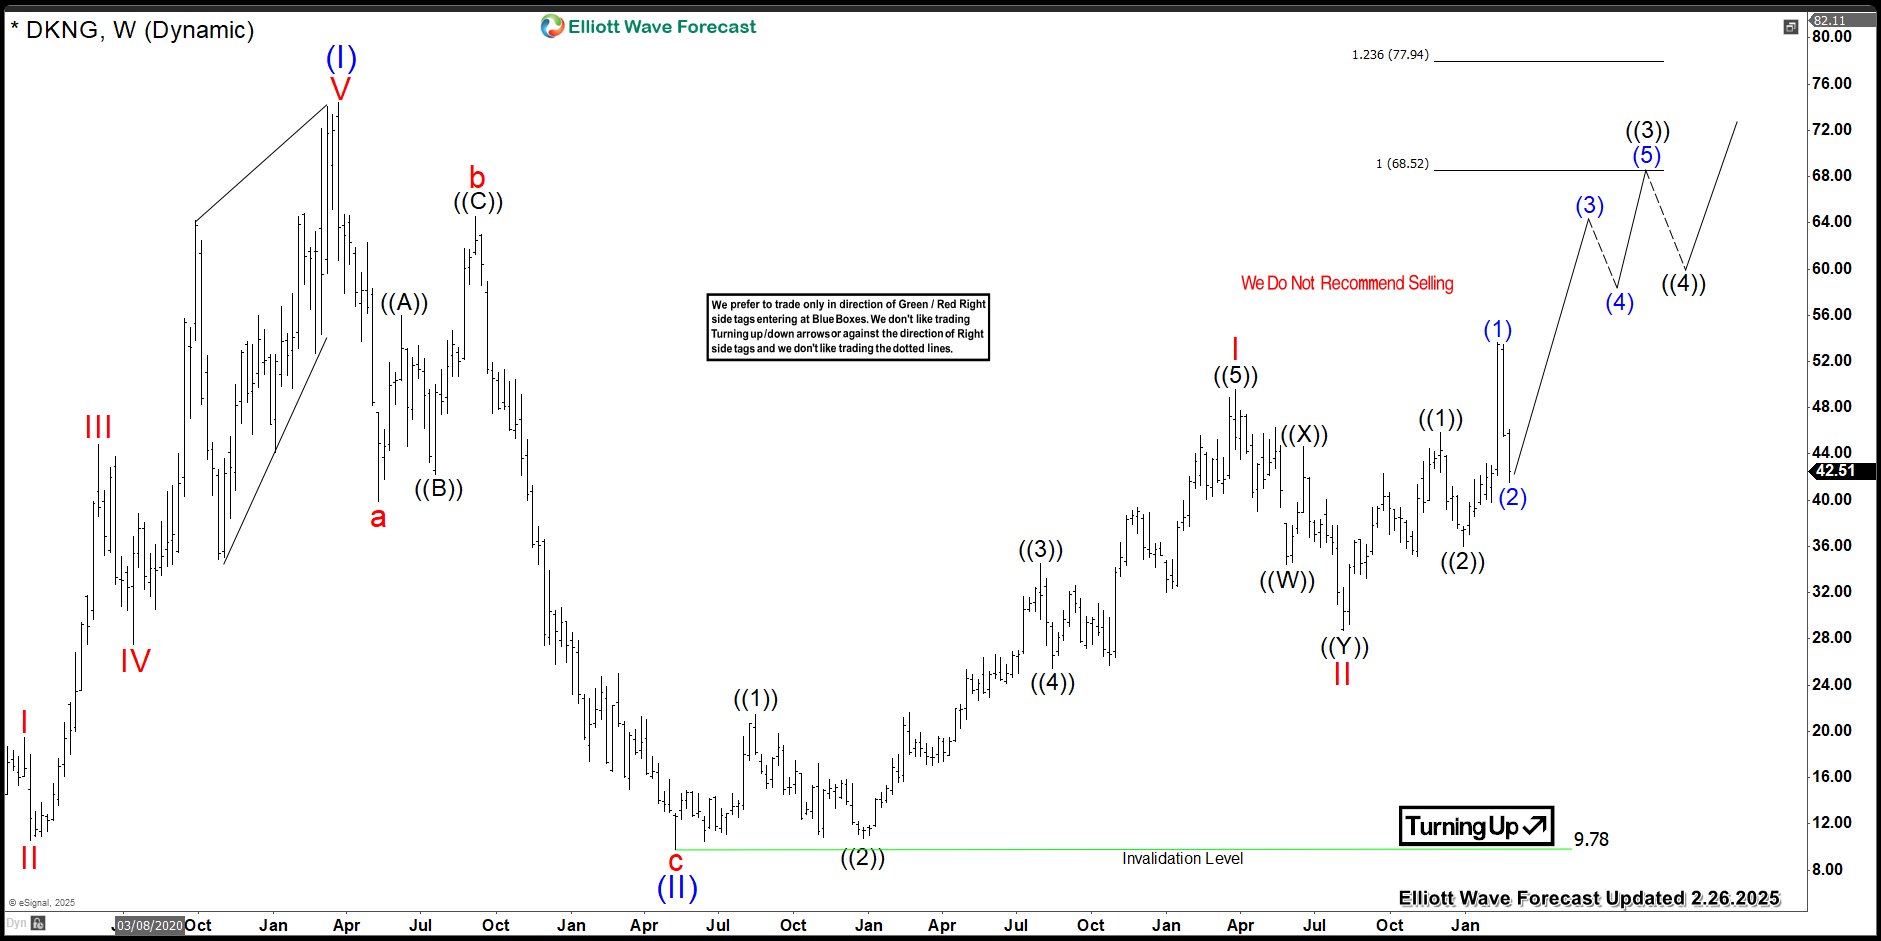
DKNG Returned Higher After Completing The Pullback
Read MoreThe Draft Kings, Inc. ticker symbol: DKNG is a digital sports entertainment and gaming company engaged in providing online sports betting. Online casinos, daily fantasy sports product offerings, Draft Kings Marketplace. Retail sports betting, media and other gaming product offerings. consumption. It operates through the following segments: Business-to-Consumer (B2C) and Business-to-Business (B2B). The business-to-consumer segment […]