

The Power of 3-7-11 and the Grand Super Cycle: How We Saw the Bullish Turn in April 2025 Back on April 9, 2025, while World Indices were dropping sharply and global sentiment had turned overwhelmingly bearish, we published an article that challenged the fear-driven narrative. We explained why selling was not the right approach and […]
-
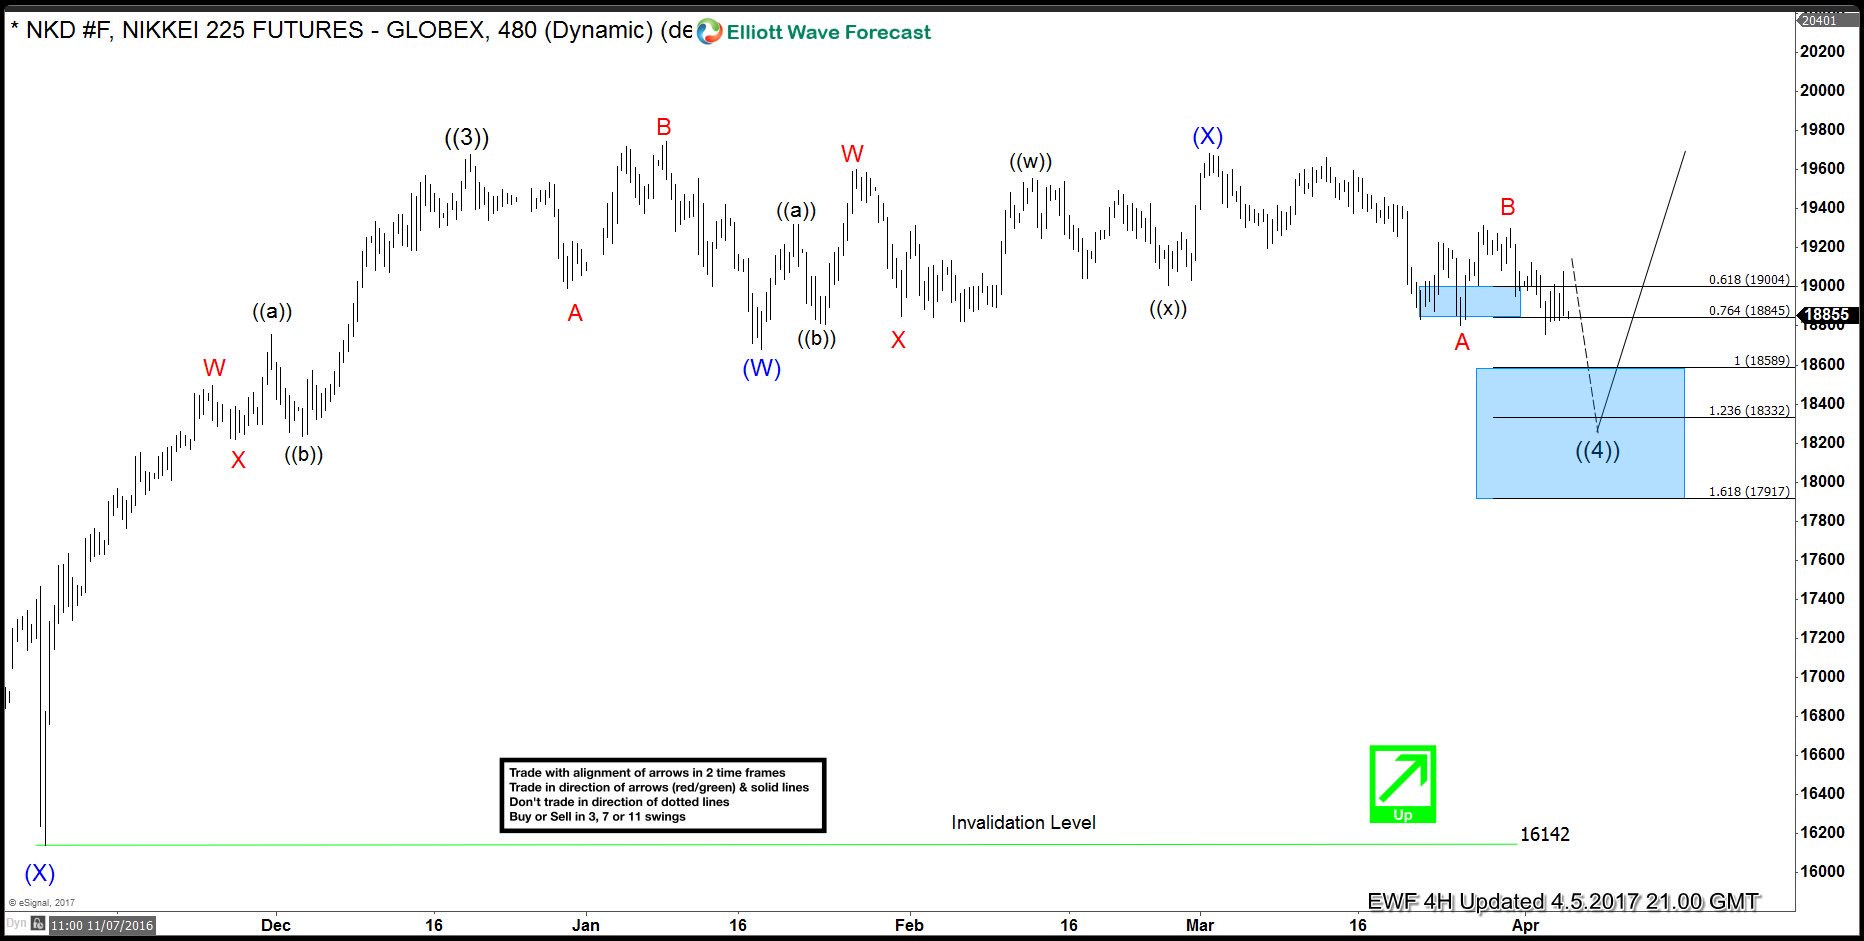
Nikkei (NKD #F) Forecasting the rally & buying the dips
Read MoreHello fellow traders. In this technical blog we’re going to take a quick look at the past Elliott Wave chart of Nikkei (NKD #F) published in members area of www.elliottwave-forecast.com. In further text we’re going to explain our view and the Elliott Wave count. Nikkei (NKD #F) Elliott Wave 4 Hour Chart 04.05.2017 As our members […]
-
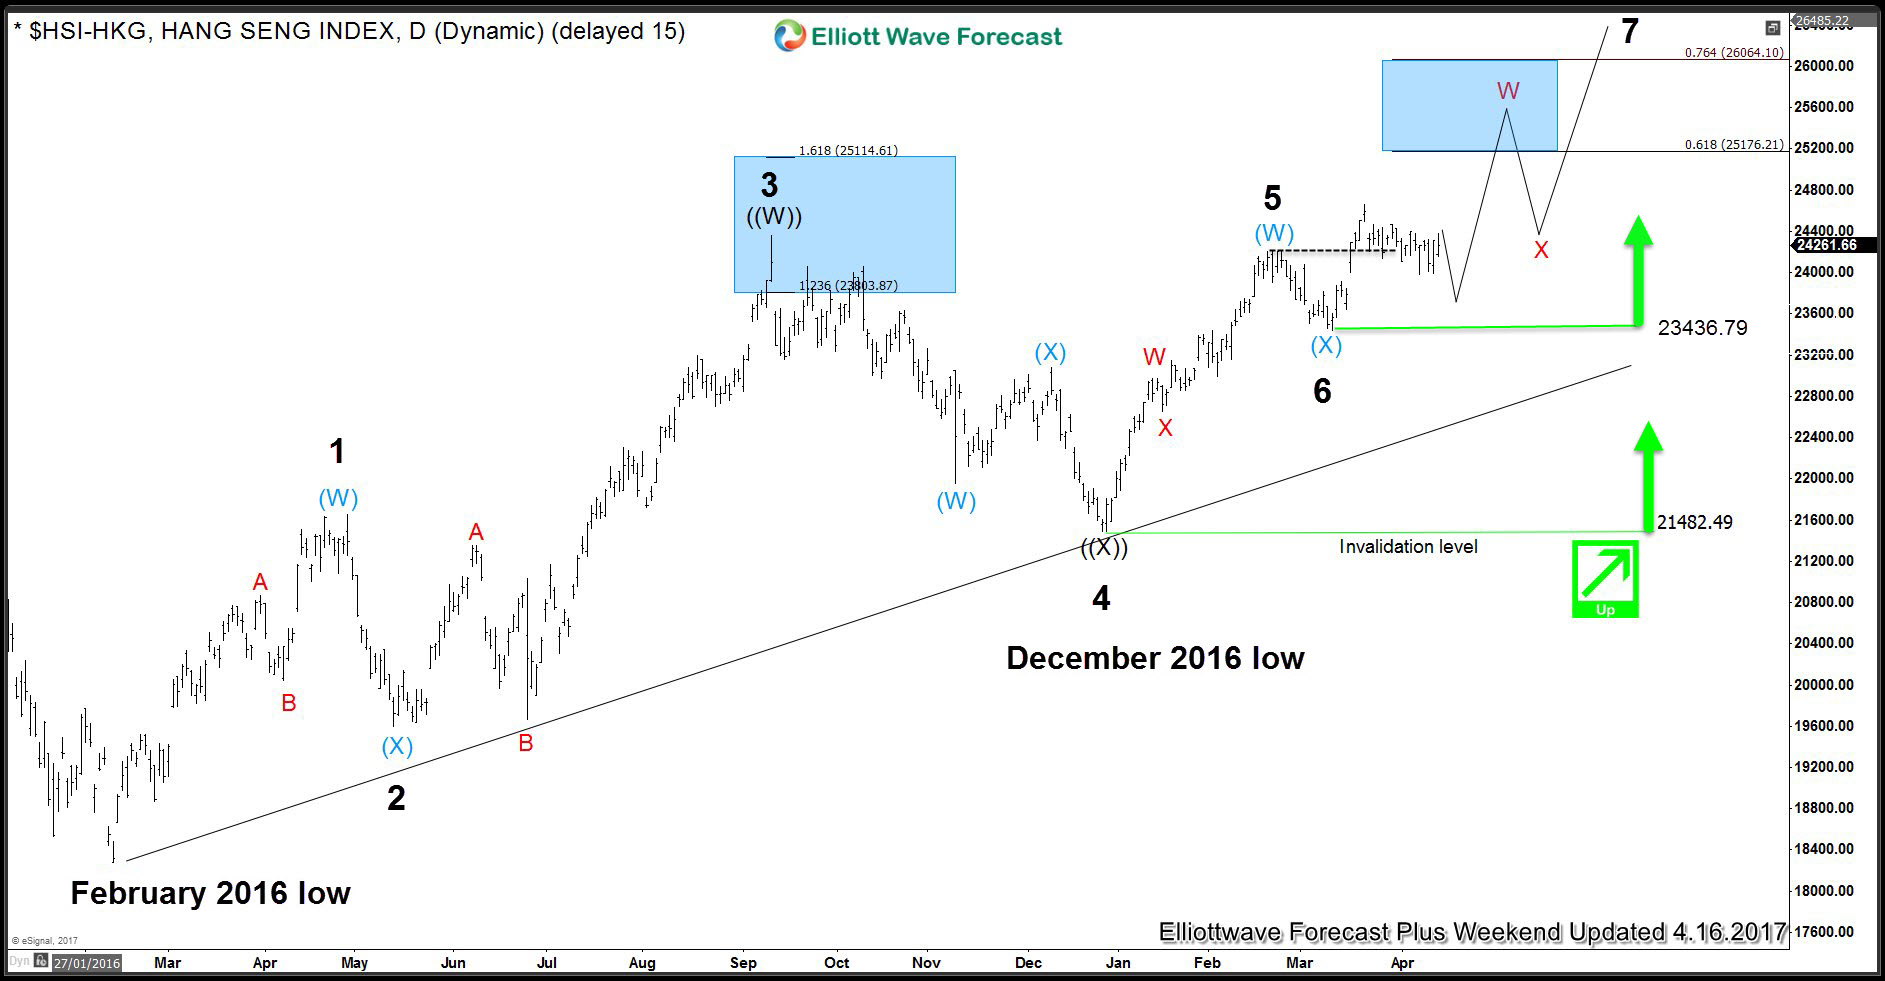
Hang Seng: Incomplete Elliott Wave Sequence
Read MoreHello fellow traders. In this technical blog we’re going to present the past Elliott Wave charts of Hang Seng ( $HSI-HKG ) published in members area of www.elliottwave-forecast.com . As our members know, we were pointing out that Hang Seng is having incomplete bullish swings sequences in the cycles from the February 12th and December […]
-
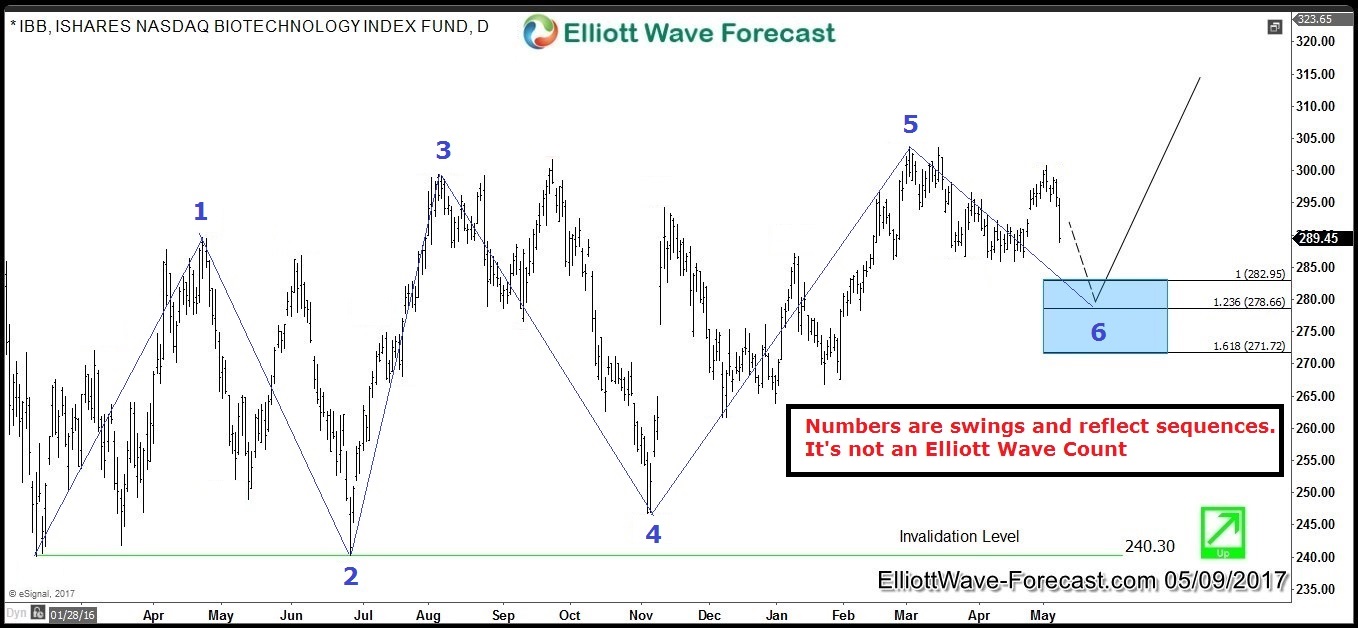
IBB Forecasting the Rally & Buying the Dips
Read MoreIBB ( iShares NASDAQ Biotechnology Index ETF ) tracks the performance of a market-cap-weighted index of biotechnology and pharmaceutical companies listed on the NASDAQ. In this Technical Blog we’re going to take a quick look at the past Elliott Wave charts of IBB and we’re going to take a look at the price structures , count the swings […]
-
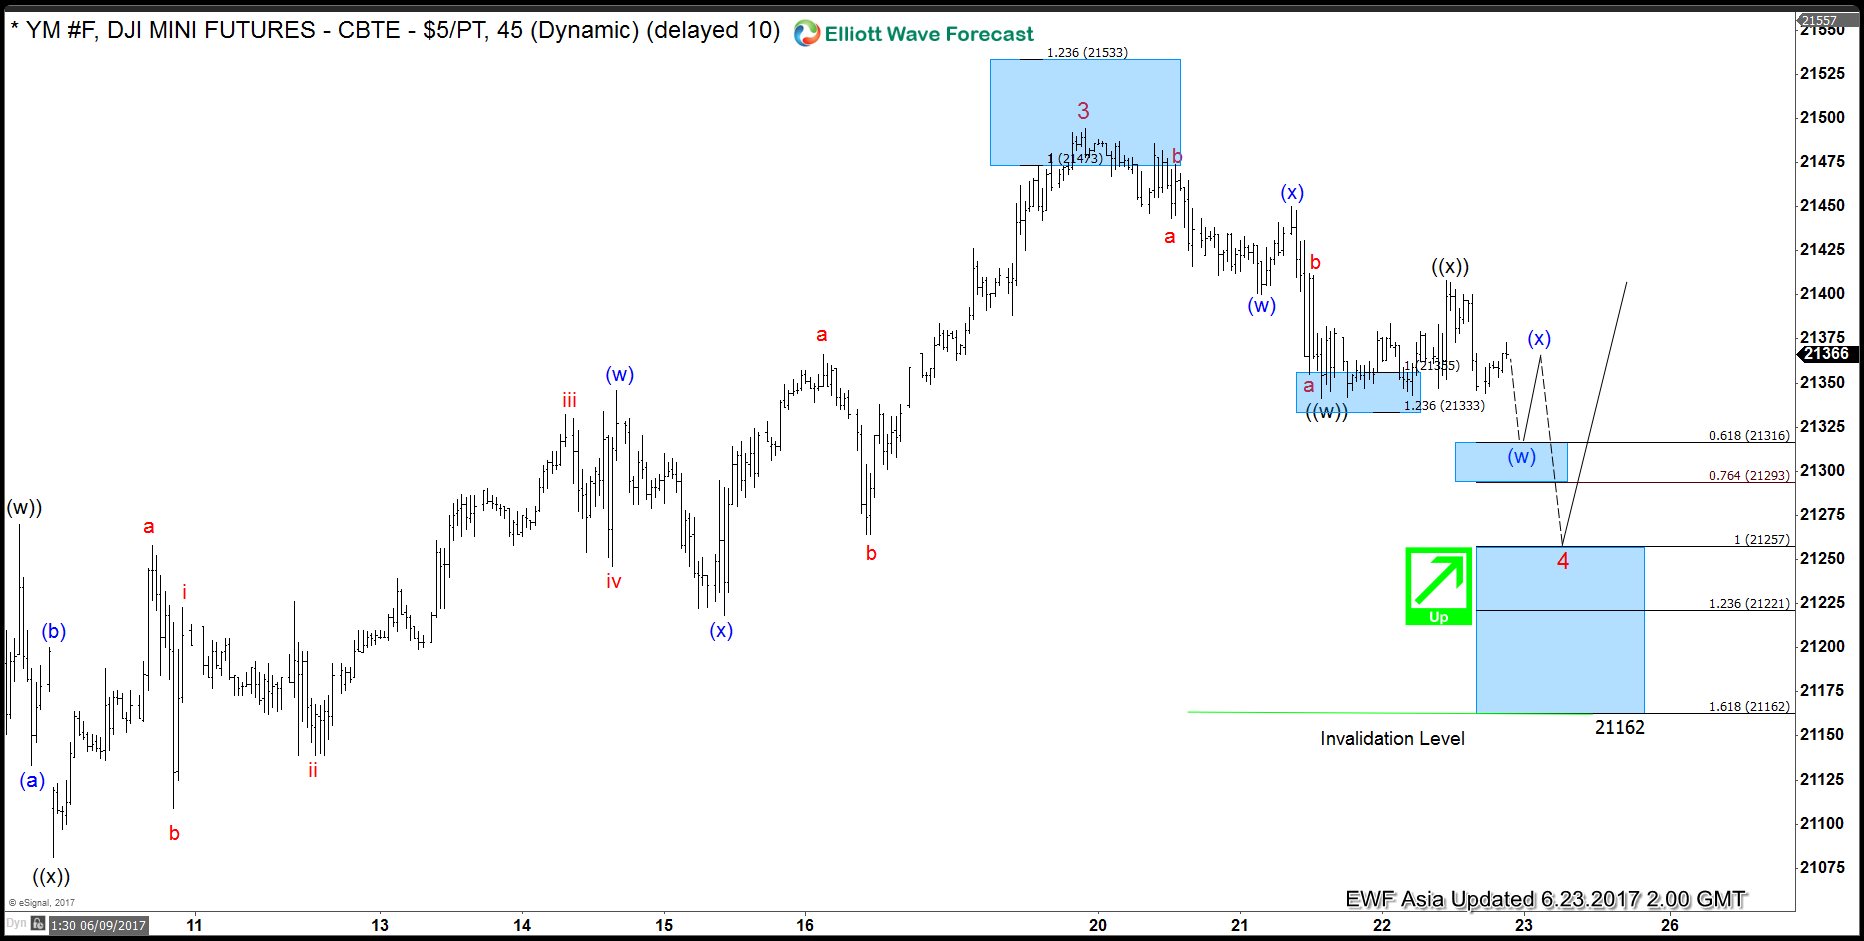
DJI Futures Elliott Wave Analysis: Pull back in progress
Read MoreShort term YM (DJI Futures) Elliott Wave view suggests the rally from 4/19 low is unfolding as a diagonal Elliott Wave structure where Minor wave 1 ended at 21010 (4/26), Minor wave 2 ended at 20474 (5/18), Minor wave 3 ended at 21494 (6/19). Minor wave 4 is in progress and subdivided into a double three Elliott Wave structure. Down from […]
-
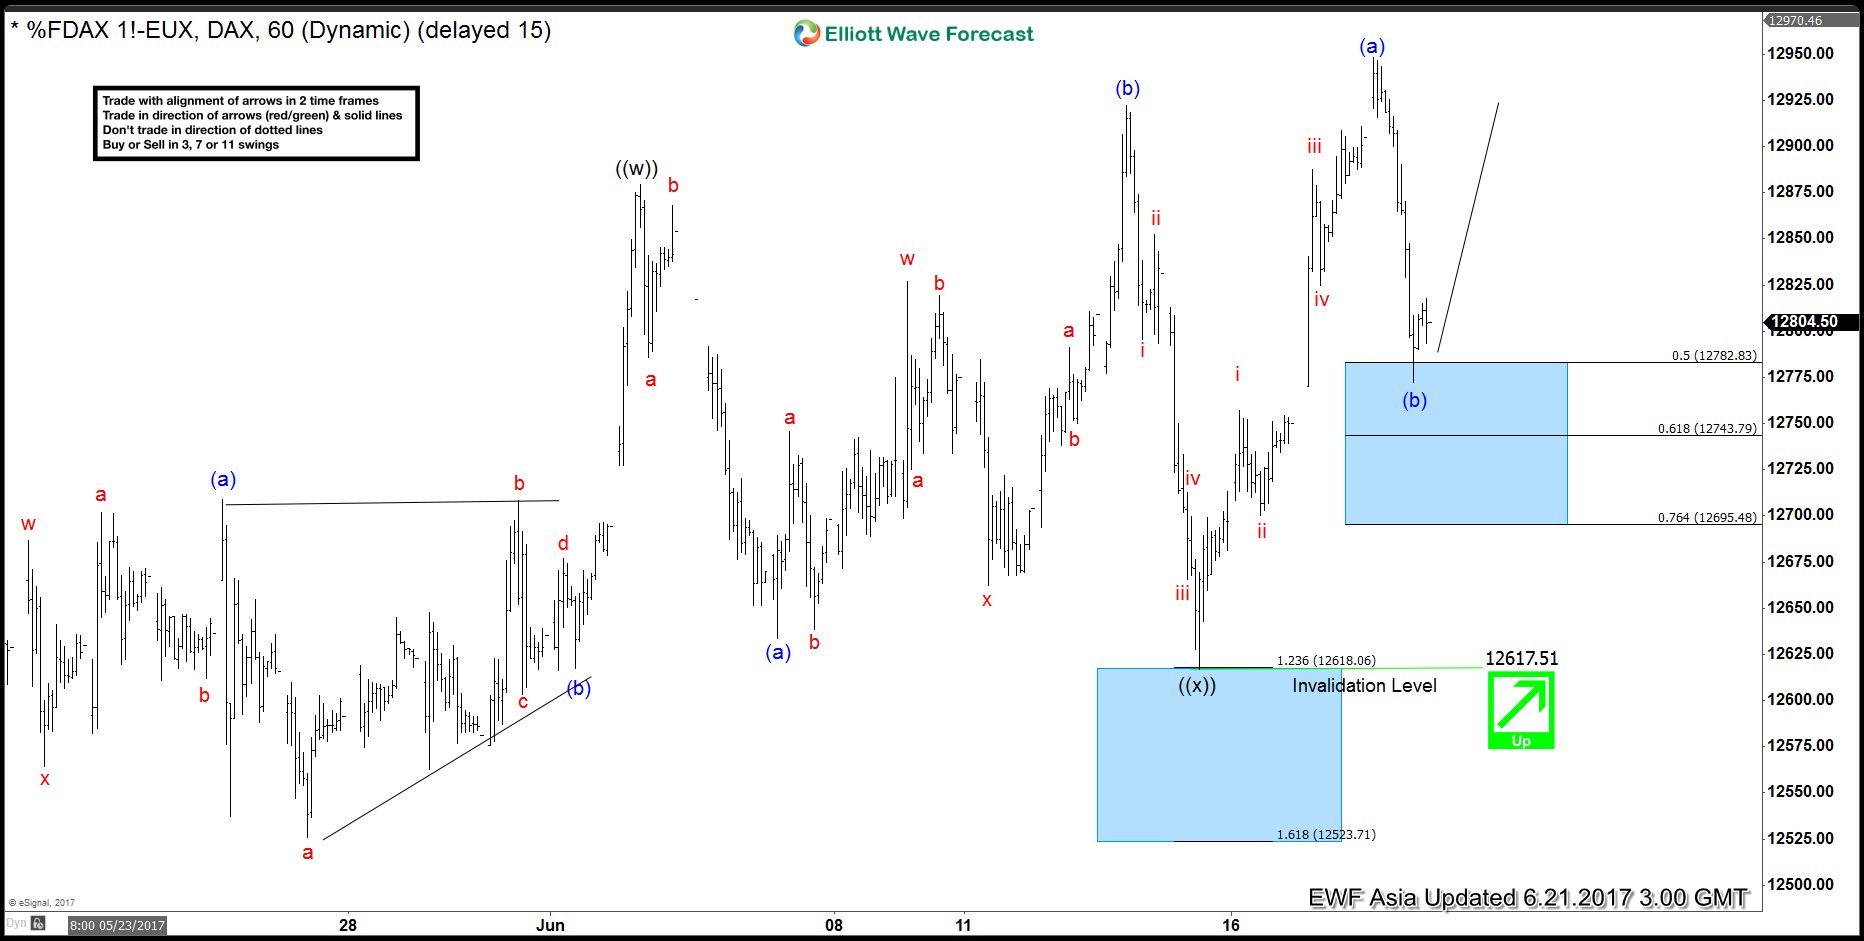
DAX Elliott Wave Analysis: Bullish Against 12617
Read MoreShort term DAX Elliott Wave view suggests the rally from 5/18 is unfolding as a double three Elliott Wave structure. Minute wave ((w)) ended at 12879.5 and Minute wave ((x)) pullback ended at 12617. Internal of Minute wave ((x)) subdivided as an expanded flat Elliott Wave structure where Minutte wave (a) ended at 12633.5, Minutte wave (b) ended […]
-
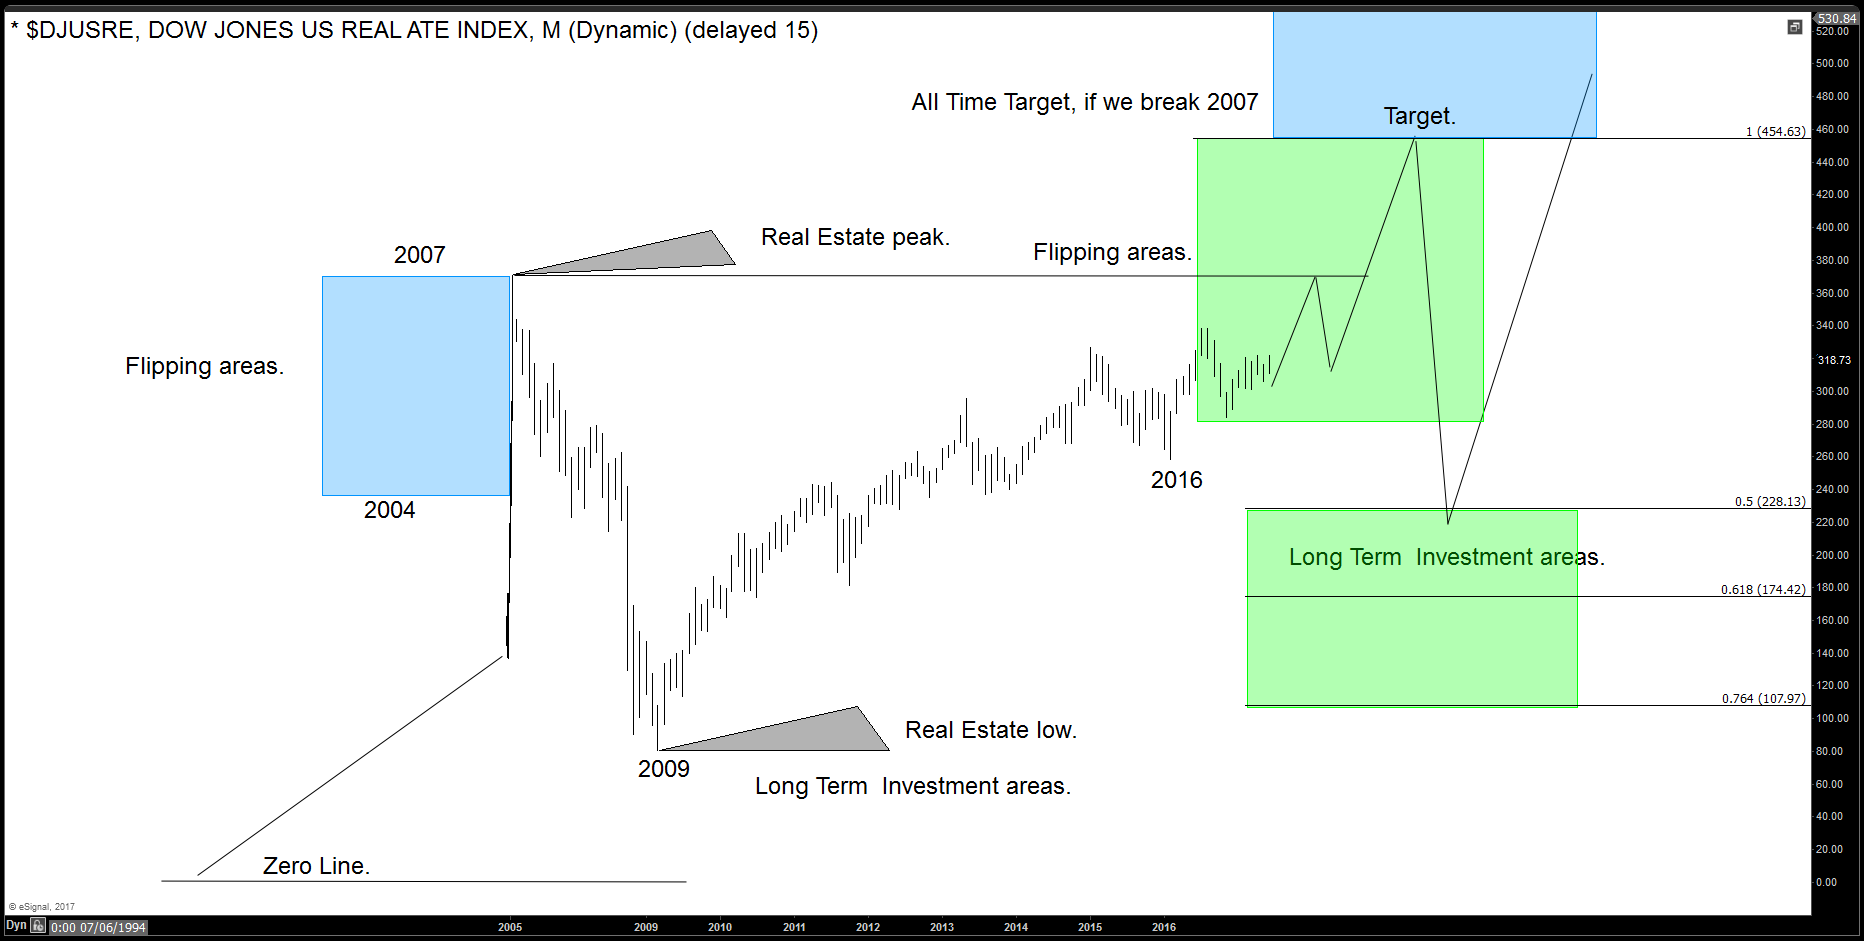
Real Estate (DJUSRE): Buy now or Wait?
Read MoreWe at Elliottwave–forecast.com track a lot of Indices around the World. One of the Indices we track is DJUSRE (Dow Jones US Real Estate Index) which provides a guideline for housing properties in the U.S. Buying real estate is always a good way to invest and make money. For years, investors use the real estate […]