

The Power of 3-7-11 and the Grand Super Cycle: How We Saw the Bullish Turn in April 2025 Back on April 9, 2025, while World Indices were dropping sharply and global sentiment had turned overwhelmingly bearish, we published an article that challenged the fear-driven narrative. We explained why selling was not the right approach and […]
-
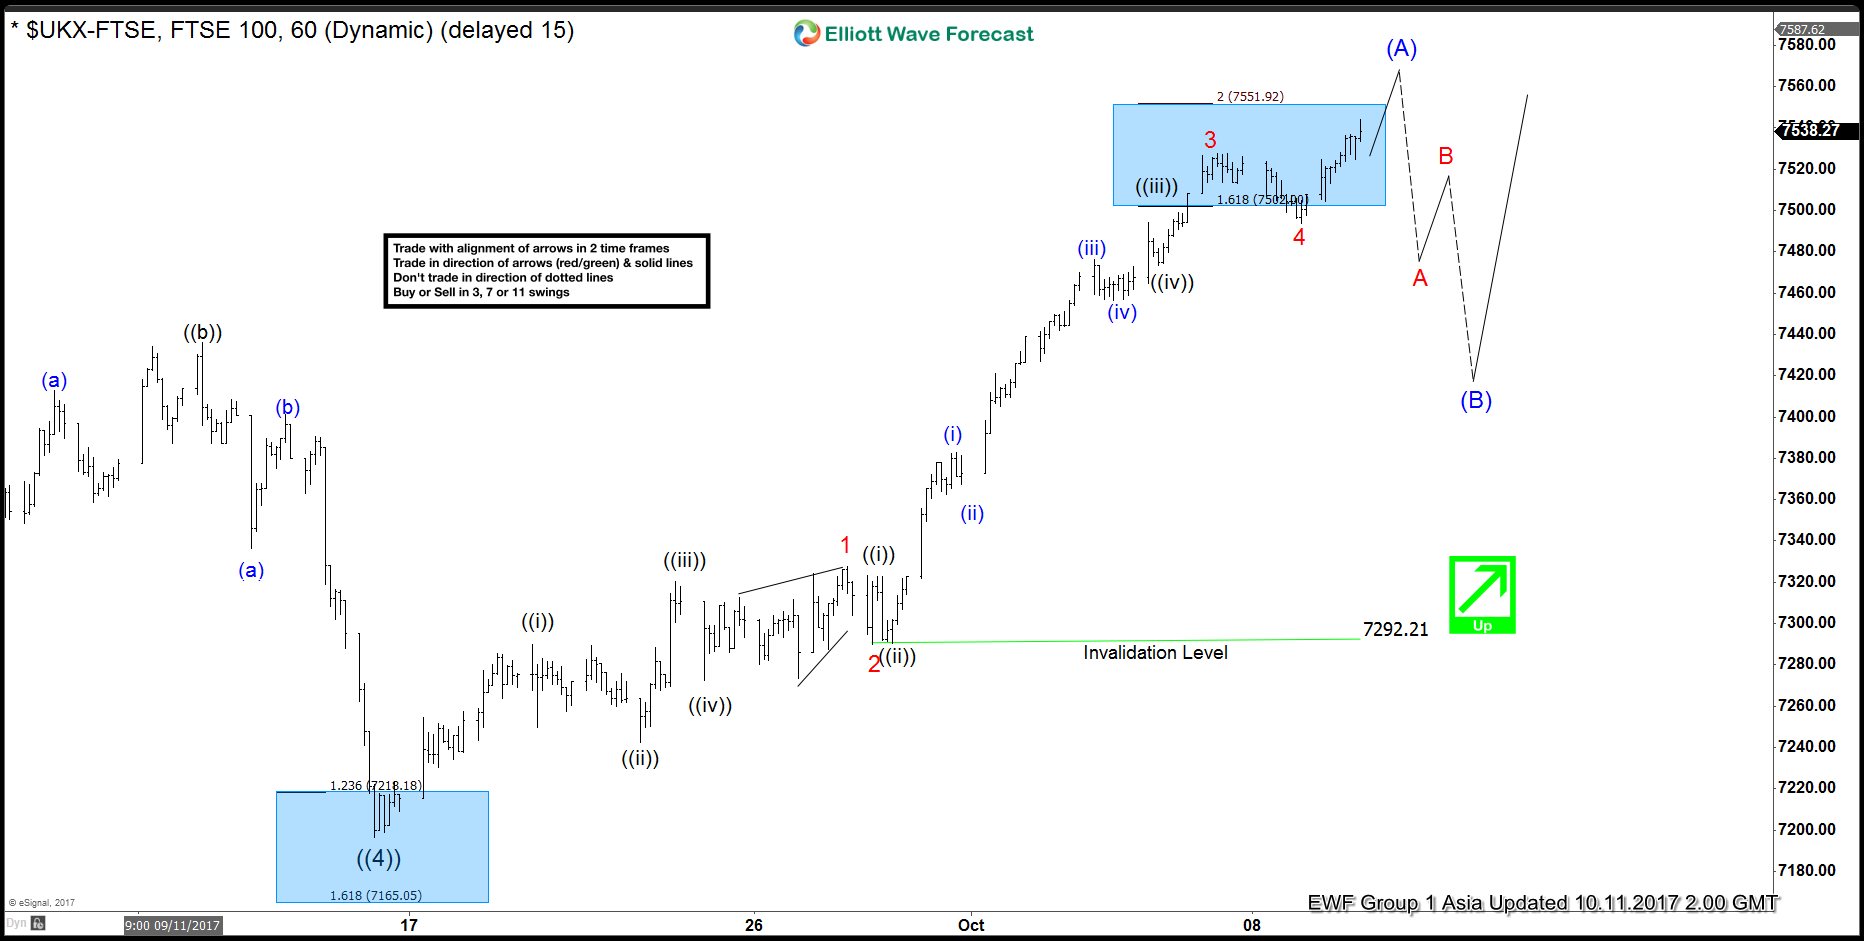
FTSE Elliott Wave Analysis 10.11.2017
Read MoreFTSE Short term Elliott Wave analysis suggests the decline to 7196.58 on 9/15 low ended Primary wave ((4)). The Index is currently within Primary wave ((5)) which is subdivided as a zigzag Elliott Wave structure. The first leg Intermediate wave (A) of this zigzag is in progress as 5 waves impulse where Minor wave 1 ended at 7327.50 […]
-
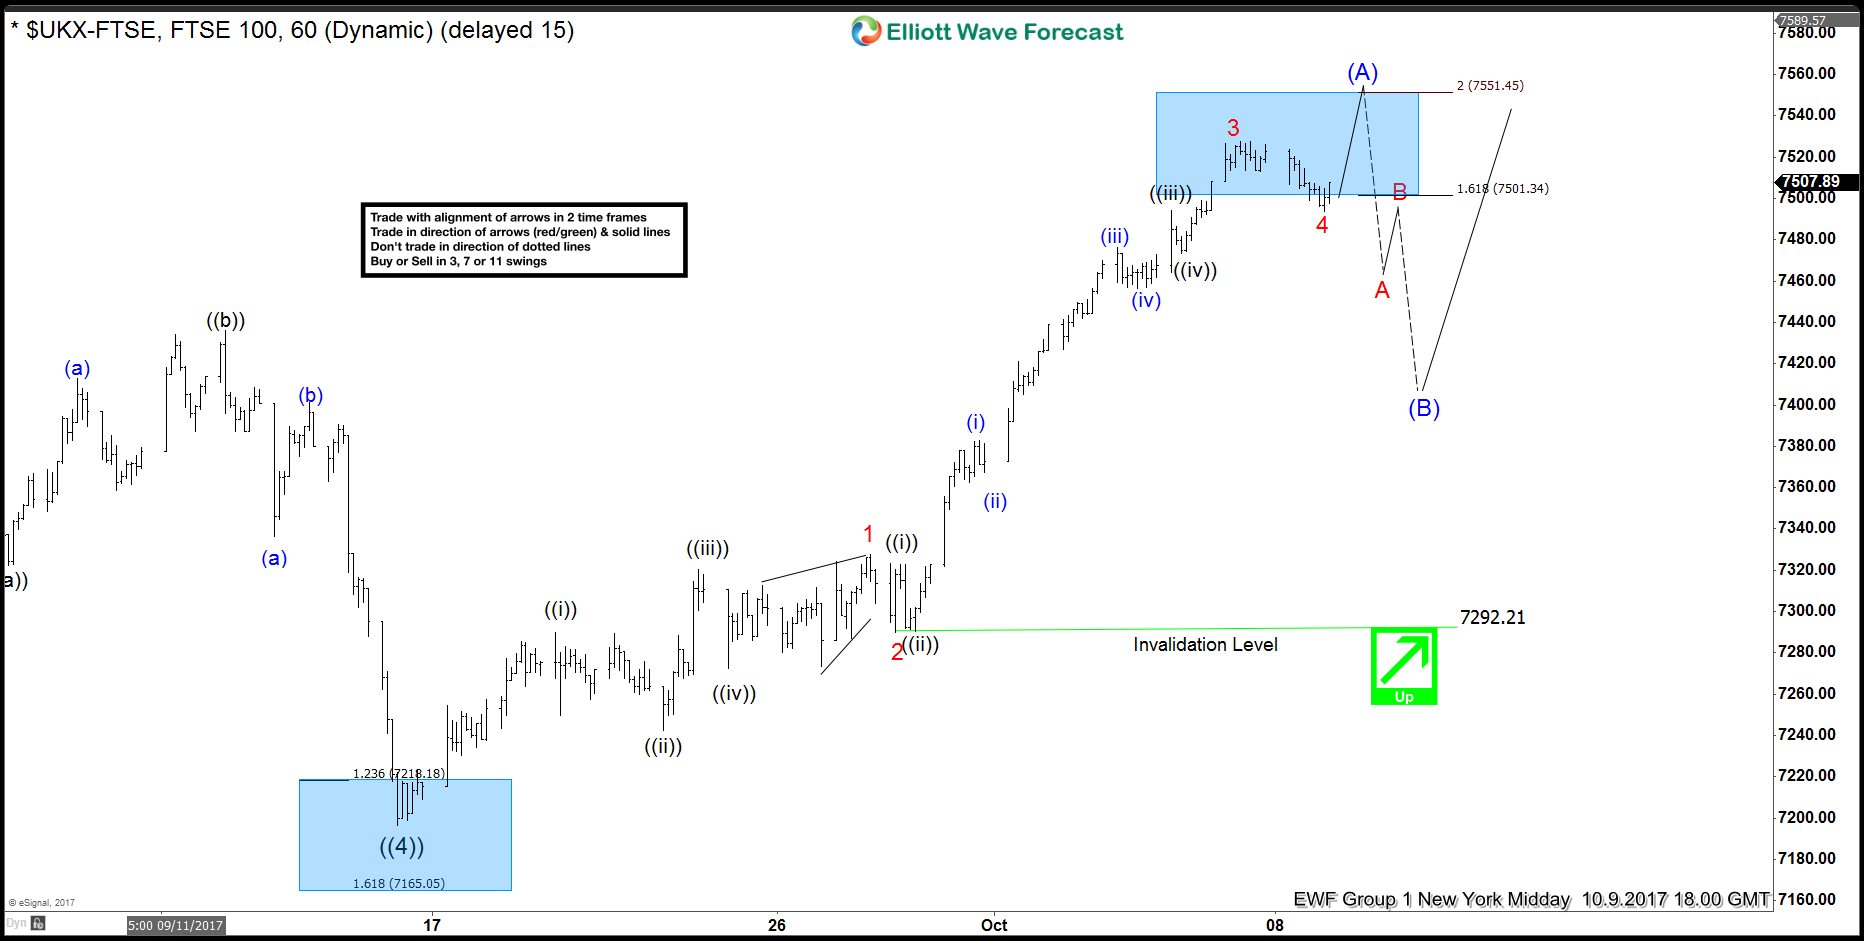
$FTSE 100 impulsive bounce from 9/15 lows
Read MoreThe $FTSE 100 index appears to be showing an impulsive bounce from the 9/15/17 lows. This is part of a larger leading diagonal up from the 2/11/16 lows. In an impulse that is bullish, market prices will go up in an impulsive manner on all time frames of trend. Impulses are always subdivided into smaller degree impulse […]
-
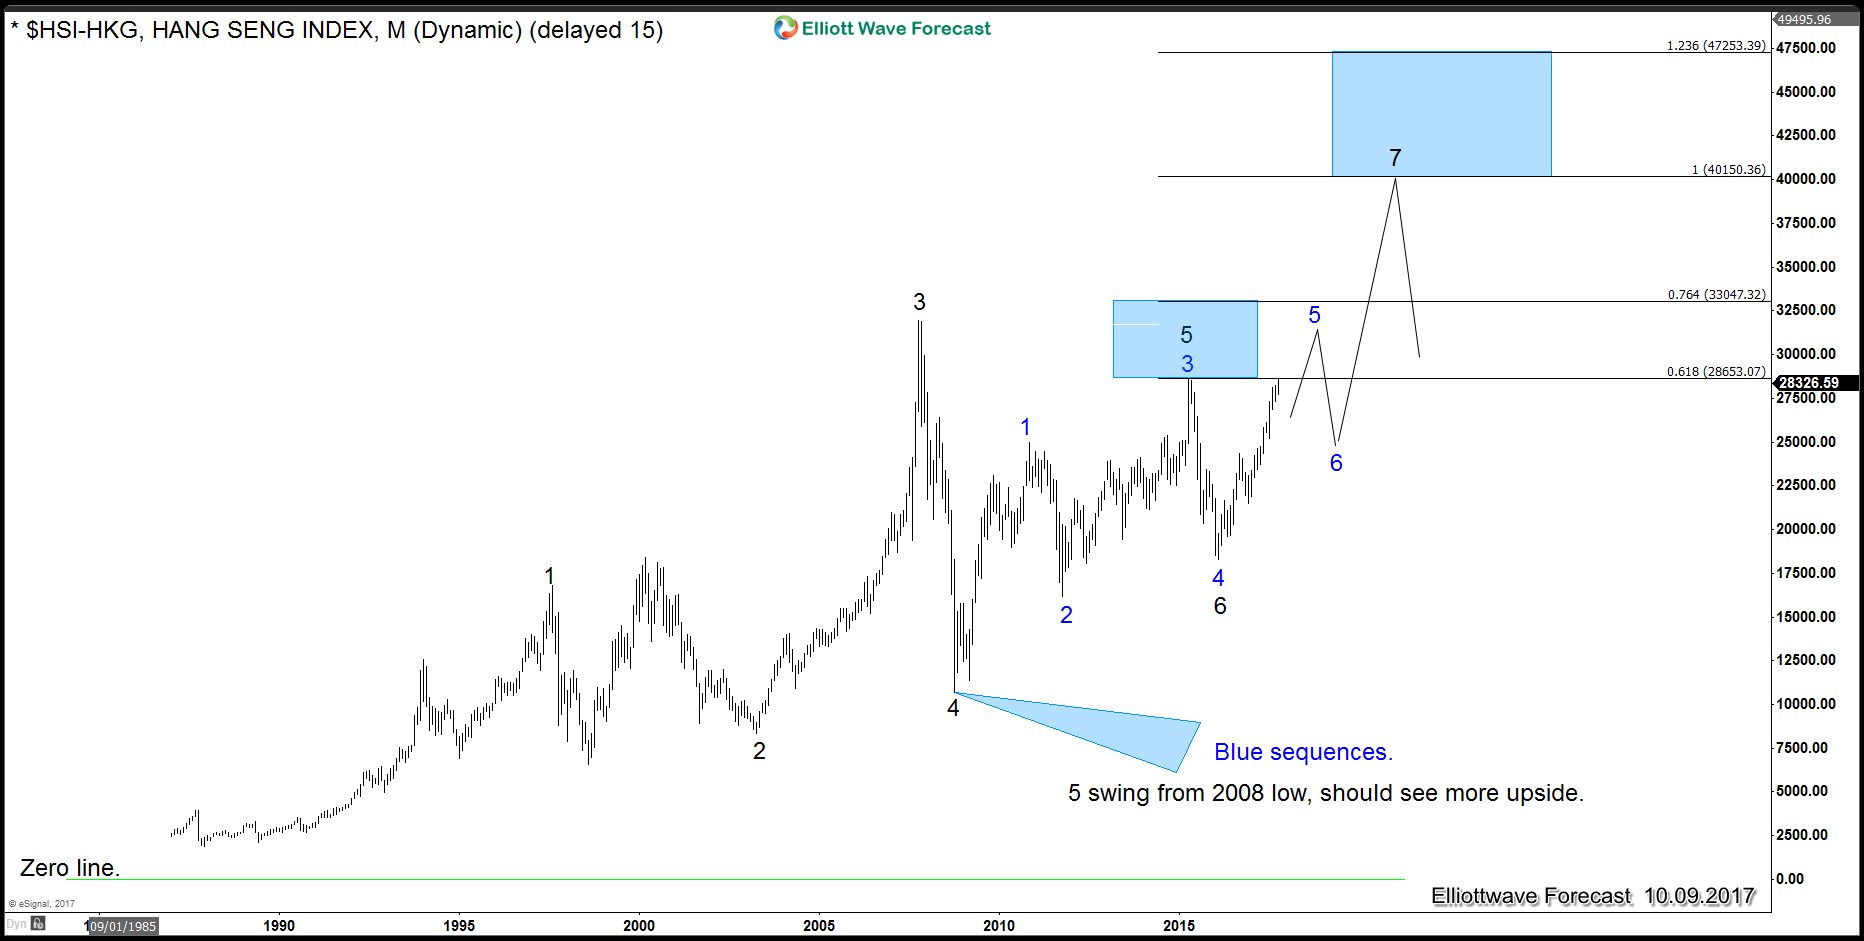
World Stock Index has much more upside
Read MoreThe Hang Seng Stock Index is a free float, adjusted market capitalization, weighted stock Market Index in Hong Kong. The Index records and monitors daily changes of the largest companies of the Hong Kong Stock Market. It is the main indicator of the overall market performance in Hong Kong. These 50 constituent companies represent about 58% of […]
-
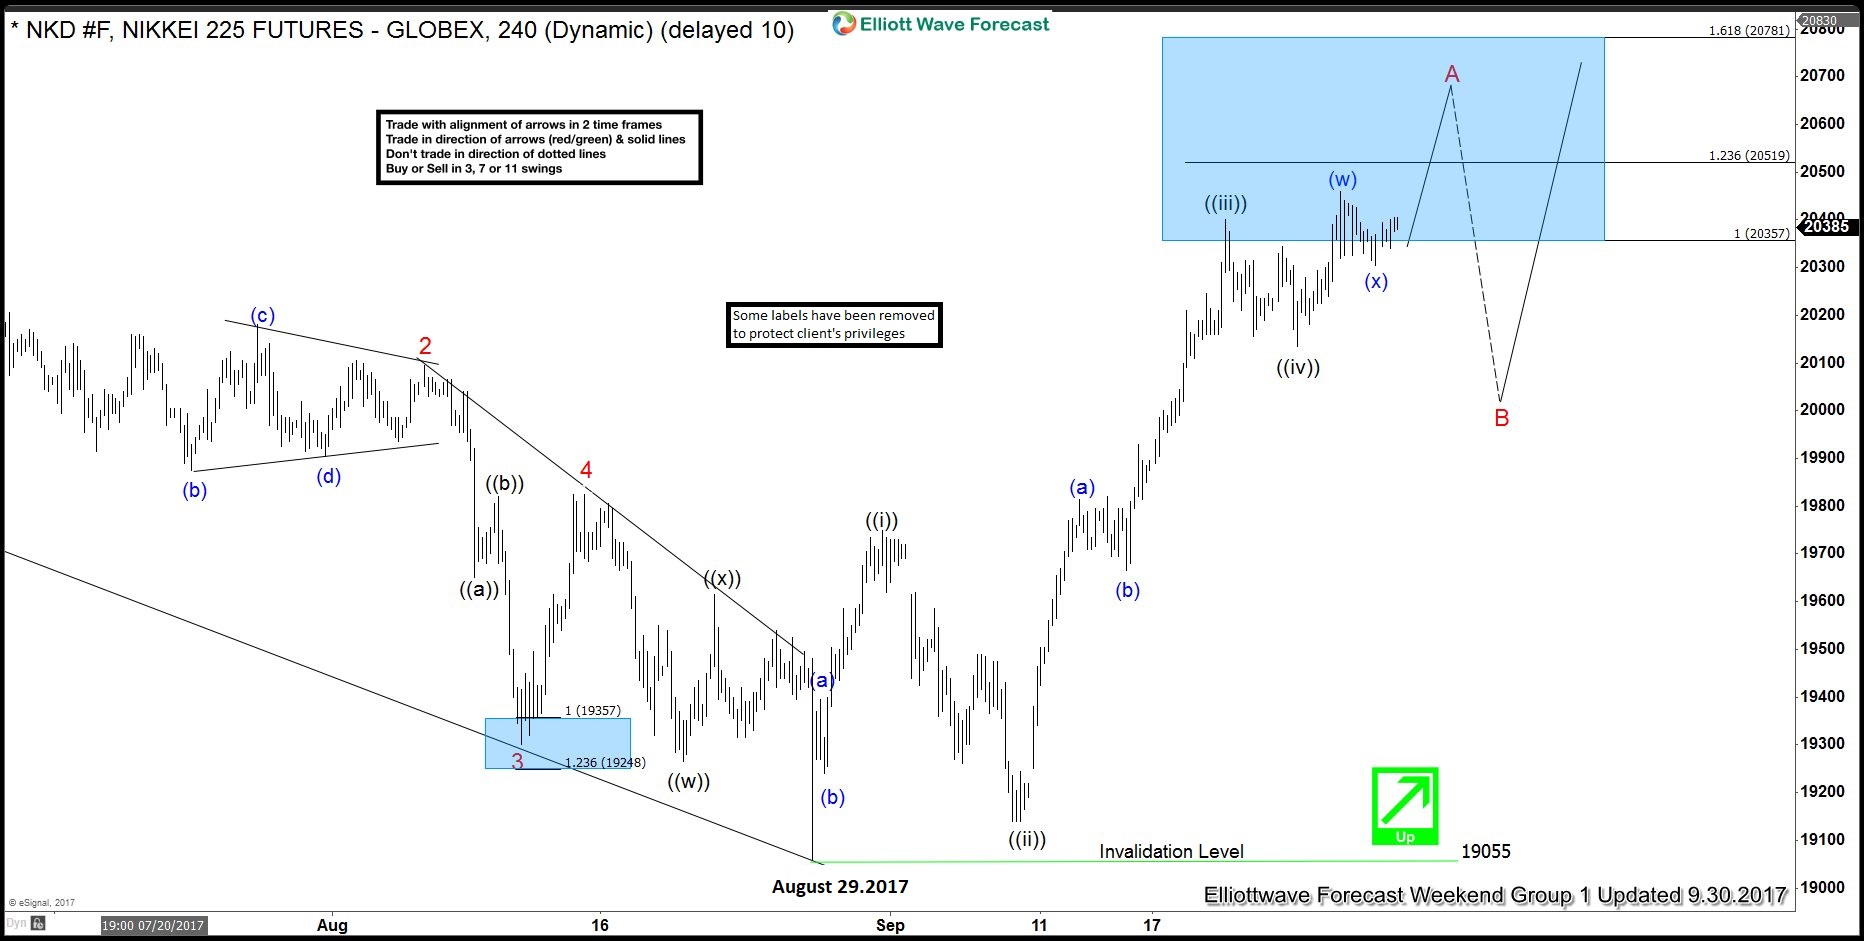
Nikkei ( NKD_F) Elliott Wave View: Diagonal Structure
Read MoreShort term Elliott wave view in Nikkei suggest that the cycle from August 29.2017 low (19055) is unfolding in 5 waves pattern. However looking at the internal subdivision of each wave the bounce looks corrective in nature with upside extensions. Thus suggesting that the Nikkei cycle from August 29 low (19055) could be following a leading Diagonal […]
-
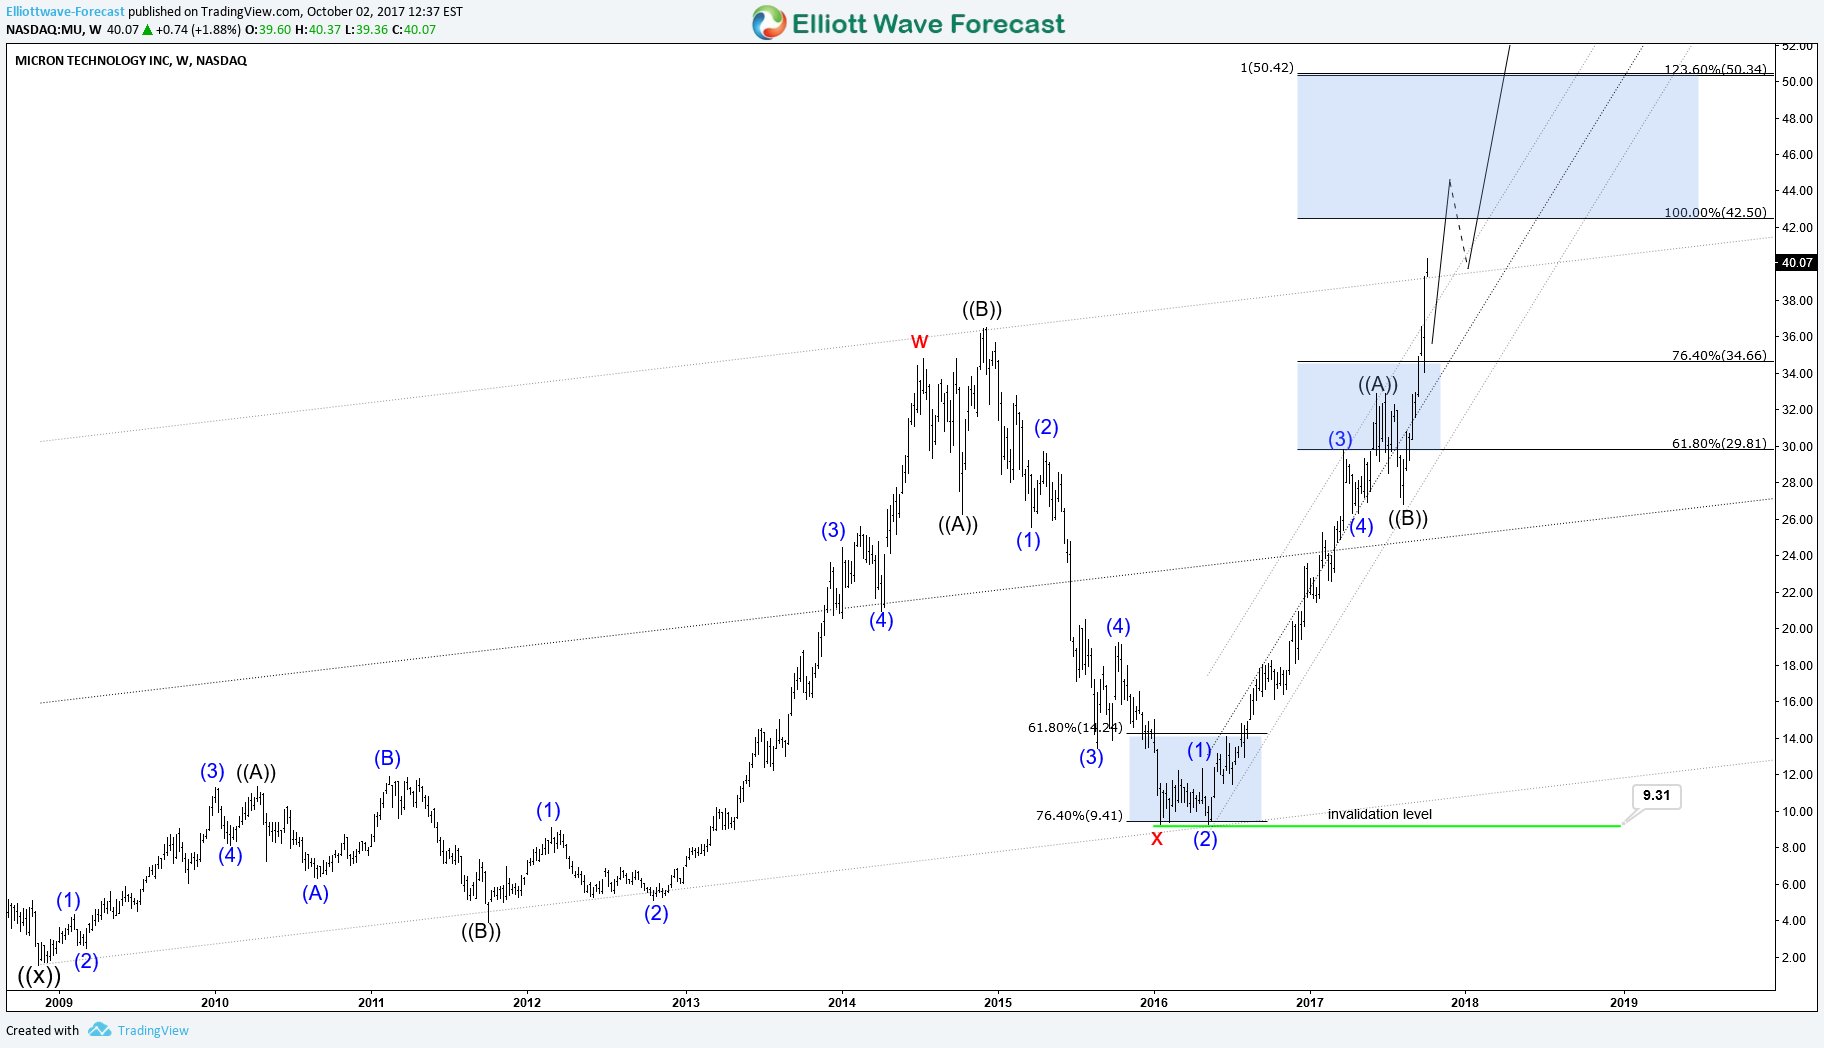
MU Micron Technology INC – Buy the Next Dip
Read MoreToday we are going to take a look at the weekly chart of the MU Micron Technology Inc. stock which shows a very interesting price structure. Before we proceed with the analysis, few words about the company. According to Wikipedia, Micron Technology Inc. is an American global corporation based in Boise, Idaho. Furthermore the company […]
-
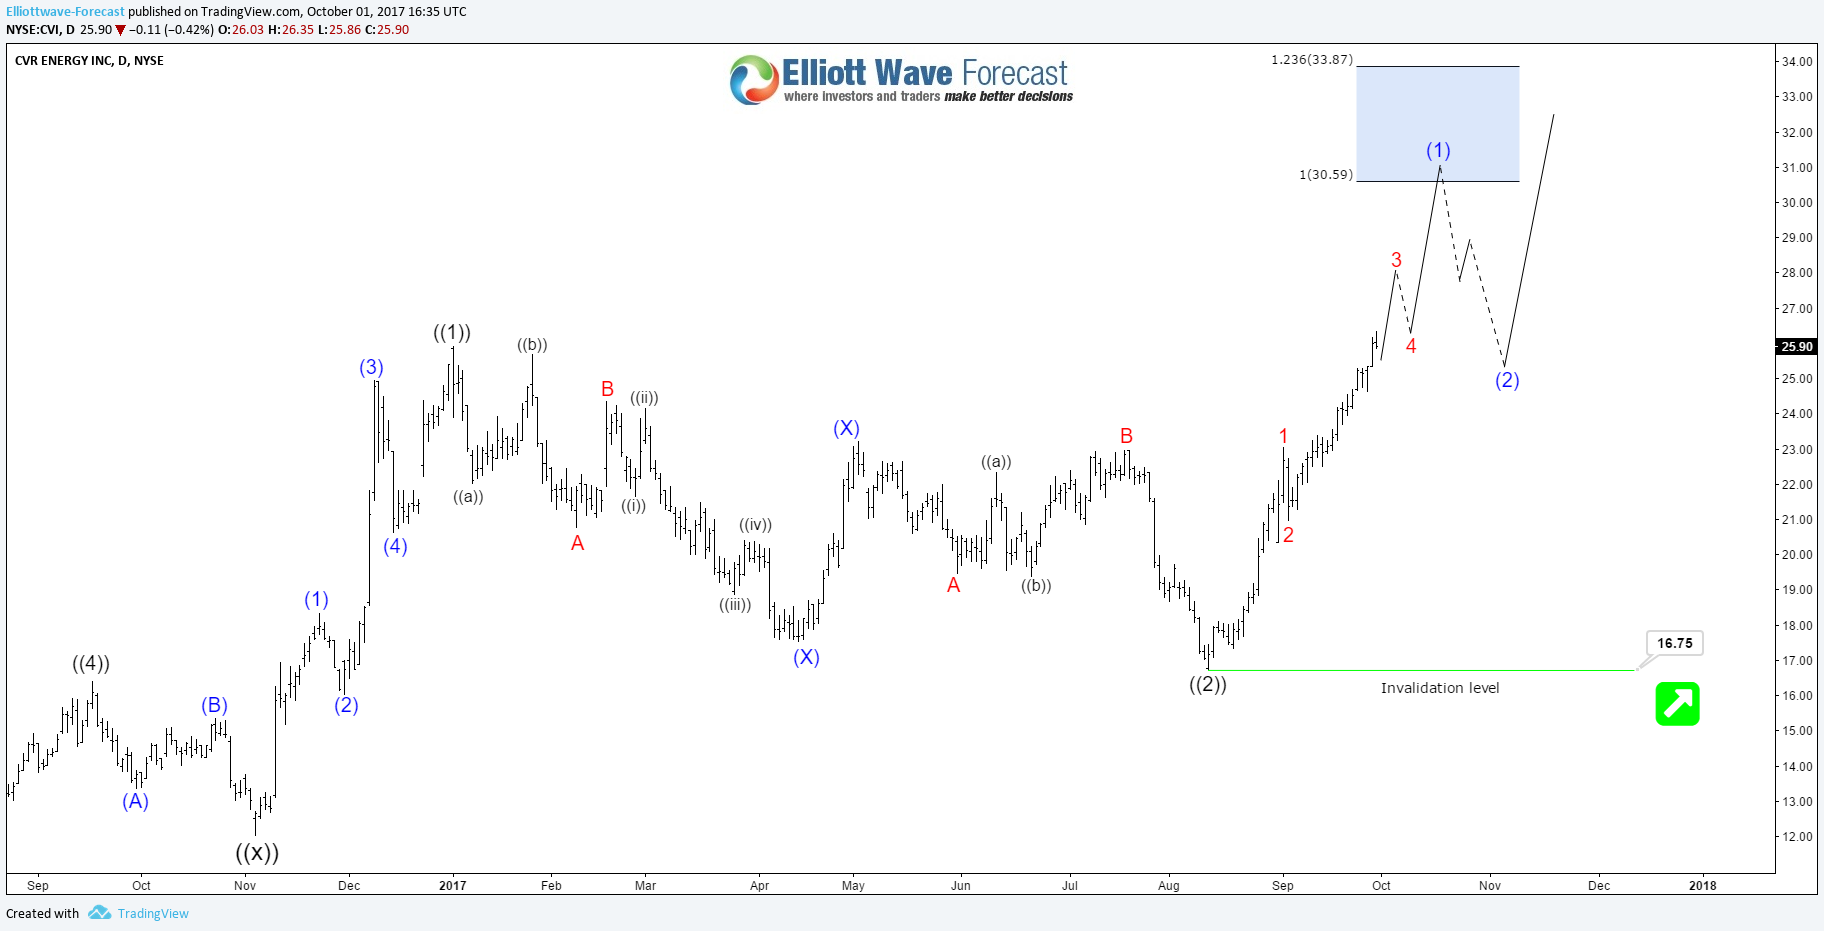
CVR Energy (CVI) Daily Bullish Sequence
Read MoreOn November 2016, CVR Energy (NYSE: CVI) made an important low to end a daily correction from 2013 peak, up from there the stock either started a new bullish cycle to take it toward new all time highs or it’s just doing a 3 waves bounce. We can notice that since last year low, CVI has outperformed the energy sector […]