

The Power of 3-7-11 and the Grand Super Cycle: How We Saw the Bullish Turn in April 2025 Back on April 9, 2025, while World Indices were dropping sharply and global sentiment had turned overwhelmingly bearish, we published an article that challenged the fear-driven narrative. We explained why selling was not the right approach and […]
-
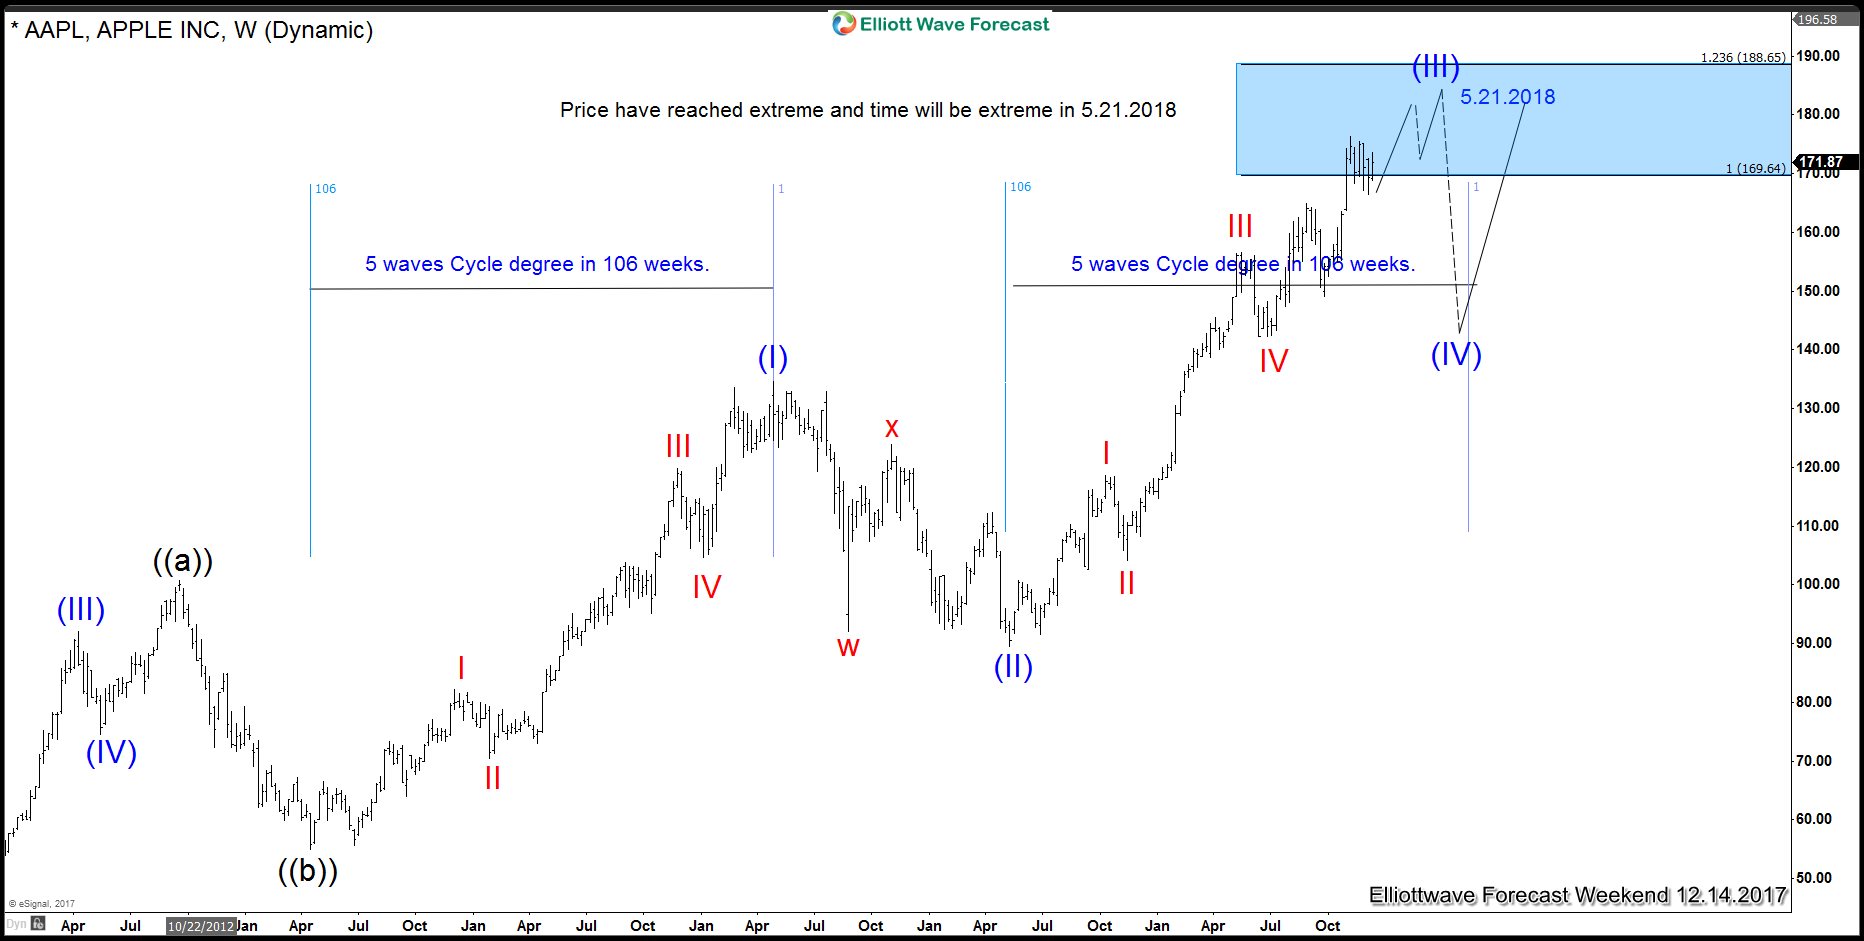
Sell In May And Go Away?
Read MoreMany Indices traders have heard about the phrase “Sell in May and go away”. We at Elliottwave-Forecast.com only trade based in the technicals do not use any Fundamental criteria or news events in our forecast. We trade based in Cycles, Sequences, Correlations and Elliott wave. We Identify extremes in Price and also time and provide members […]
-
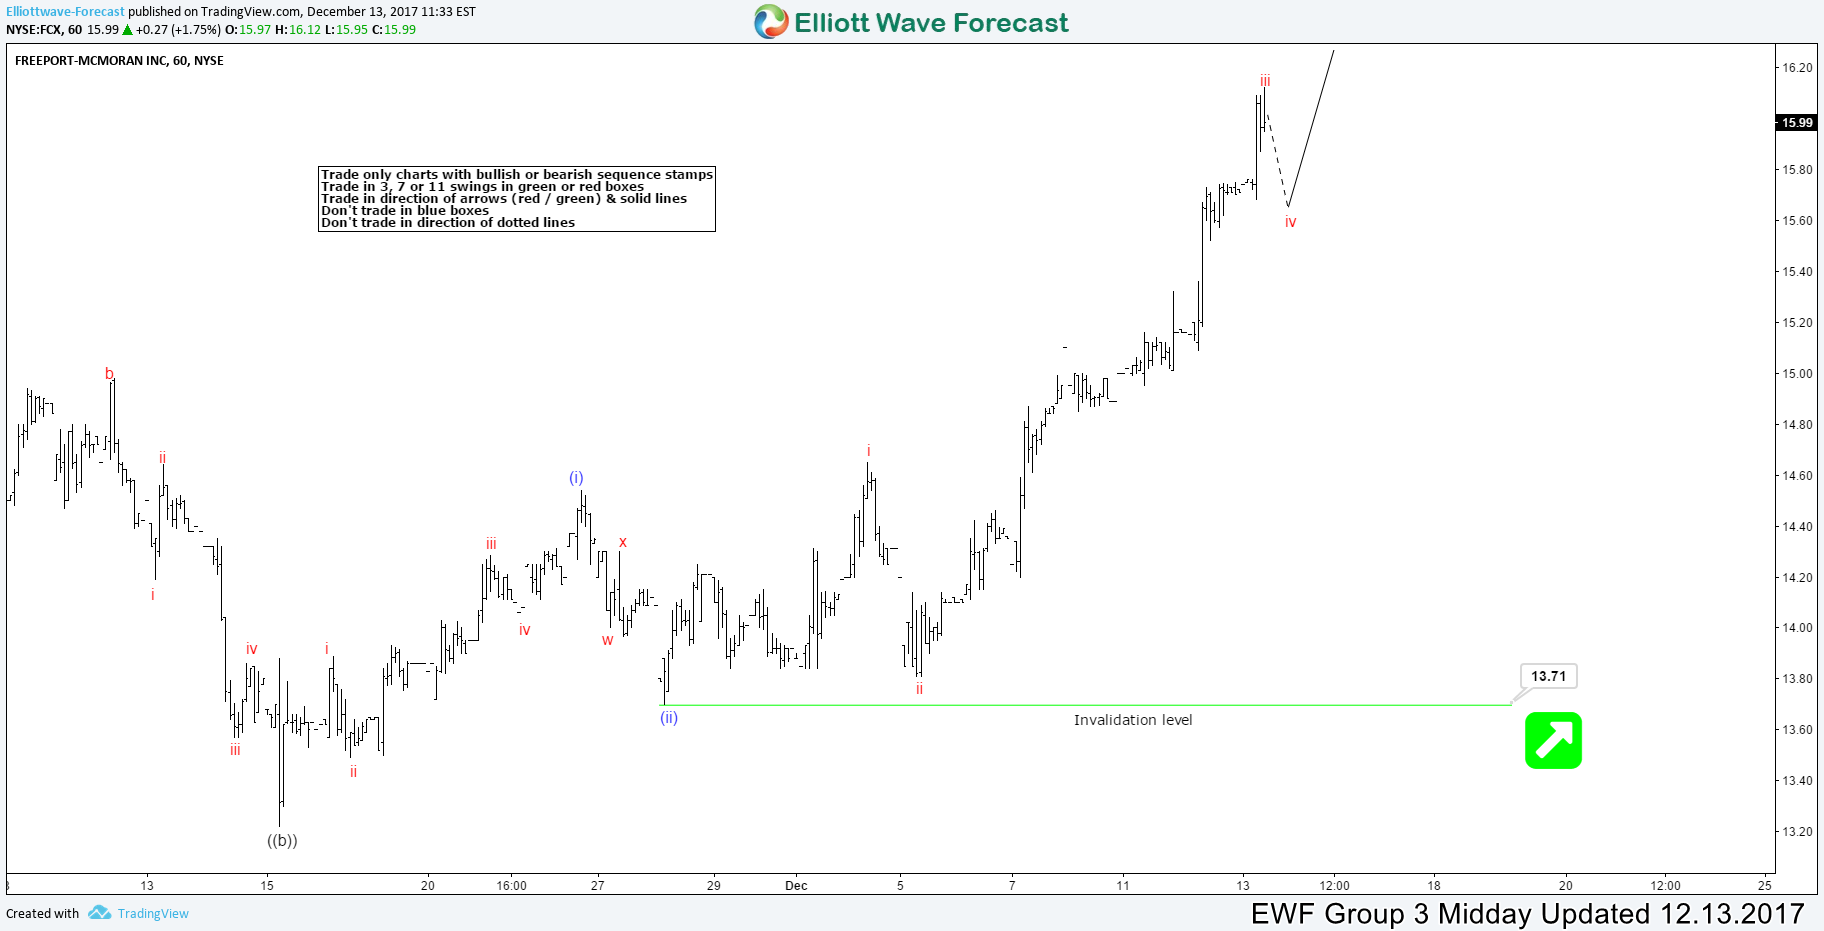
FCX Showing Elliott Wave Impulse Sequence
Read MoreFCX ( Freeport Macmoran INC) Short-term Elliott Wave view suggests that the decline to November 15 low 13.25 ended Minute wave ((b)). Above from there, the stock is showing a strong rally to the upside and structure looks to be unfolding as an impulse Elliott Wave structure due to the extension in 3rd leg higher. Also, each leg has internal oscillations of 5 […]
-
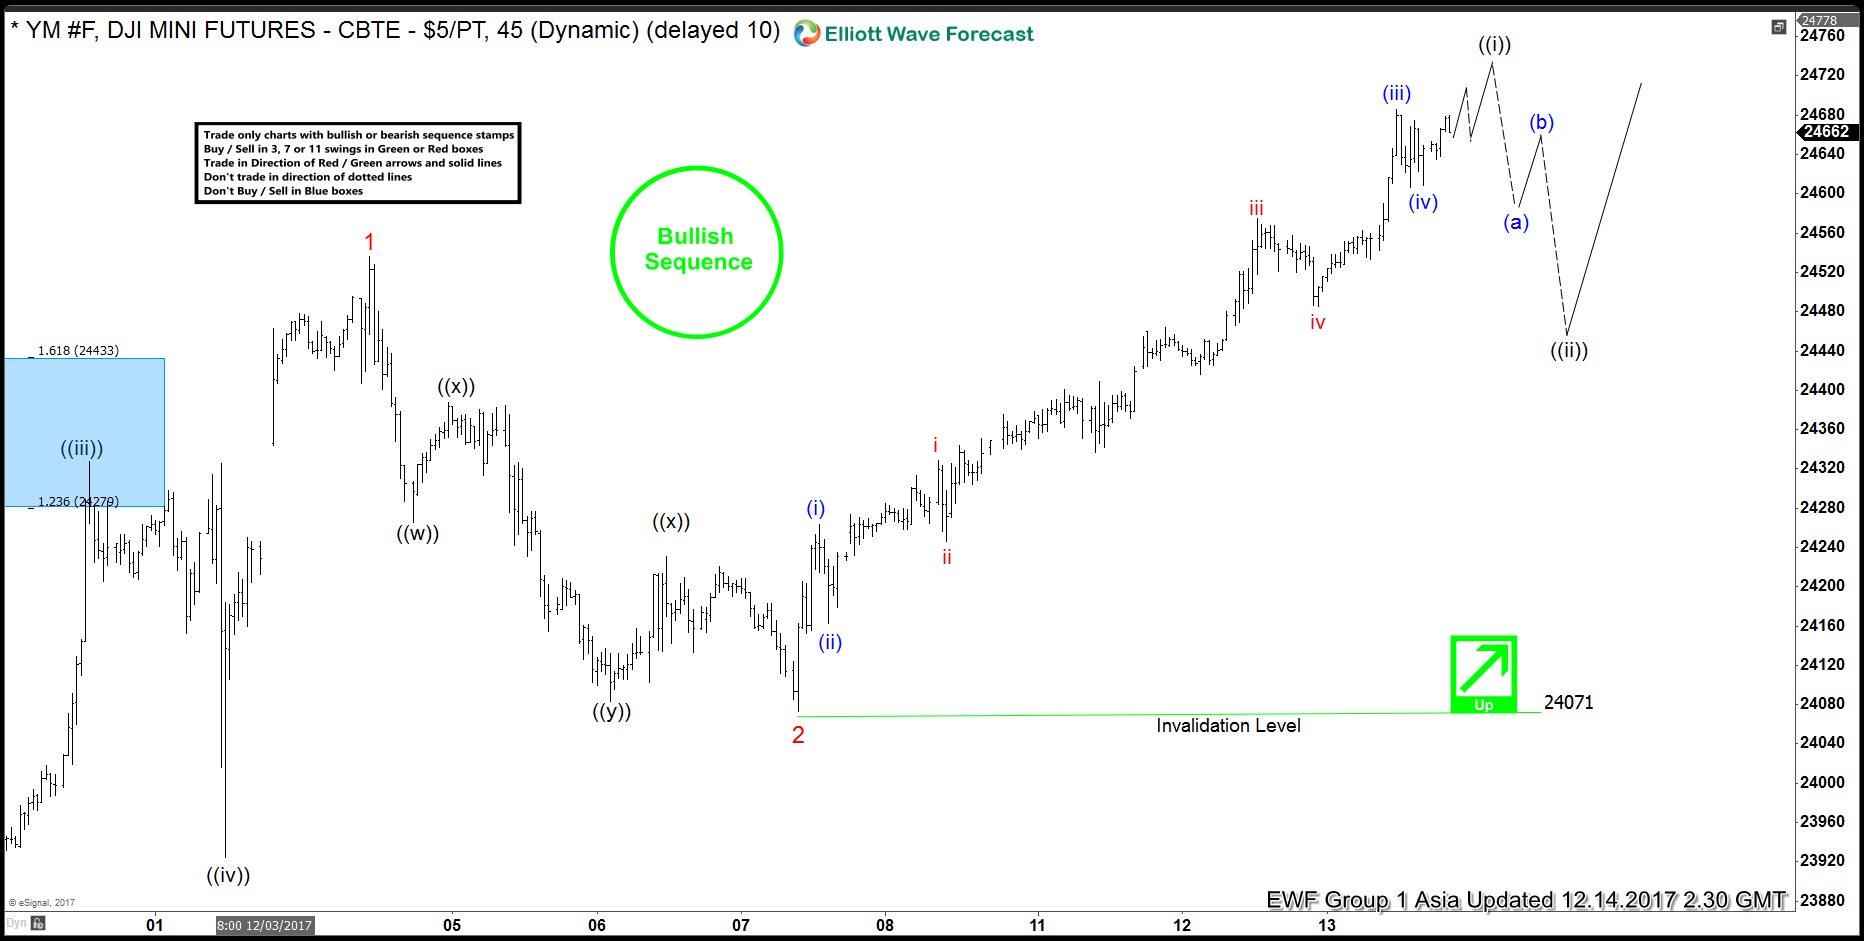
Dow Future Intra-Day Elliott Wave Analysis
Read MoreDow Future Short Term Elliott Wave view suggests that the decline to 23205 ended Intermediate wave (4). Intermediate wave (5) is in progress as an Ending Diagonal Elliott Wave structure where Minor wave 1 ended at 24536 and Minor wave 2 ended at 24073. The Index has broken above Minor wave 1 at 24536 which suggests the […]
-
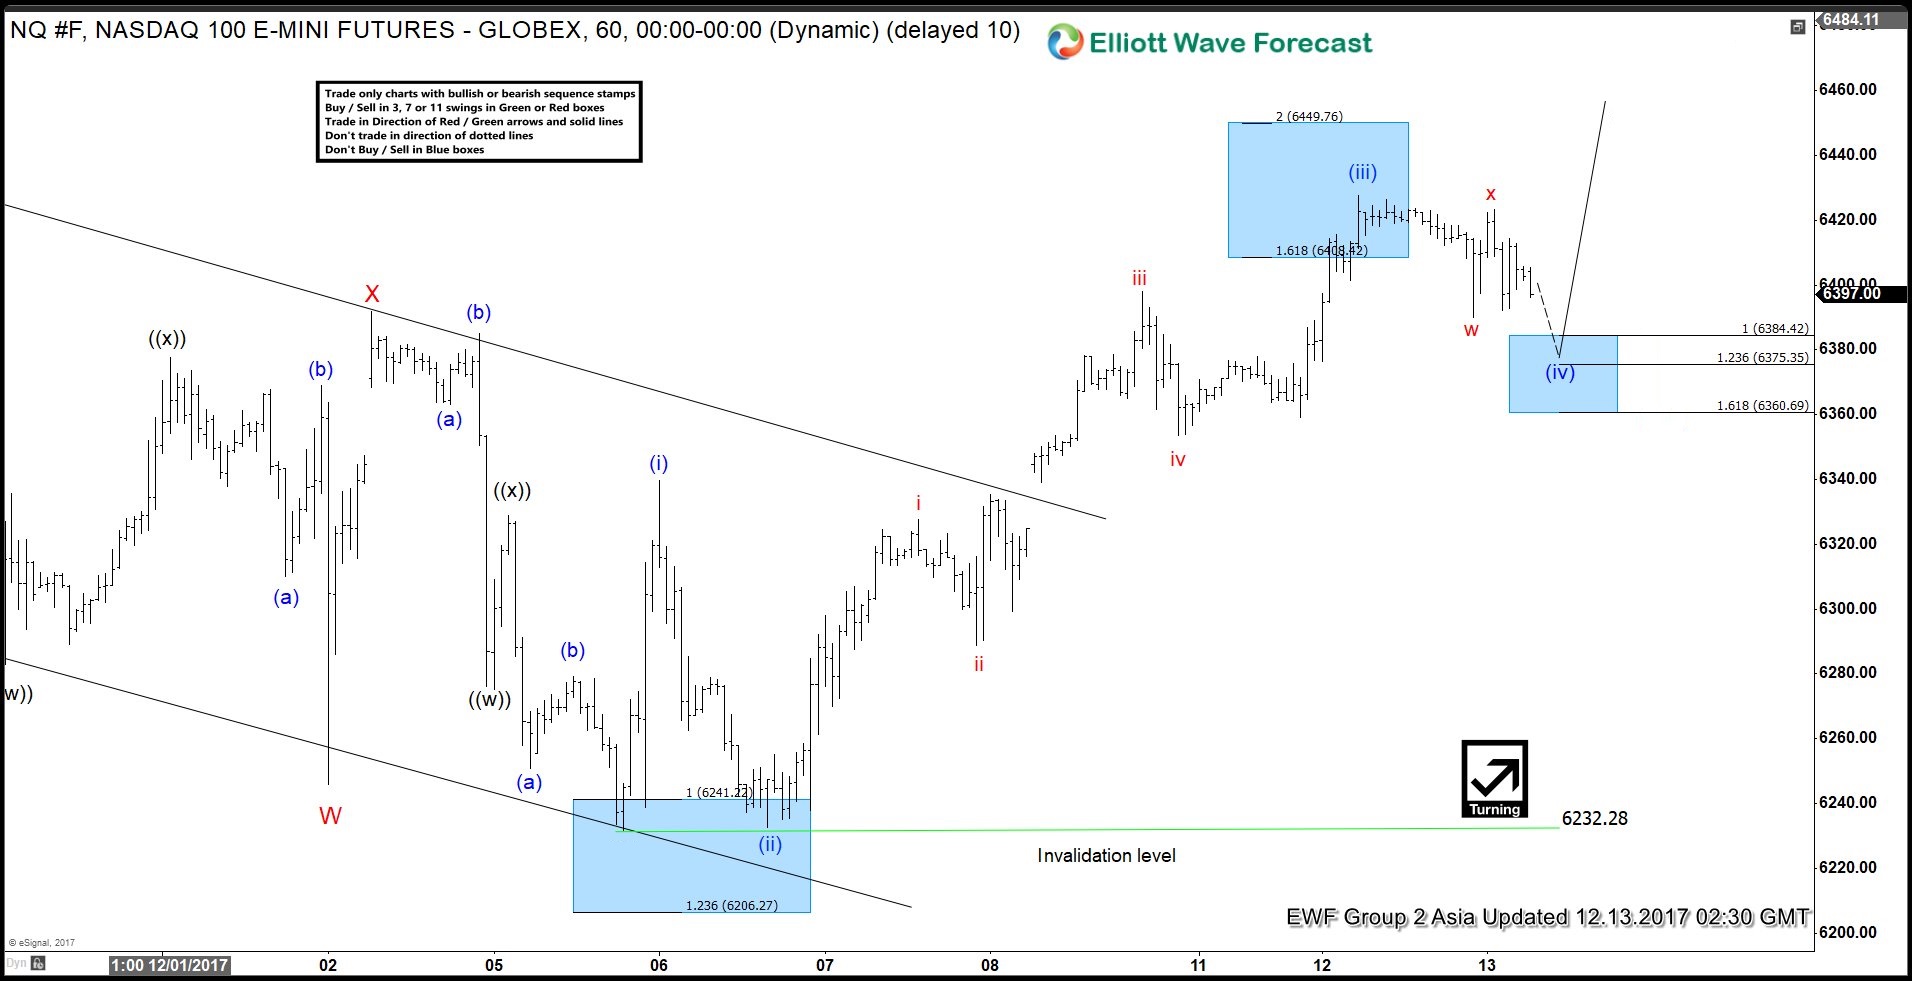
NASDAQ (NQ #F) 5 Waves Impulse
Read MoreNASDAQ (NQ #F) rally from 6232.28 low has unfolded as a 5 Waves Impulse where wave (i) completed at 6339.75, wave (ii) ended at 6232.50, wave (iii) completed at 6427.75 and dip to 6383 completed wave (iv). Index has already made a new high above 6427.75 and also reached inverse 1.236 Fibonacci extension of wave […]
-
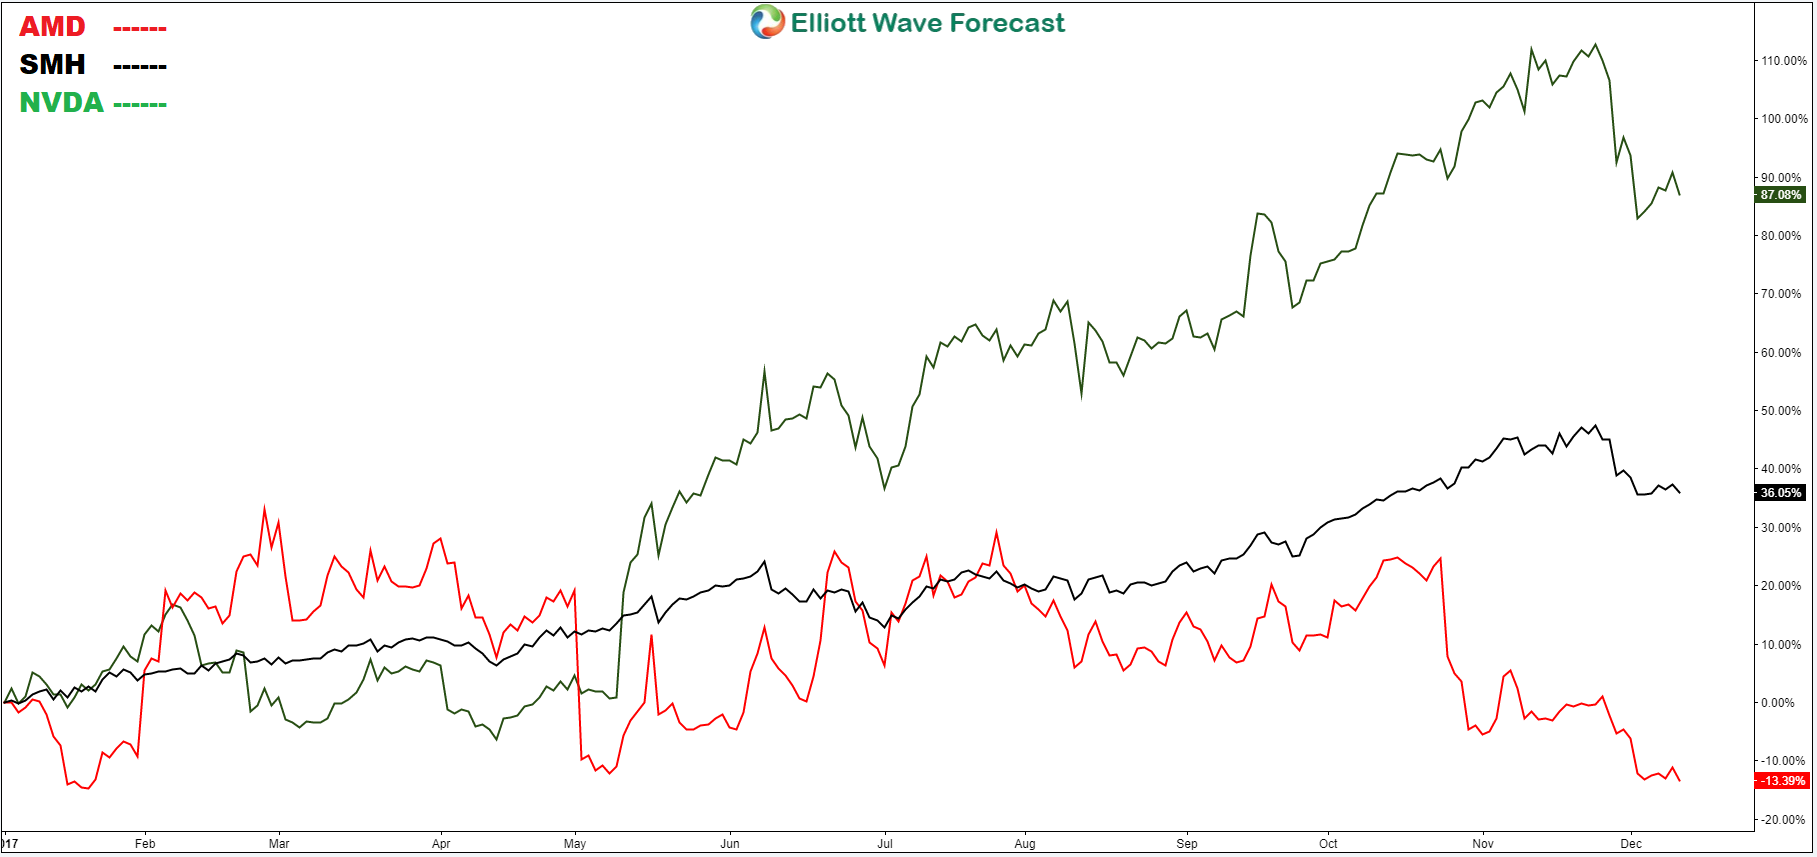
AMD Looking for Lower Levels
Read MoreAdvanced Micro Devices, Inc. (AMD: NASDAQ) is a Global semiconductor company based in California and it was founded 48 years ago. The company’s main products include microprocessors, motherboard chipsets, embedded processors and graphics processors for servers, workstations and personal computers, and embedded systems applications. The semiconductors industry saw it’s biggest growth since 2014 as global revenue surpassed […]
-
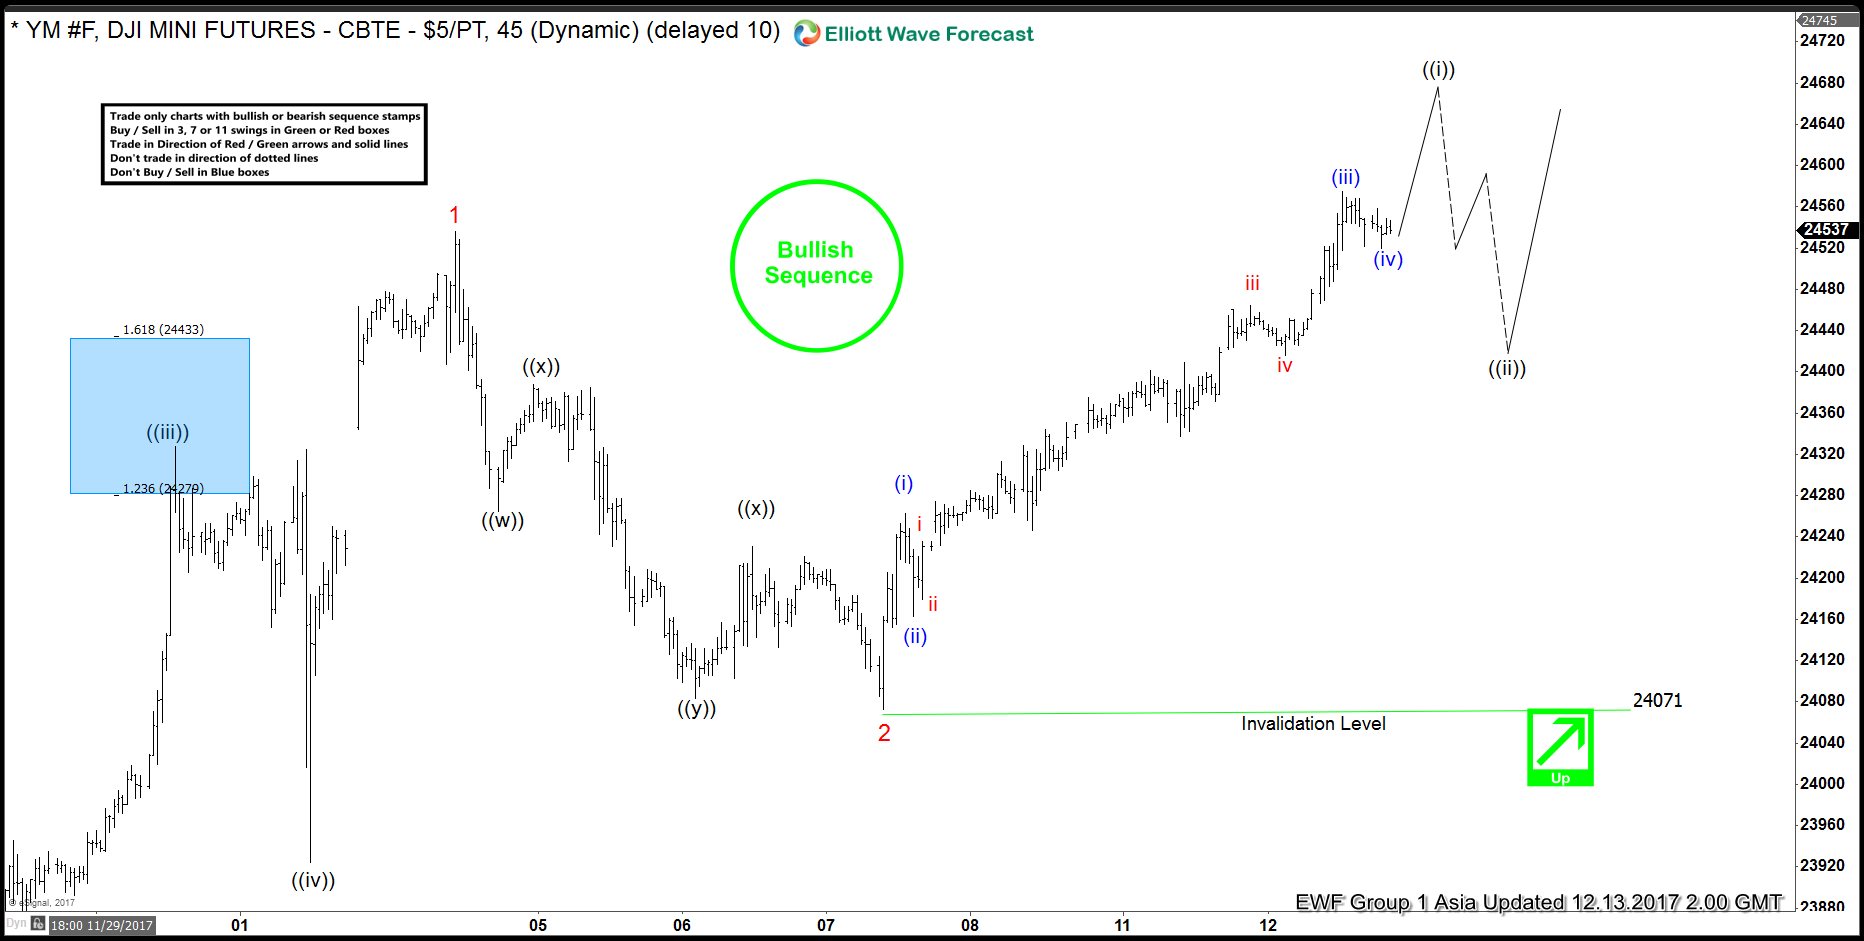
Dow Future Short Term Elliott Wave Analysis
Read MoreDow Future Short Term Elliott Wave view suggests that Intermediate wave (4) ended with the decline to 23205. Up from there, Intermediate wave (5) is unfolding as an Ending Diagonal Elliott Wave structure where Minor wave 1 ended at 24536 and Minor wave 2 ended at 24073. The Index has been able to break above Minor wave […]