

The Power of 3-7-11 and the Grand Super Cycle: How We Saw the Bullish Turn in April 2025 Back on April 9, 2025, while World Indices were dropping sharply and global sentiment had turned overwhelmingly bearish, we published an article that challenged the fear-driven narrative. We explained why selling was not the right approach and […]
-
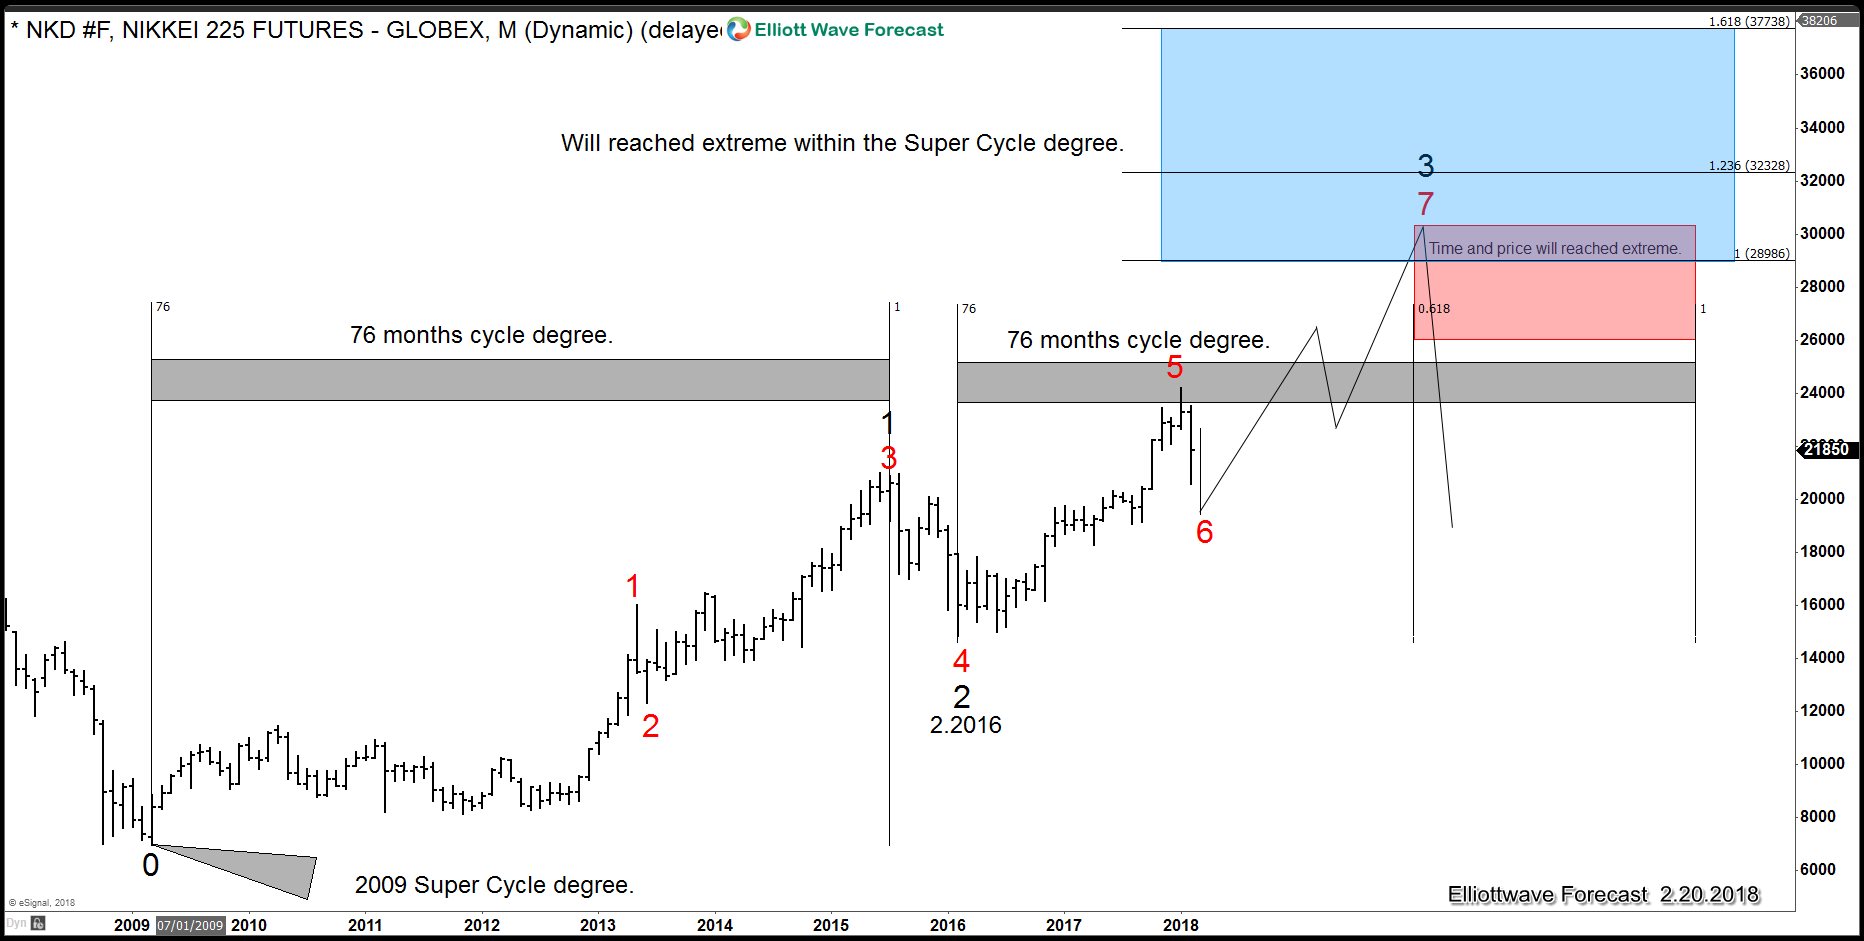
World Indices: What Will Happen in 2020 – 2022
Read More2020-2022 What will happen to the World Indices, A US Constitutional Crisis or Something Else? The market move by Technical sequences, levels, and areas. Every day we see how the price moves from one area to another and relates the time frames from Subminutte cycles to the Grand Super cycles. The Idea is relating the […]
-
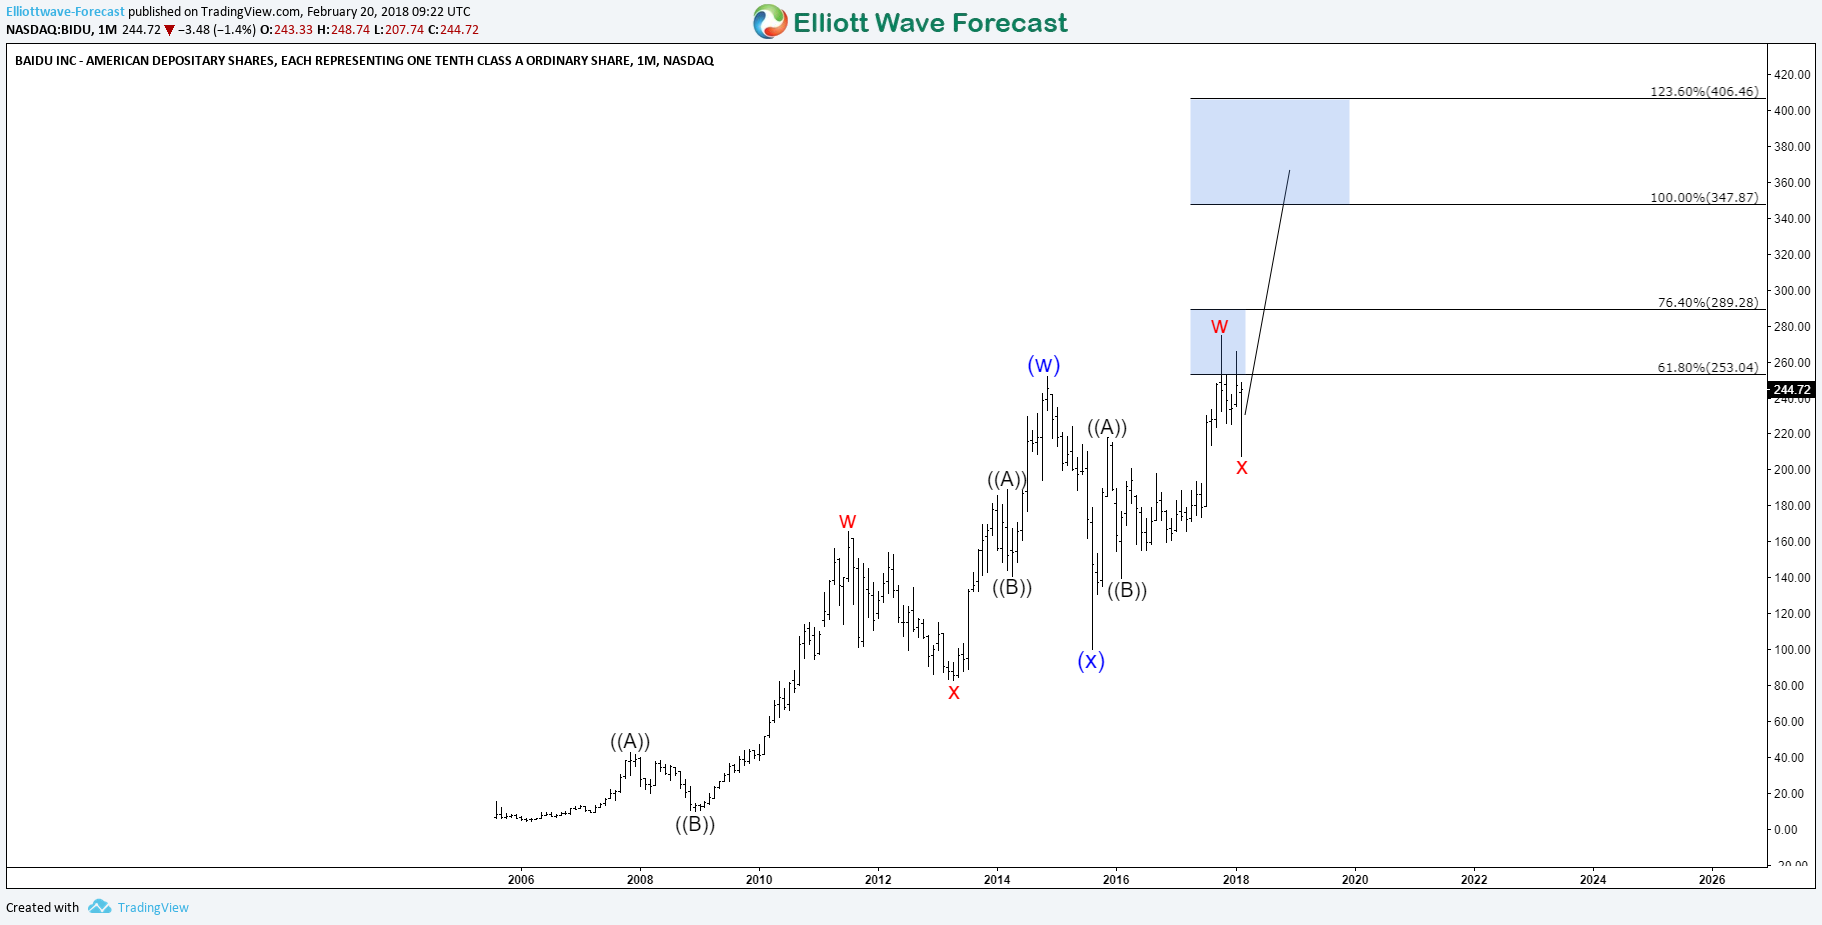
Baidu (BIDU) Resuming the Bullish Cycle
Read MoreBaidu, Inc. (NASDAQ: BIDU) is one of the largest Chinese multinational technology companies specializing in Internet-related services & products and one of the premier AI leaders in the world. Last week, Baidu has reported excellent results in Q4 which helped its stock to bounce +15%. Solid margin expansion and good developments on several fronts were on the headlines behind the recent […]
-
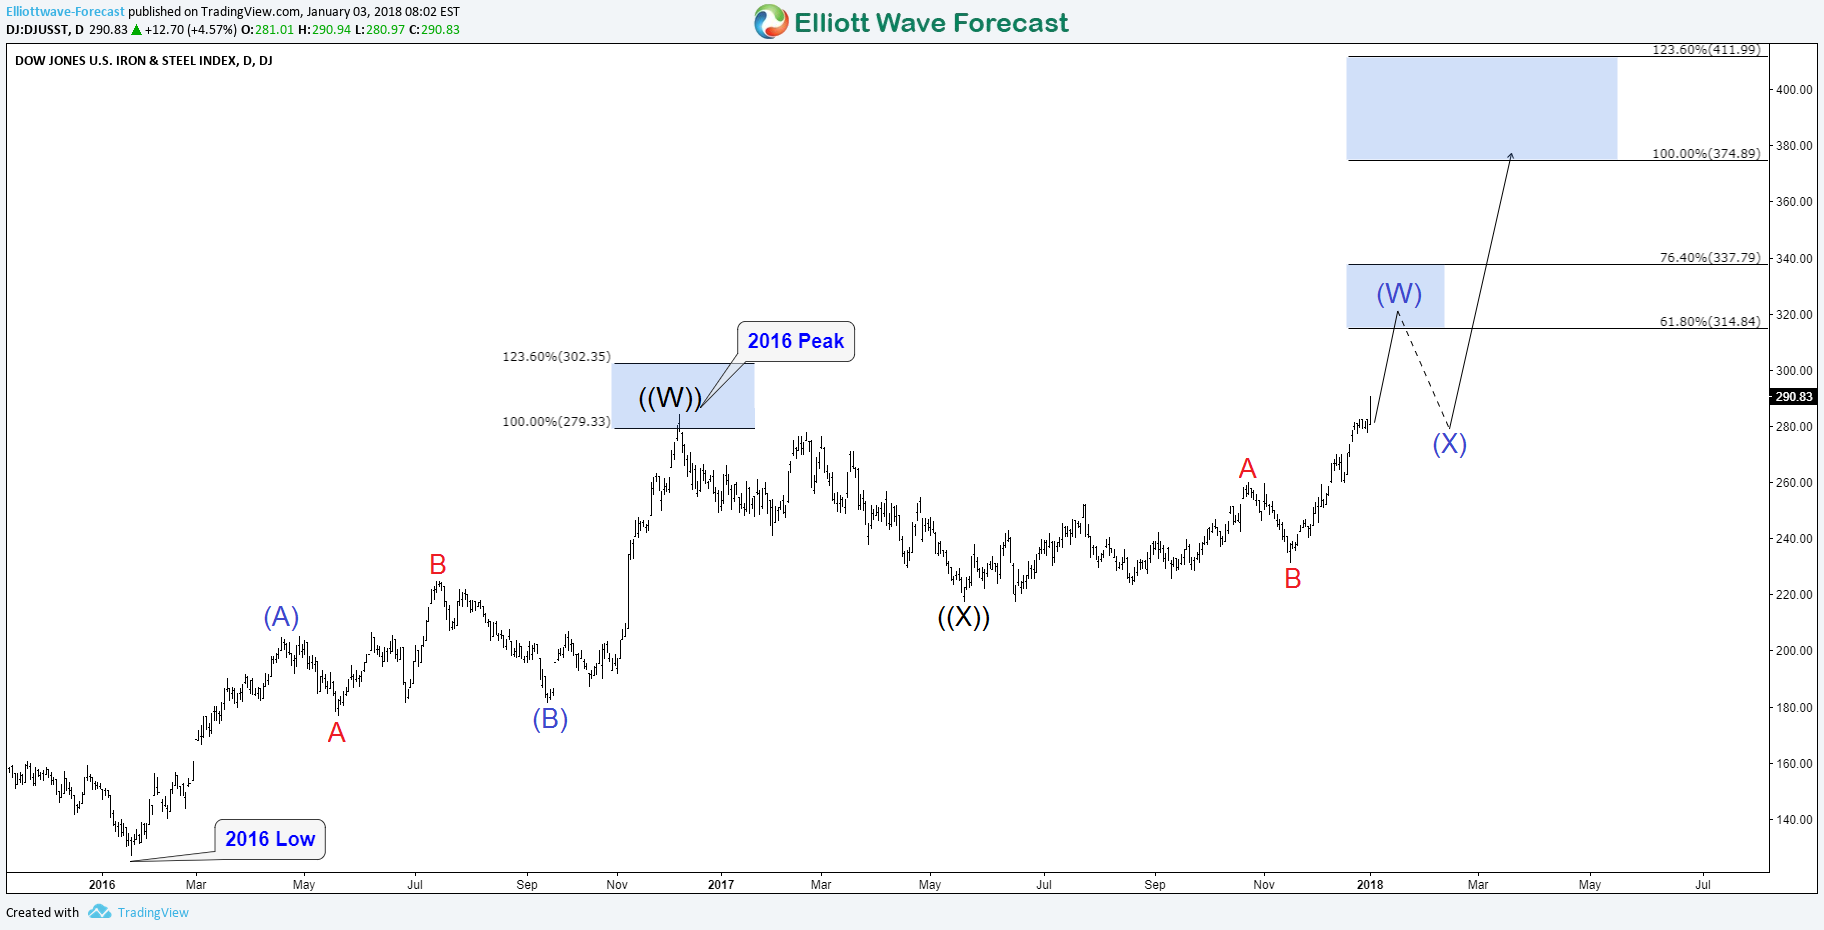
Dow Jones Iron & Steel Index DJUSST Bullish Sequence
Read MoreLast month, Dow Jones Iron & Steel Index DJUSST managed to break above December 2016 peak and created an incomplete bullish sequence from 2016 low calling for a move higher toward equal legs area $374 -$411. In the daily chart, we can see that the move higher was expected to pullback from the 61.8% – […]
-
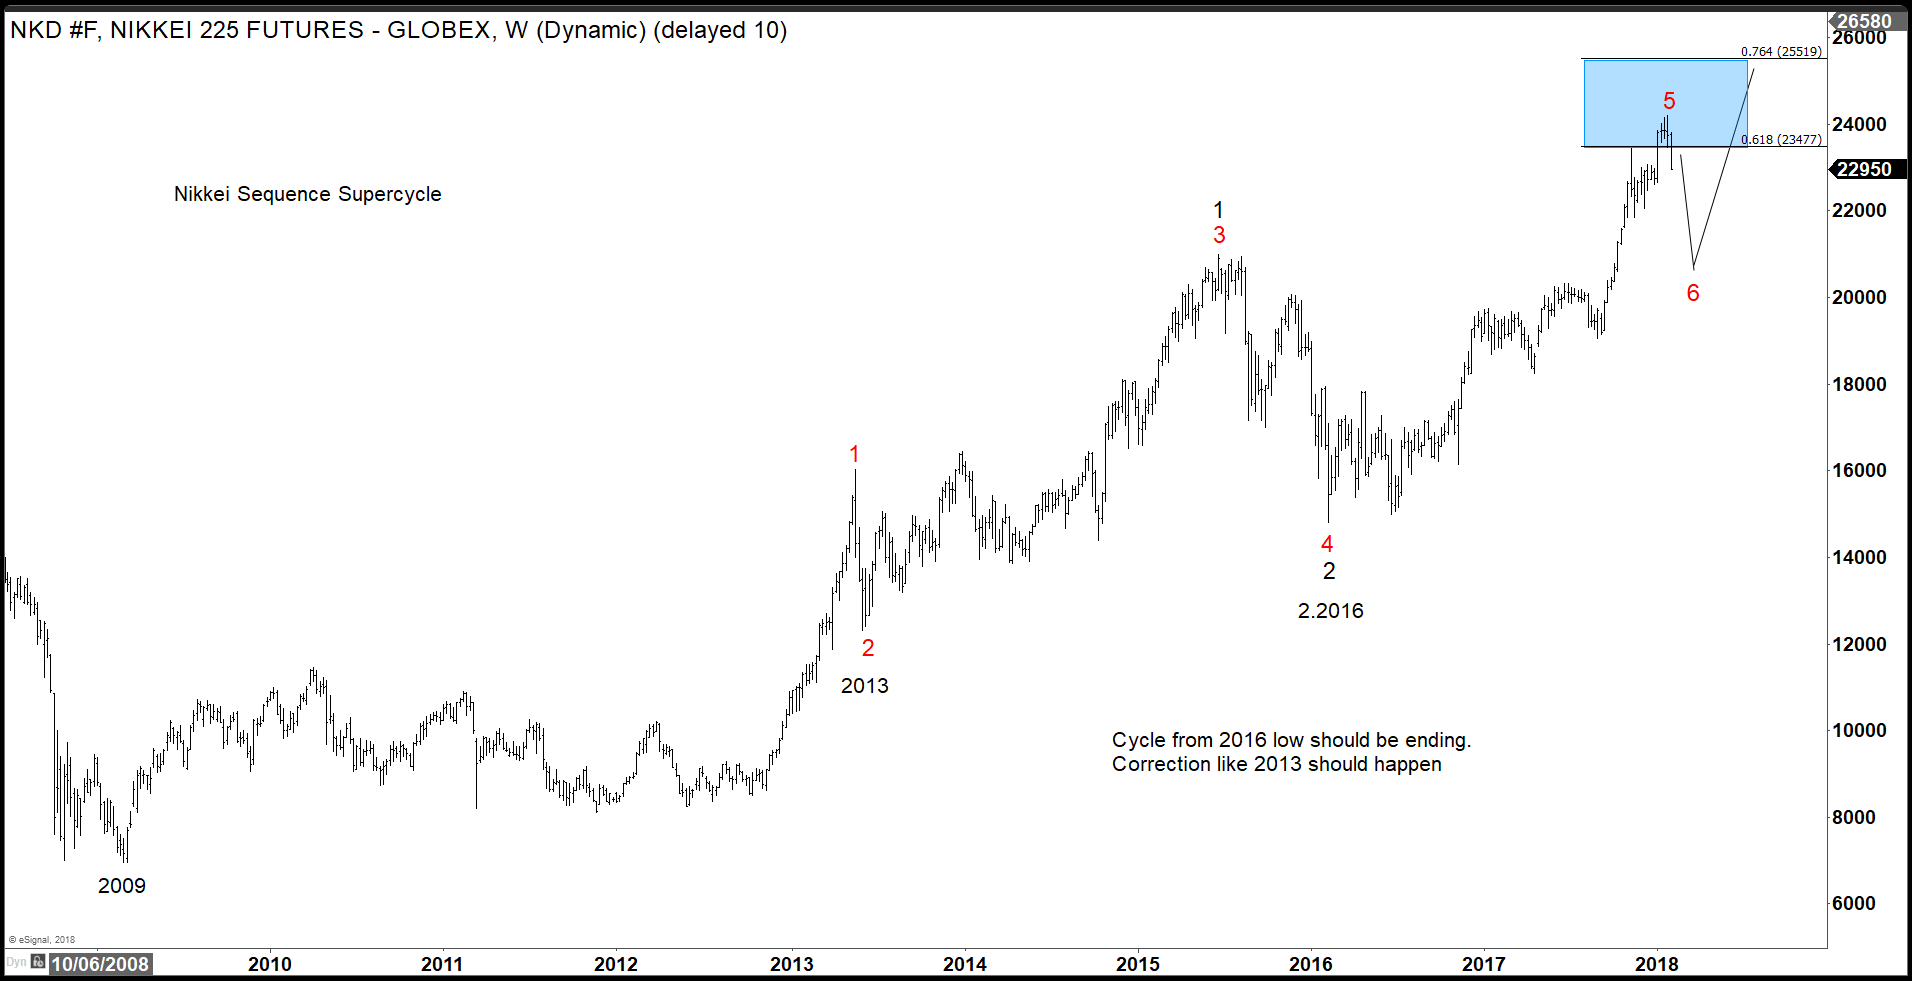
Why the NIKKEI Index still has more upside
Read MoreIn this blog, I want to discuss with you why NIKKEI Index has still more upside. In the chart below you can see our NIKKEI Indexweekly chart. You can see that the NIKKEI is in the area of 61.8-76.4% Extension from 2009 lows. Showing an incomplete bullish sequence against that low. We do understand that […]
-
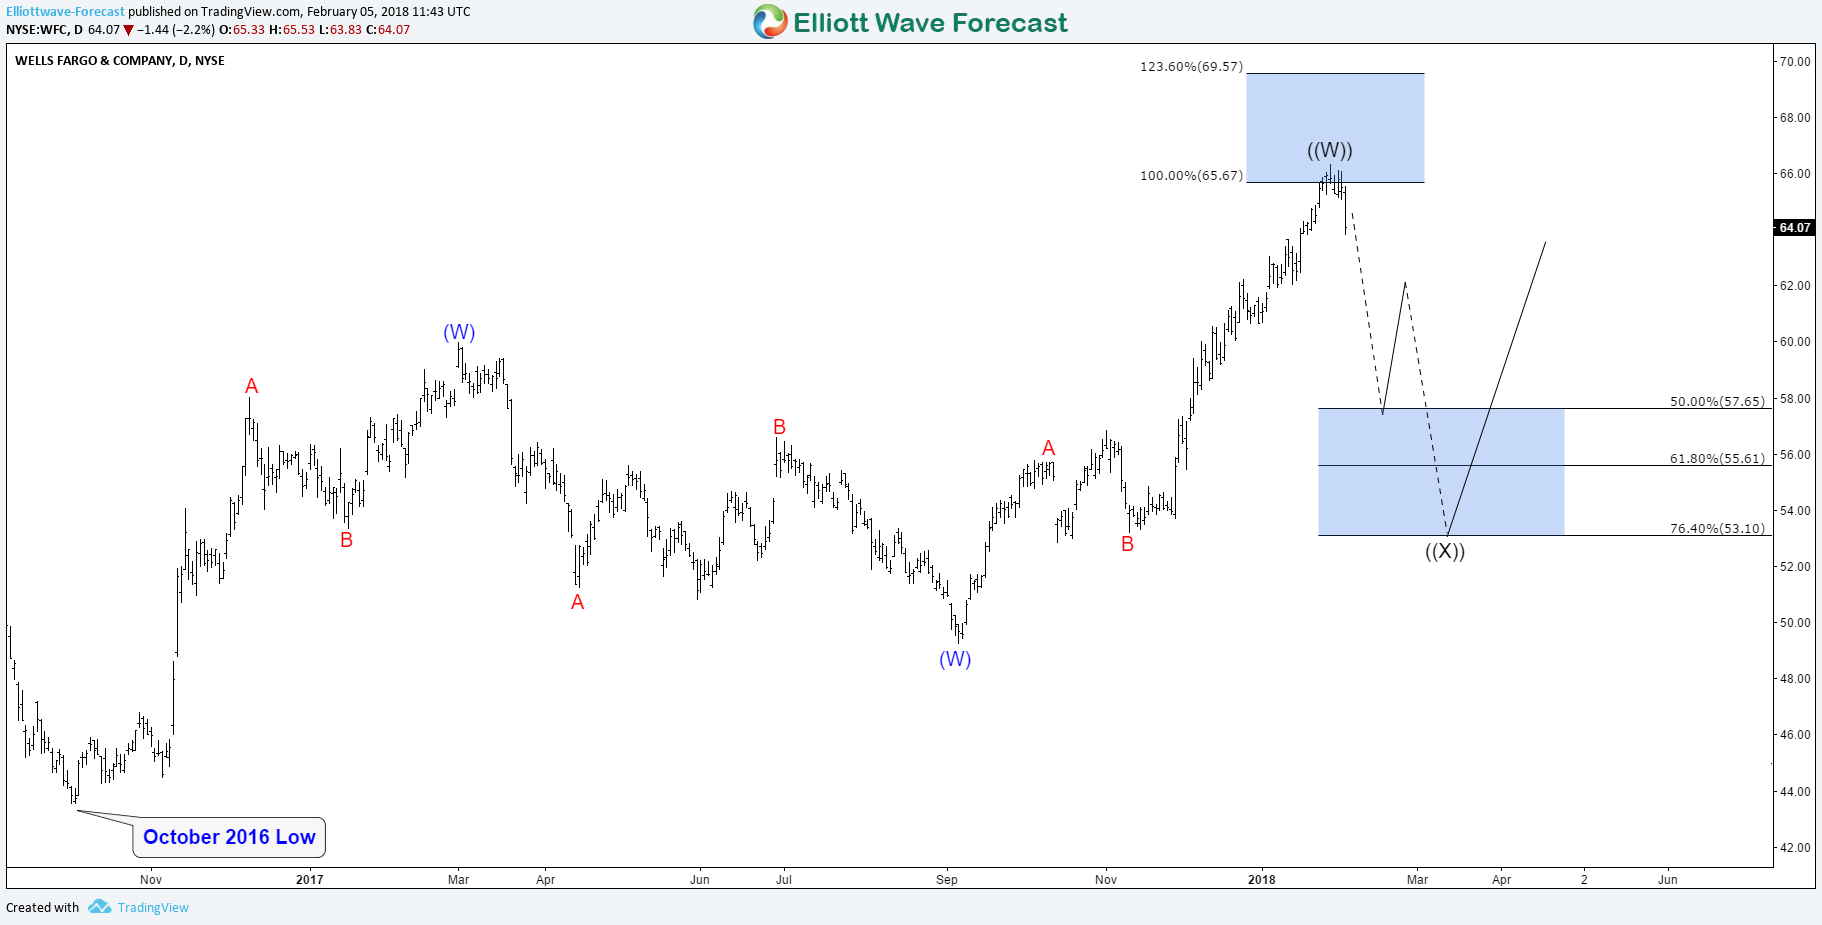
Wells Fargo WFC Remains Bullish
Read MoreWells Fargo (NYSE: WFC) is the world’s second-largest bank by market capitalization and the third largest bank in the U.S. by assets. Last week, the Bank was fined $185M by the FED for ‘widespread illegal practices’ because of the recent fake accounts scandal and it was banned from growing until it convinces authorities it’s addressing shortcomings. It’s […]
-
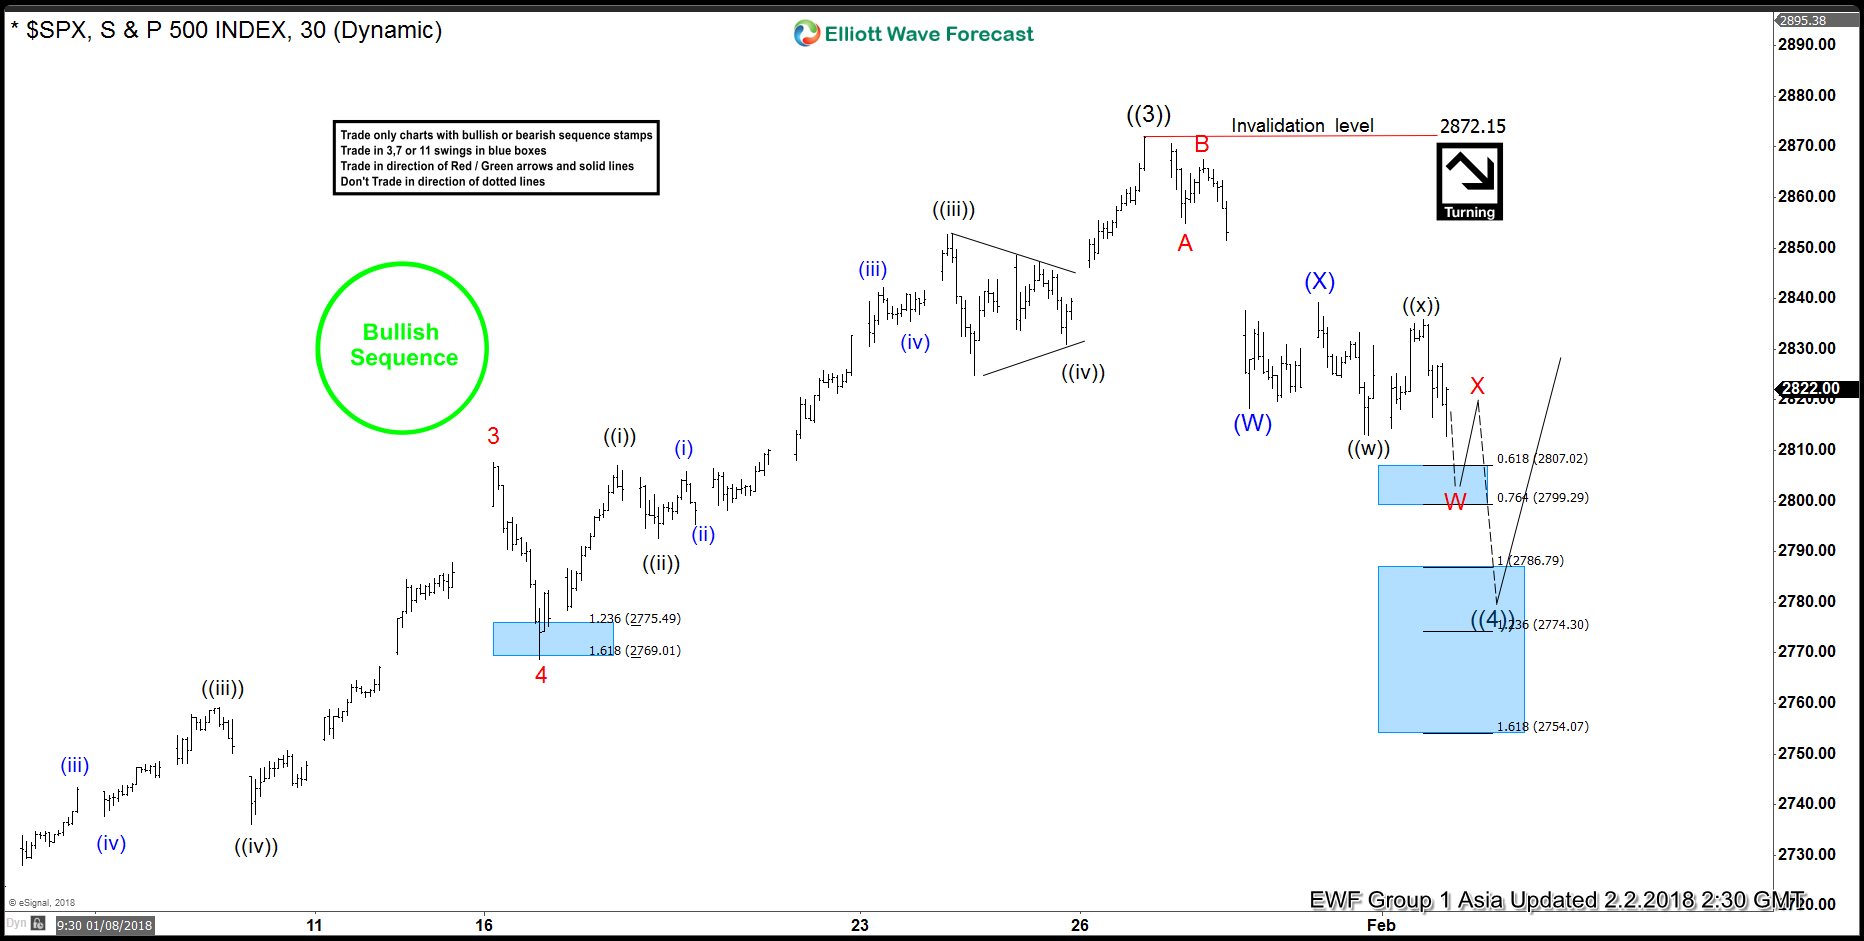
Elliott Wave Analysis: SPX correction targets 2786
Read MoreSPX Short Term Elliott Wave view suggests that Primary wave ((3)) ended with the rally to 2872.15. Decline from there in Primary wave ((4)) pullback is unfolding as a double three Elliott Wave structure where Intermediate wave (W) ended at 2818.27 and Intermediate wave (X) ended at 2839.26. While near term bounces stay below 2872.15, expect Index to […]