

The Power of 3-7-11 and the Grand Super Cycle: How We Saw the Bullish Turn in April 2025 Back on April 9, 2025, while World Indices were dropping sharply and global sentiment had turned overwhelmingly bearish, we published an article that challenged the fear-driven narrative. We explained why selling was not the right approach and […]
-
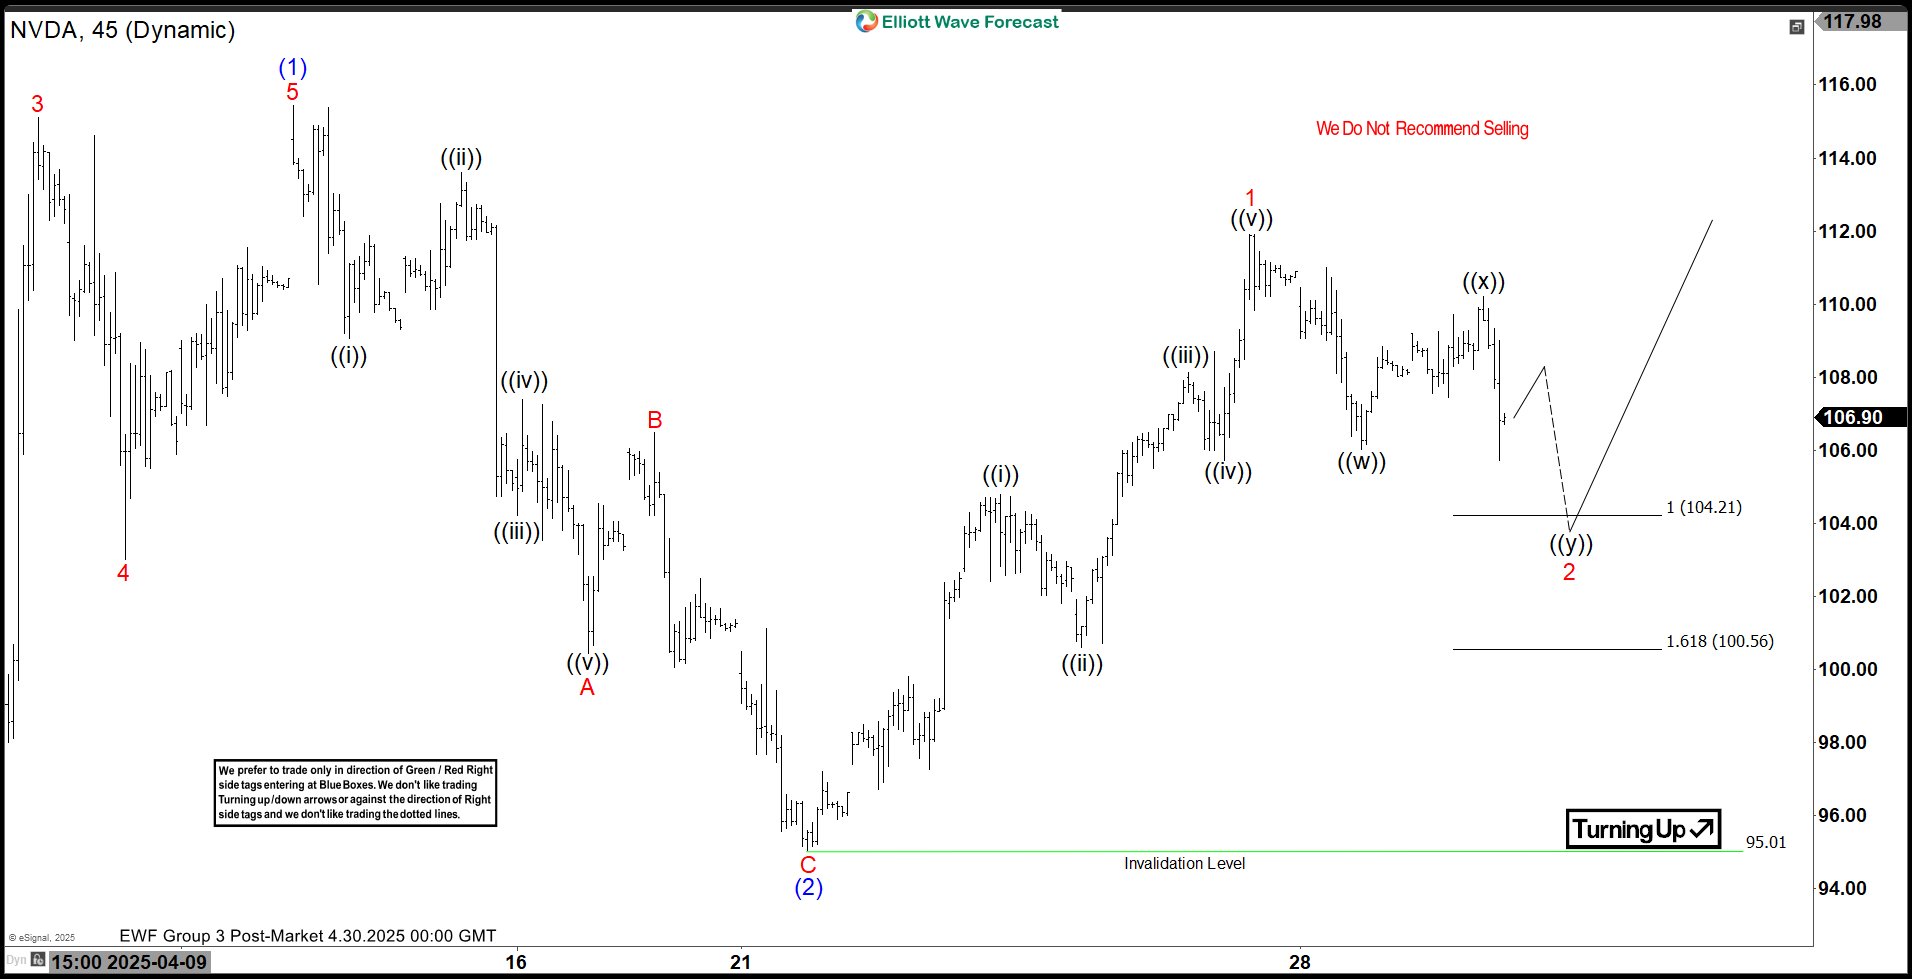
NVIDIA Corp. $NVDA Extreme Areas Offering Buying Opportunities
Read MoreHello everyone! In today’s article, we’ll examine the recent performance of NVIDIA Corp. ($NVDA) through the lens of Elliott Wave Theory. We’ll review how the rally from the April 21, 2025 low unfolded as a 5-wave impulse followed by a 7-swing correction (WXY) and discuss our forecast for the next move. Let’s dive into the structure and expectations for this stock. 5 Wave […]
-
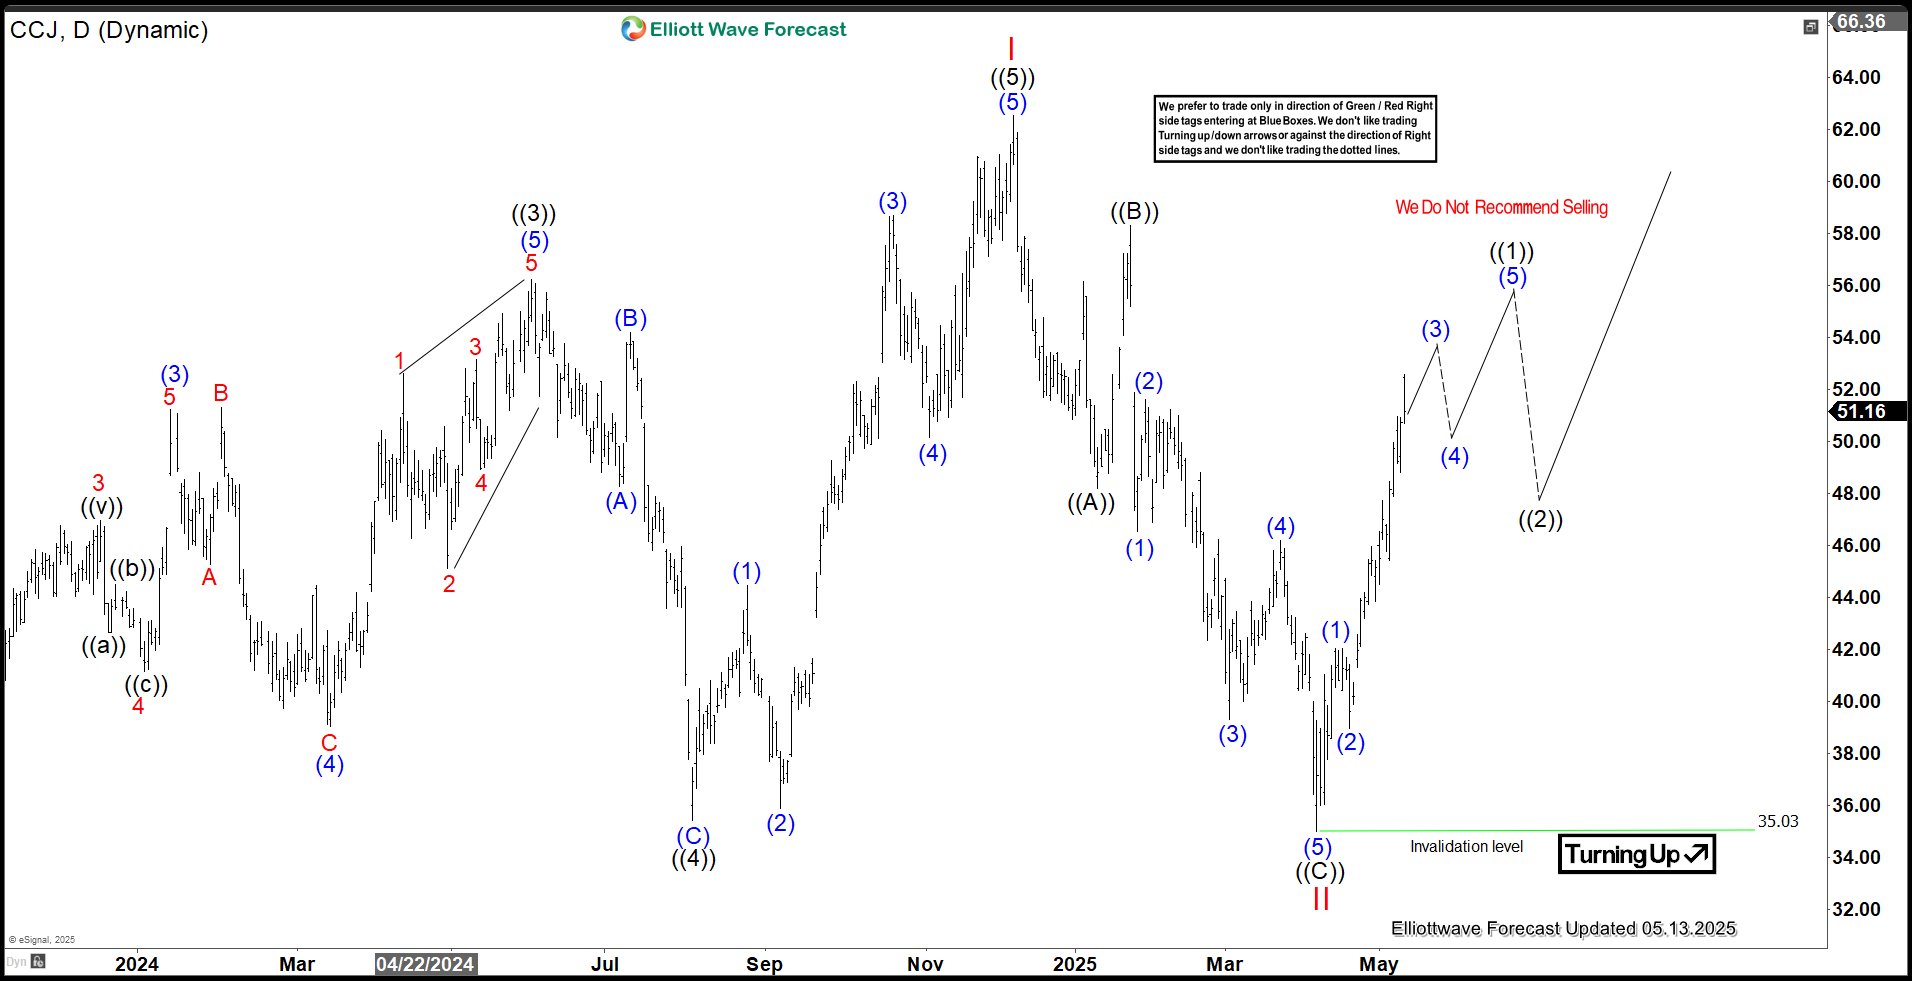
Cameco (CCJ) Emerges from Pullback, Renews Upward Momentum
Read MoreCameco (CCJ) has ended correction against 2020 low and turned higher. This article looks at the Elliott Wave path of the stock.
-
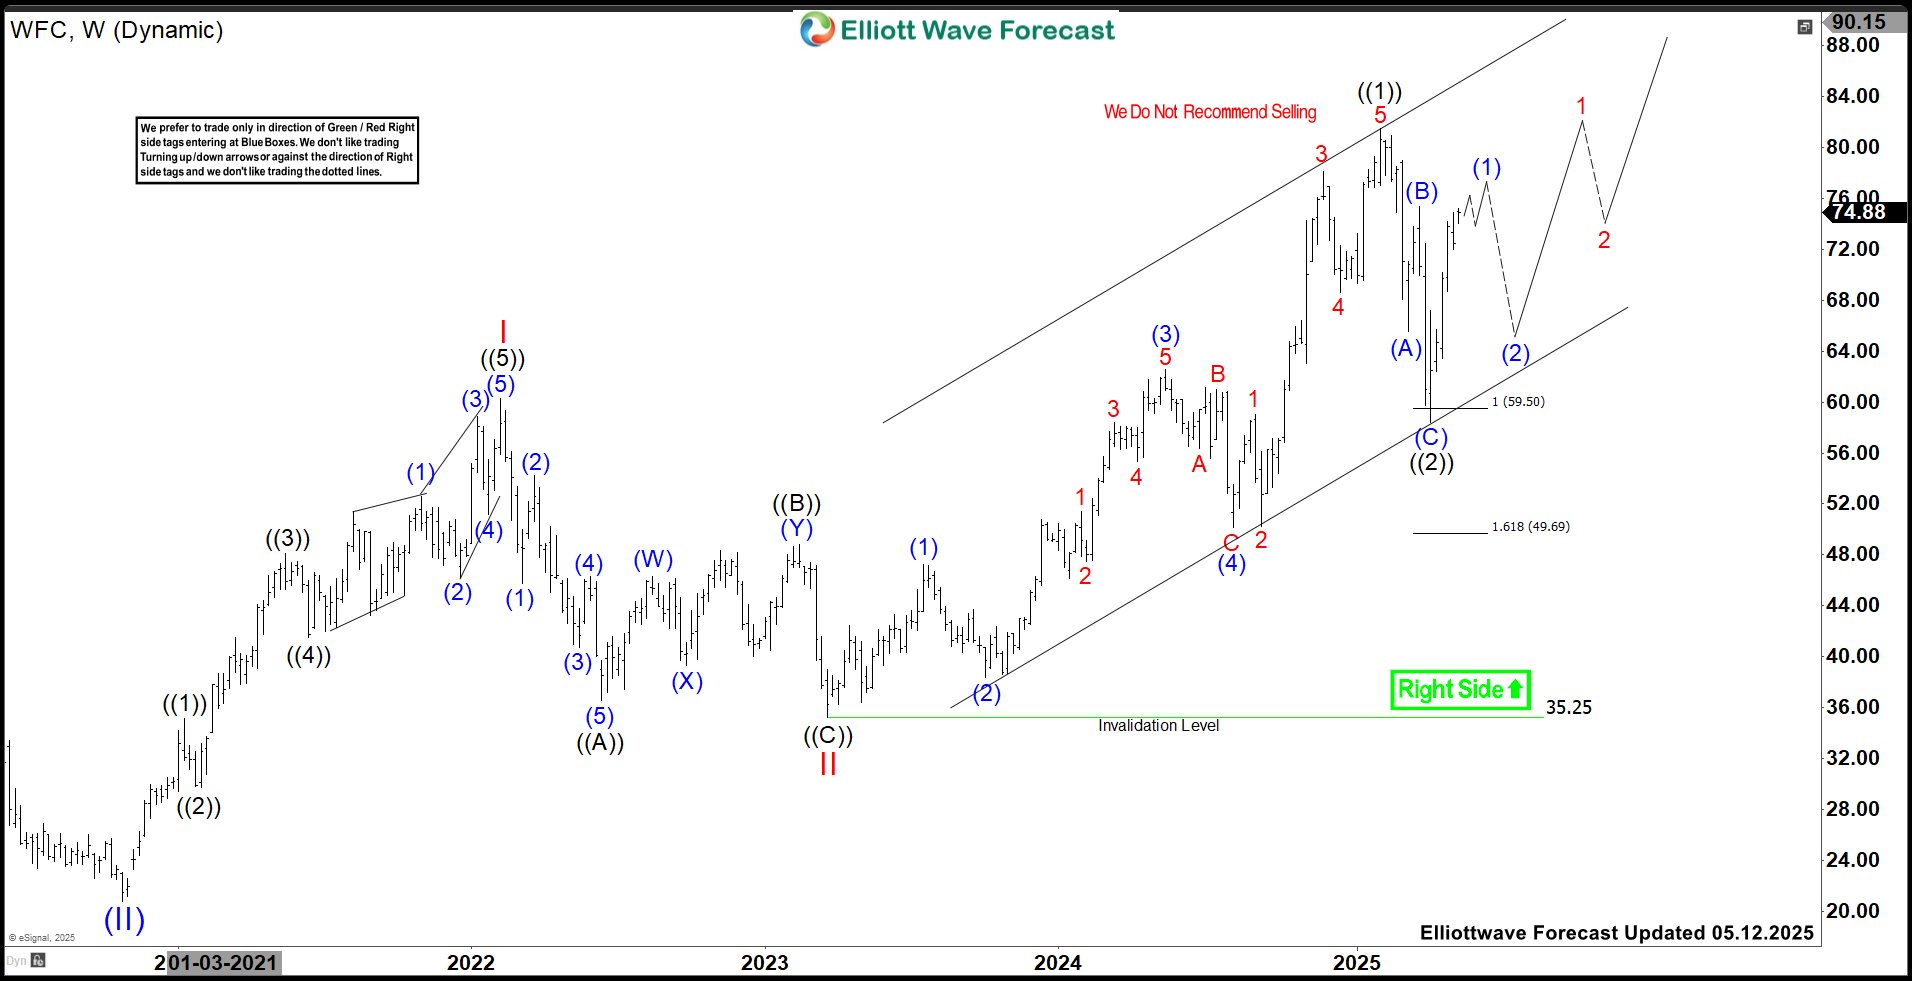
Is WFC Setting Up For A Major Rally?
Read MoreWells Fargo & Company (WFC) provides diversified banking, investment, mortgage, consumer & commercial finance products & services in United States & globally. It operates through four segments; Consumer banking & lending, Commercial banking, Corporate & Investment banking & Wealth management. It comes under Financial services sector & trades as “WFC” ticker at NYSE. WFC is […]
-
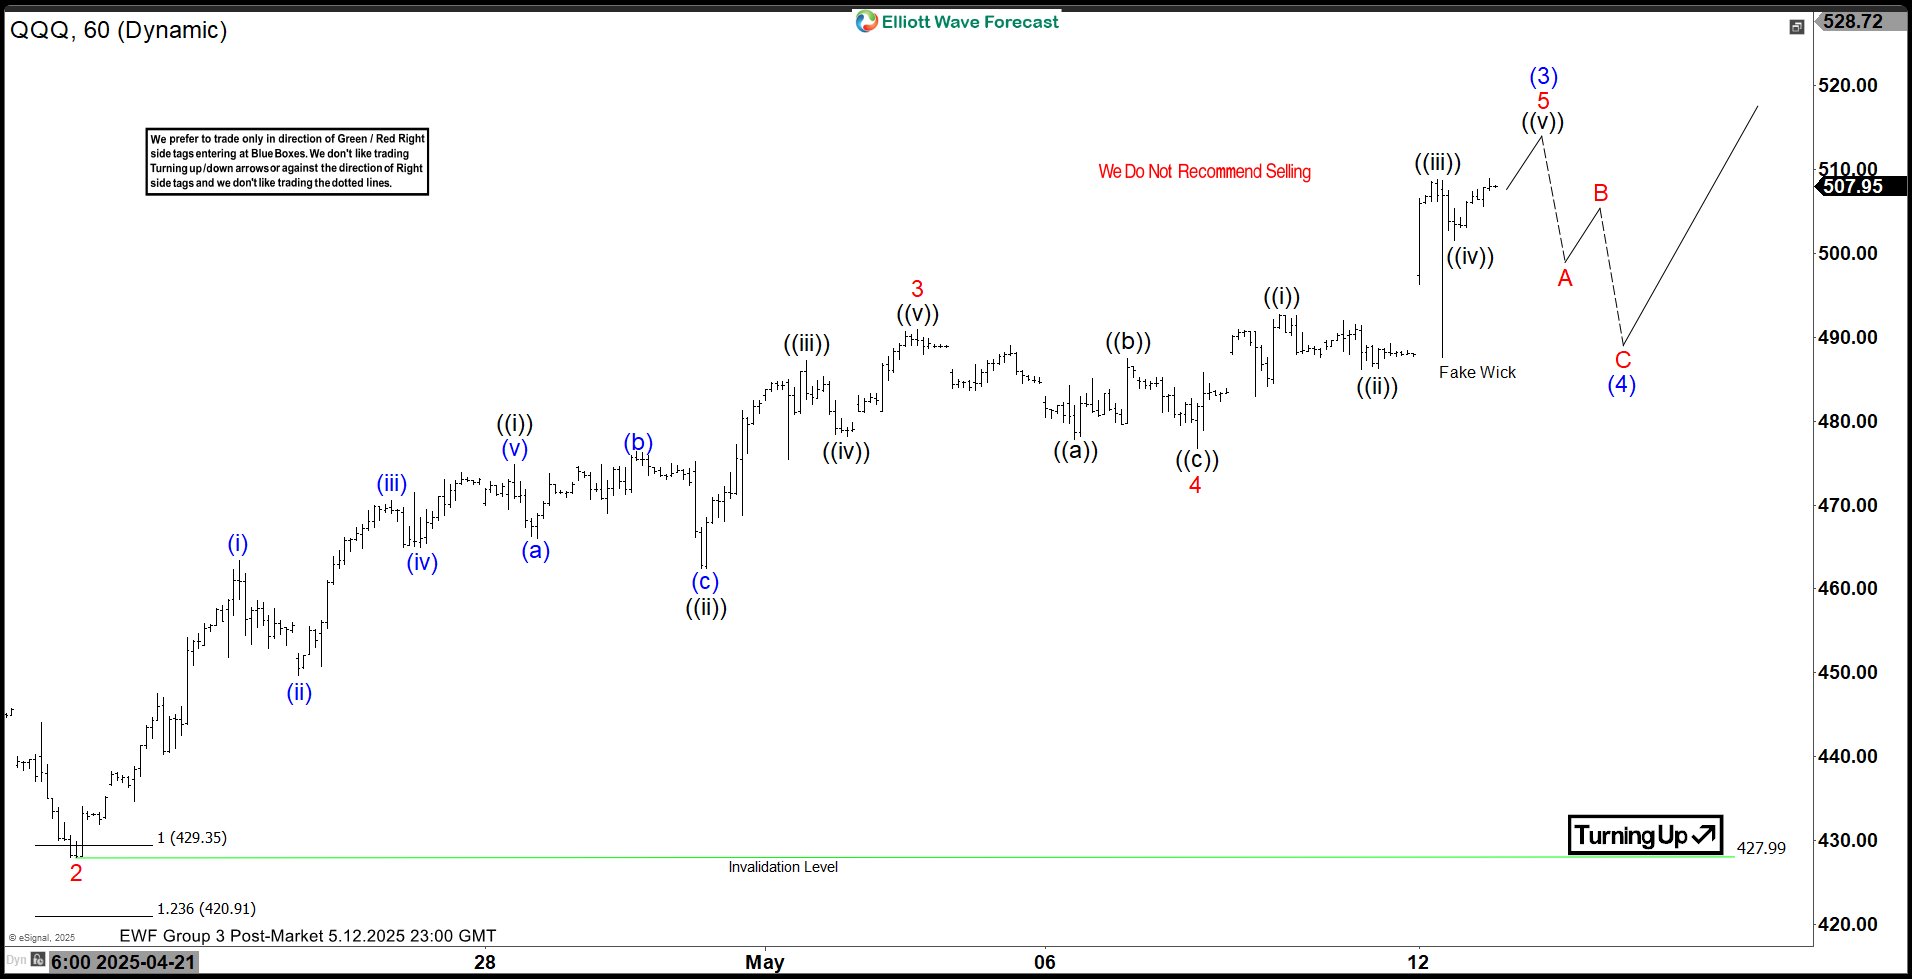
Elliott Wave Analysis: Nasdaq 100 ETF (QQQ) Poised for Extended Impulse
Read MoreNasdaq 100 ETF (QQQ) has ended correction after the tariff selloff and turned higher in impulsive rally. This article & video look at the Elliottwave path.
-
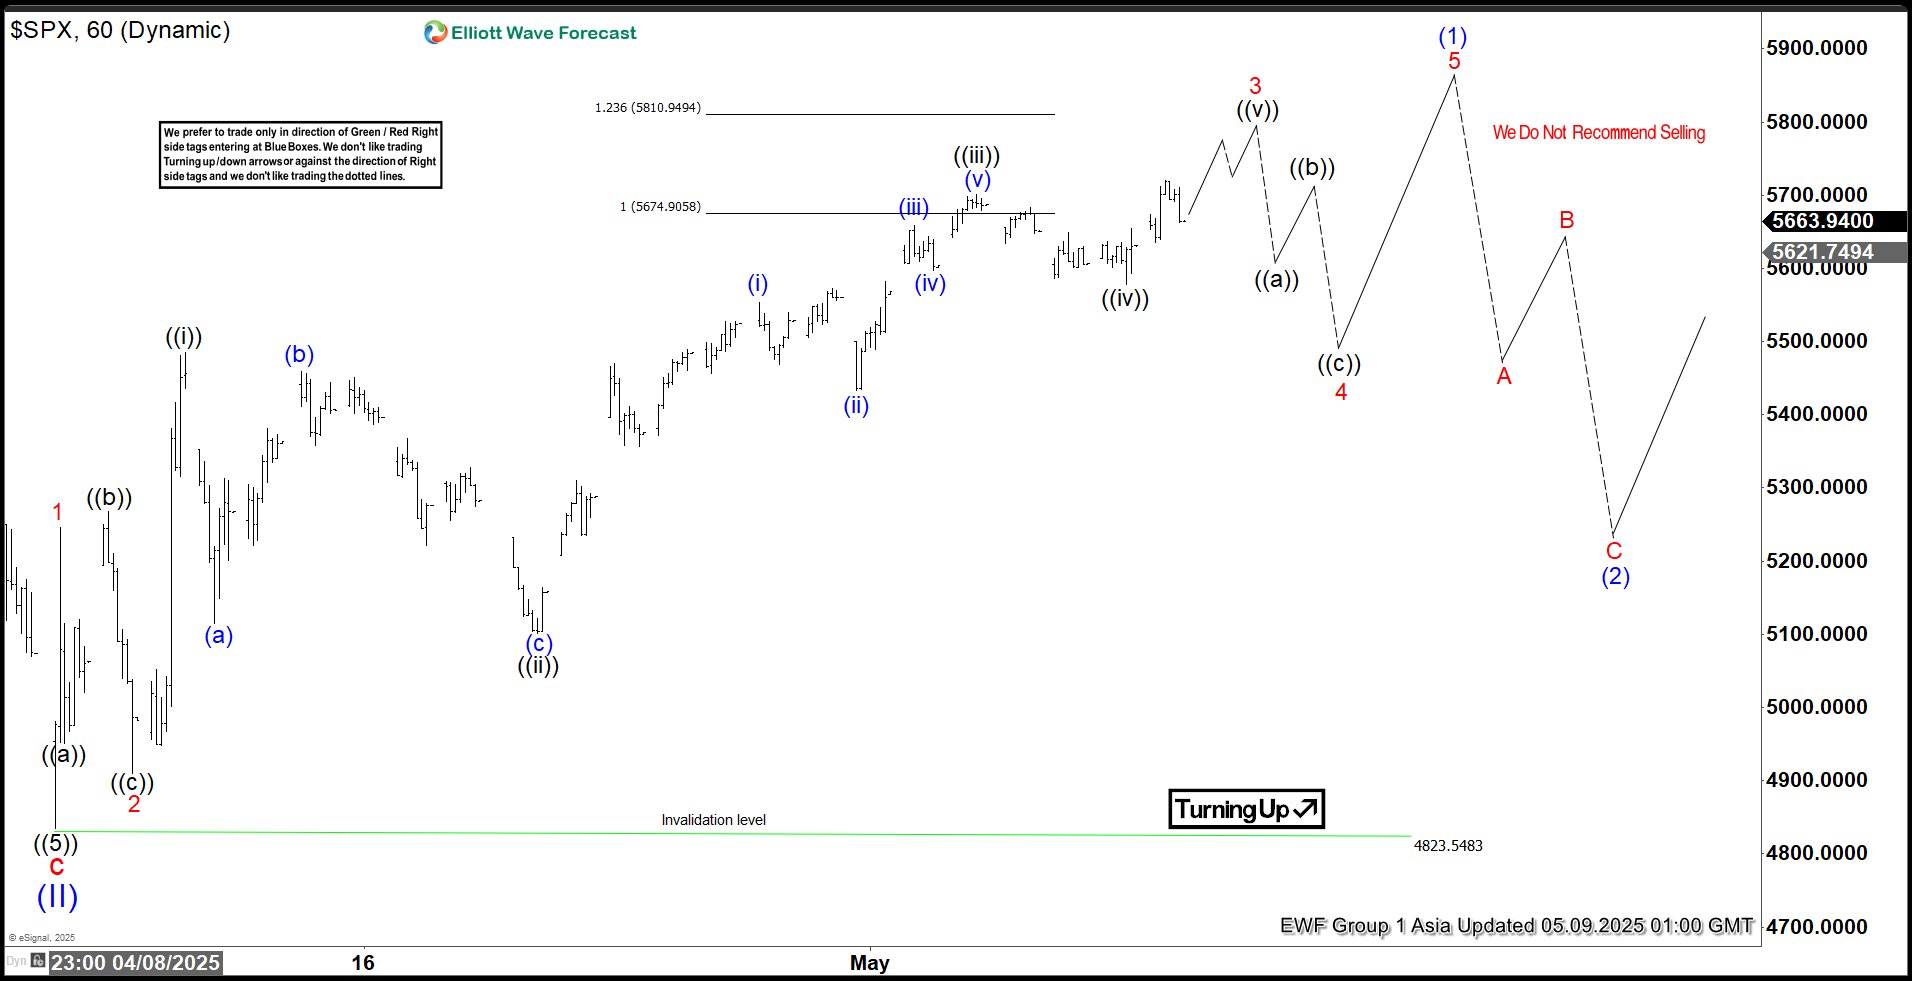
Elliott Wave Framework Highlights S&P 500 (SPX) Bullish Impulse
Read MoreS&P 500 (SPX) may have ended the correction after the tariff announcement. This article and video look at the Elliott Wave path.
-
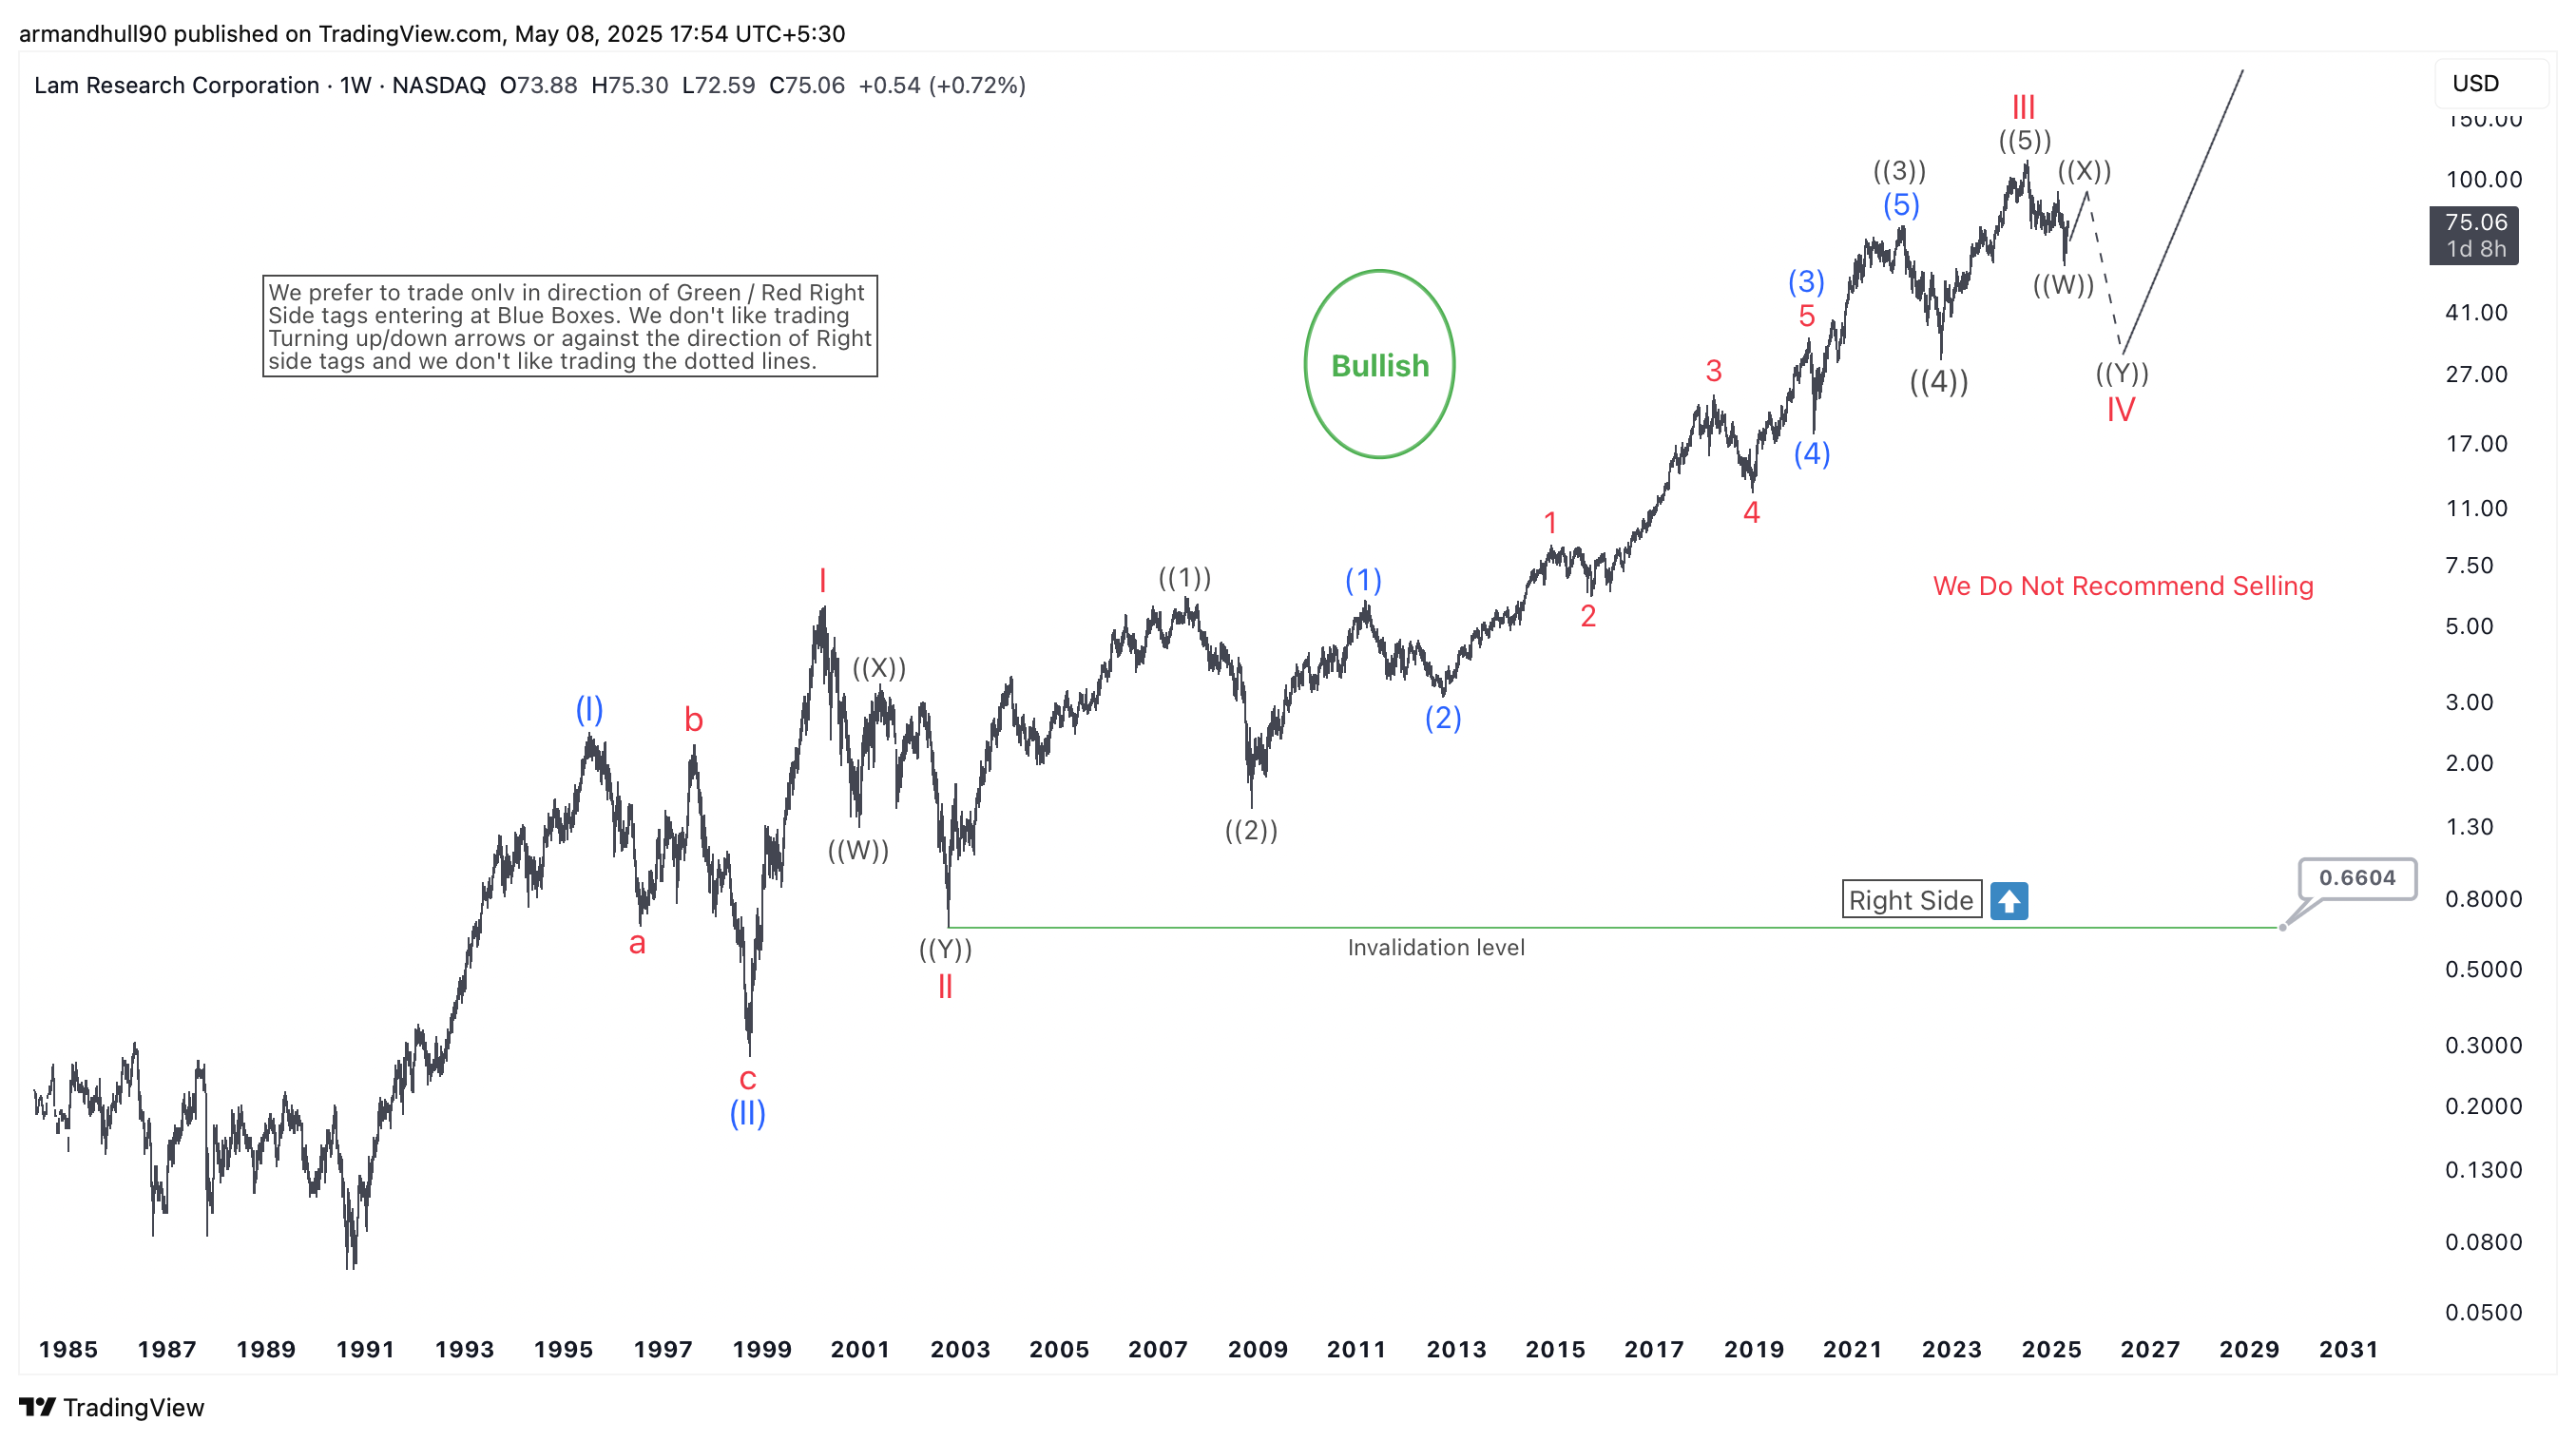
Lam Research (LRCX) Elliott Wave Update: Bullish Trend Intact Despite Ongoing Correction
Read MoreLam Research (LRCX) remains bullish despite a corrective wave IV. Elliott Wave analysis suggests further upside potential as wave V approaches. Lam Research Corporation (LRCX) shows a strong long-term bullish trend based on Elliott Wave analysis. The multi-decade chart highlights a clear impulsive structure that began in the early 2000s. After finishing a large corrective […]