

The Power of 3-7-11 and the Grand Super Cycle: How We Saw the Bullish Turn in April 2025 Back on April 9, 2025, while World Indices were dropping sharply and global sentiment had turned overwhelmingly bearish, we published an article that challenged the fear-driven narrative. We explained why selling was not the right approach and […]
-
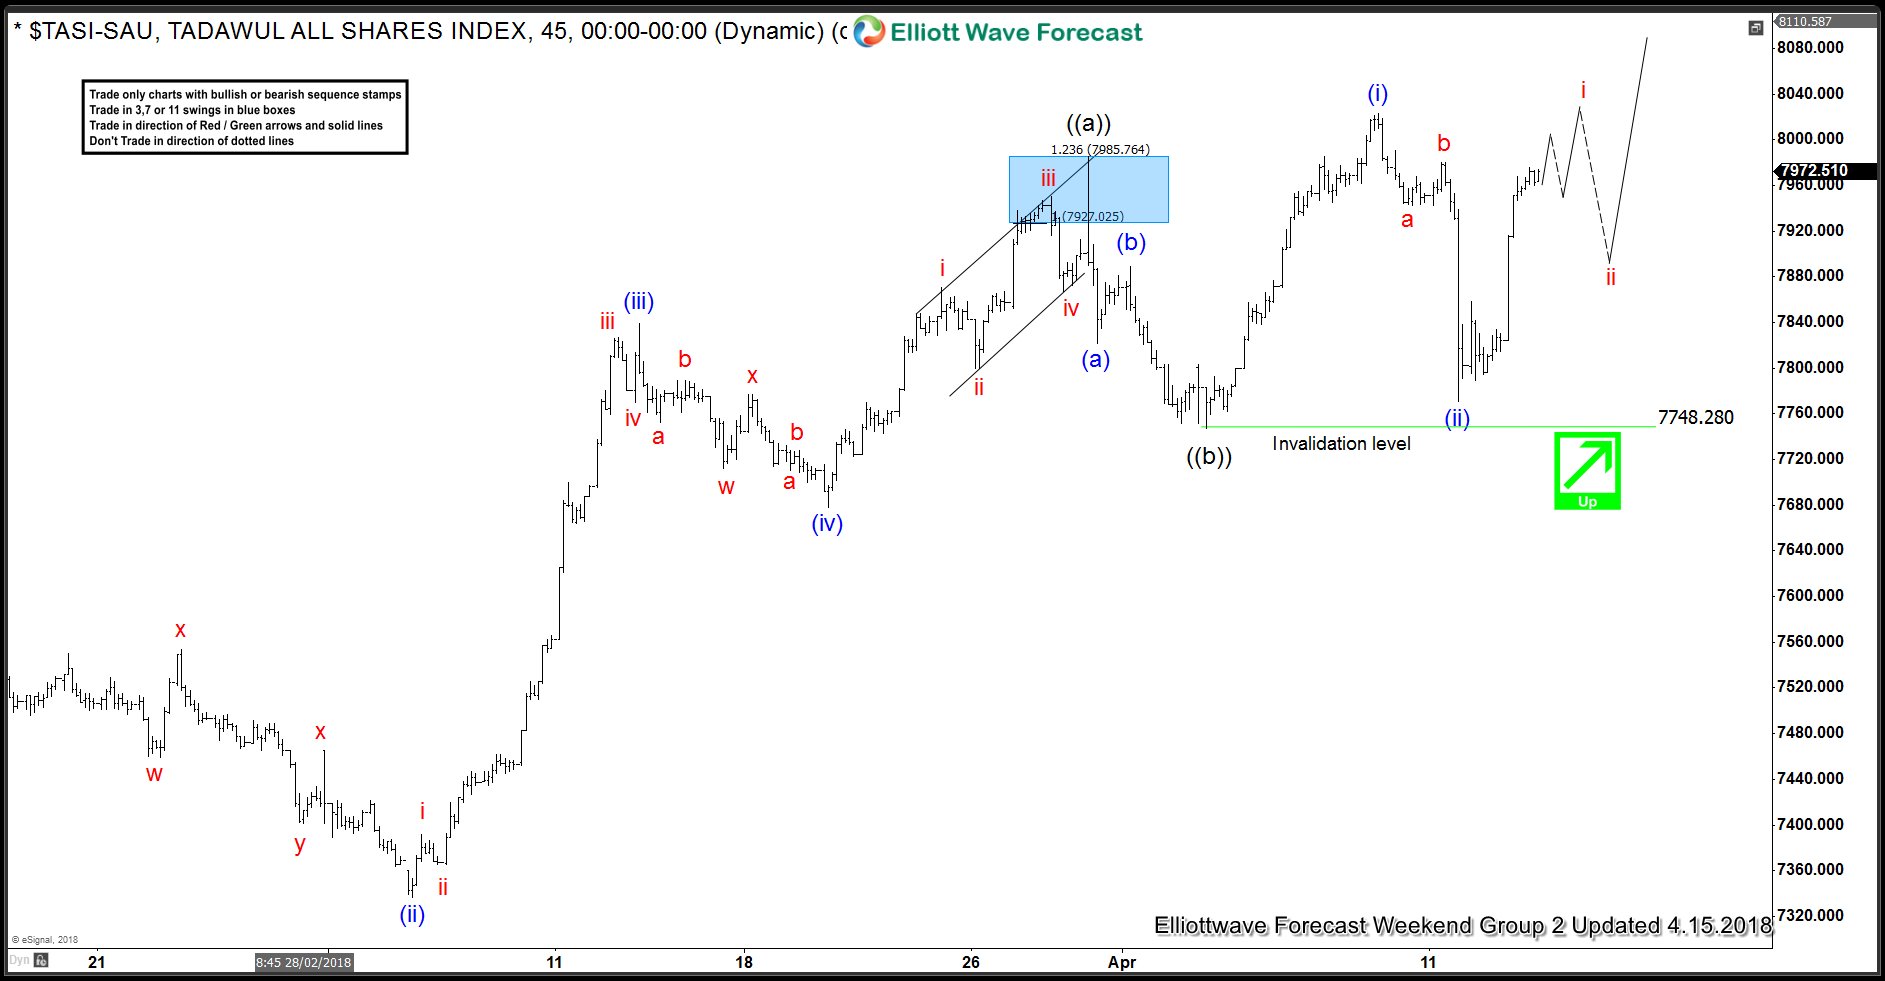
Elliott Wave Analysis: TASI (Tadawul All Shares) Calling Strength Higher
Read MoreTASI (Tadawul All Shares) an index from Saudi Arabia Elliott Wave Analysis suggests that the cycle from 11/21/2017 is showing higher high sequence. Calling for more upside extension towards 8259.82-8484.56 area next before it ends that cycle and starts the pullback. So now let’s take a look at the shorter cycles from February 11.2018 low. Which showed […]
-
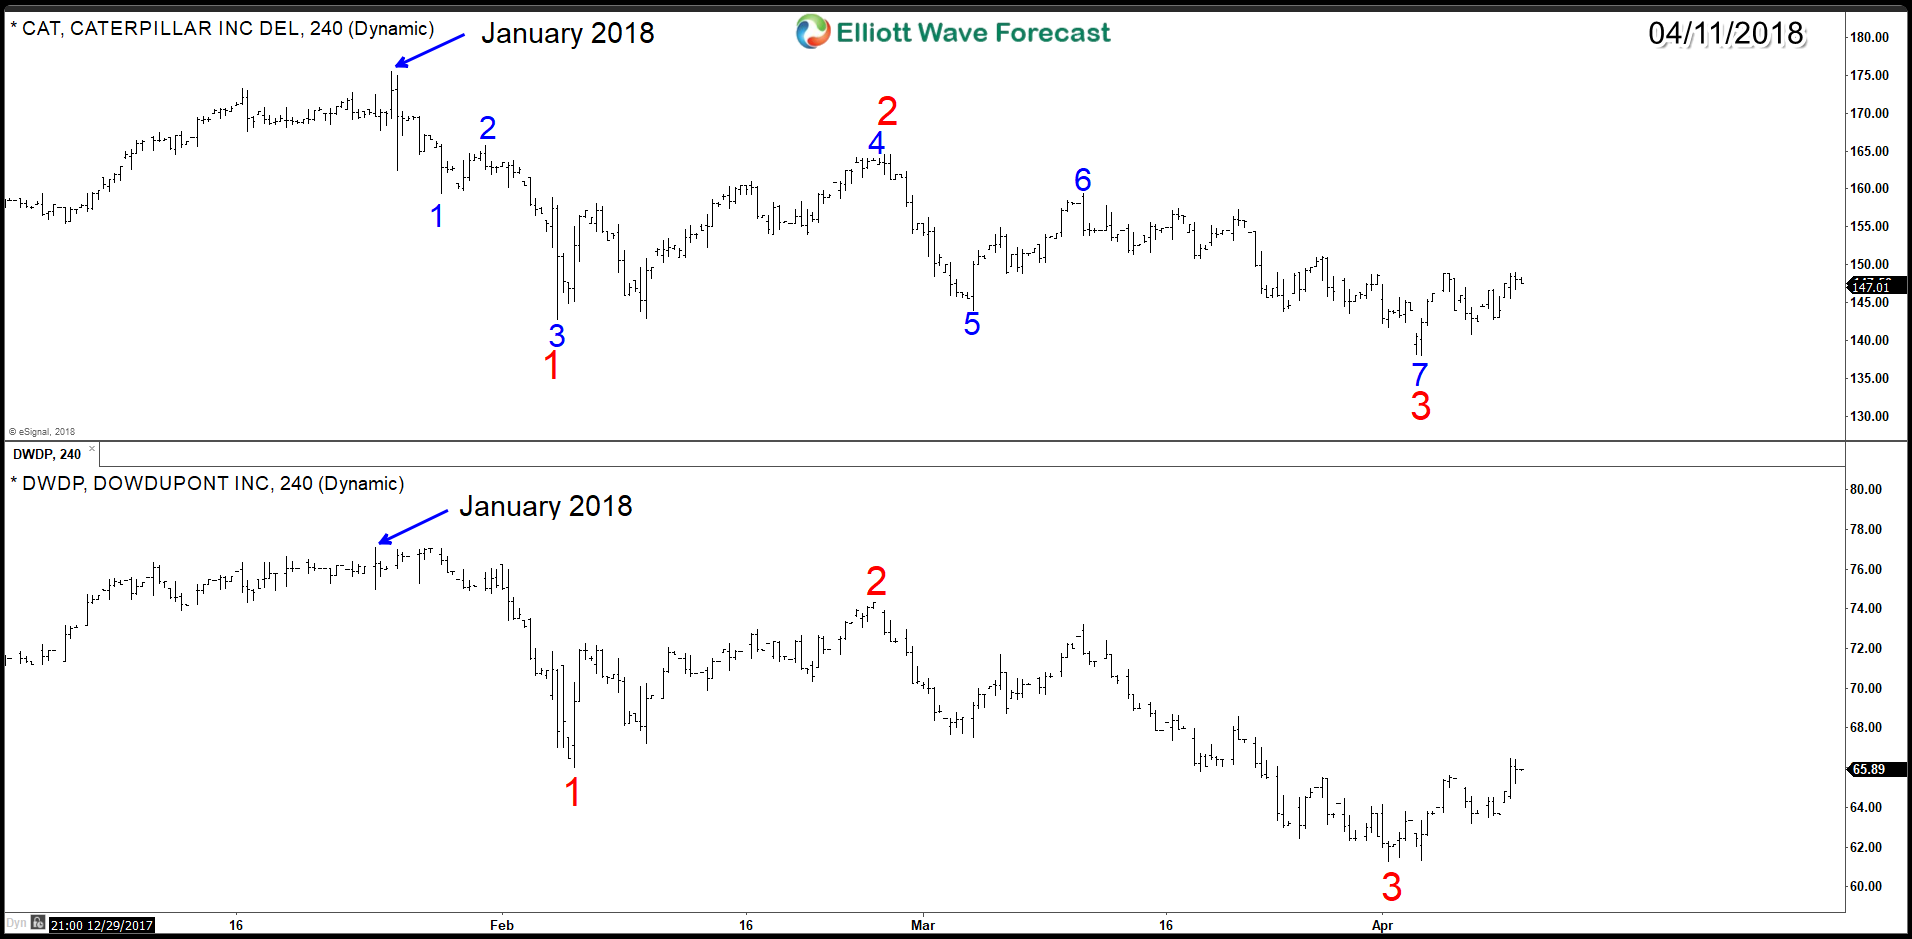
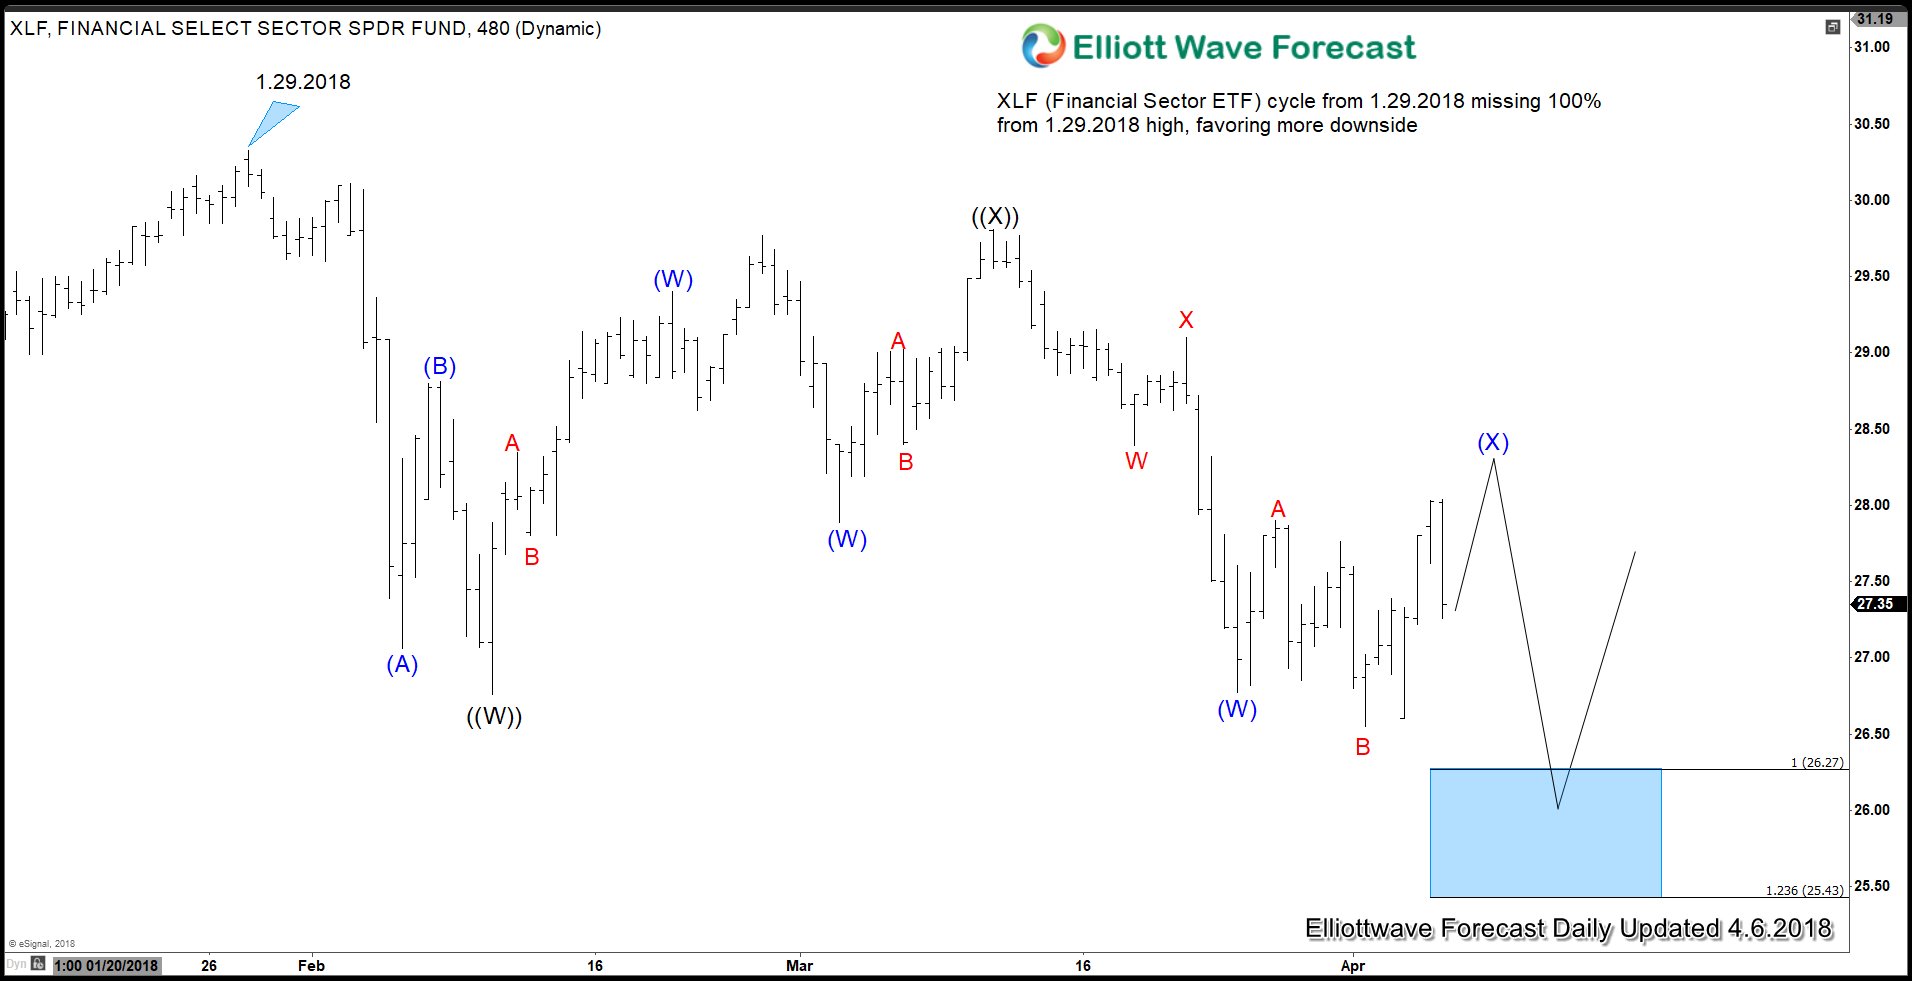
Stocks Short Term Elliott Wave Bounce is Purely Technical
Read MoreStocks and ETFs follow the same code in the market same as the rest of financial instruments like Forex. Every 5 waves impulsive structure is followed by a technical corrective sequences which come in 3-7-11. At the end of the corrective sequence, usually the instrument will resume the move within the main trend or at least correct […]
-
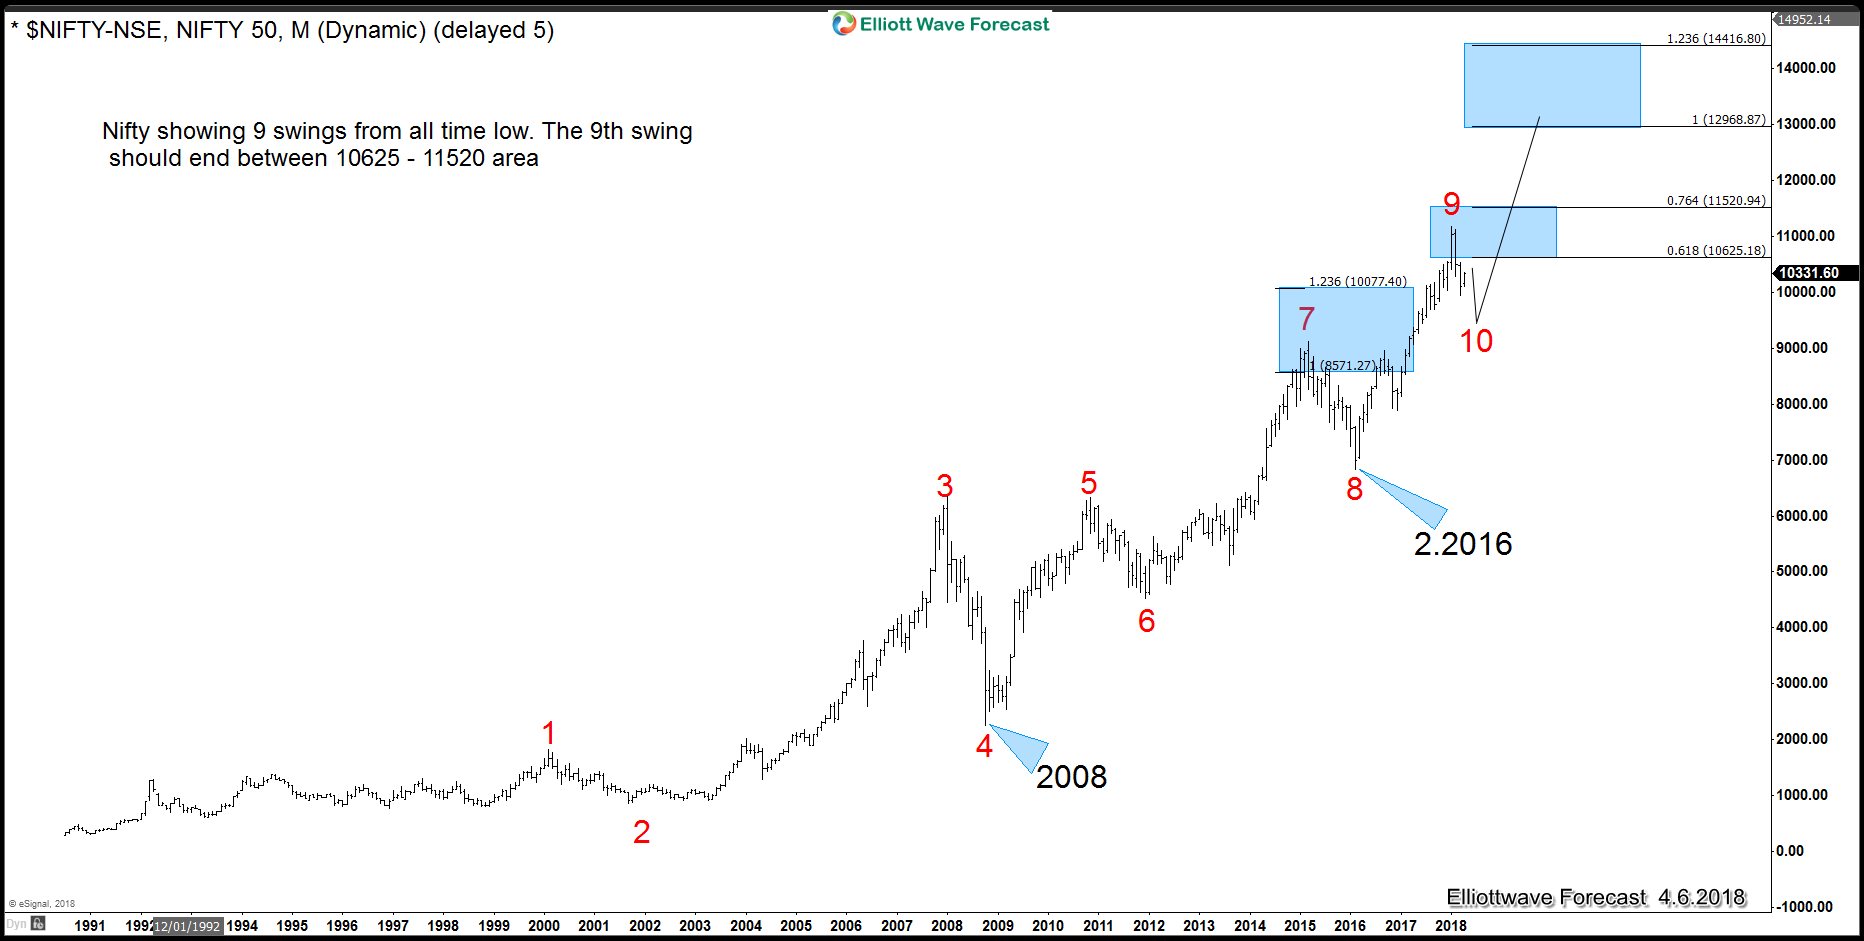
Nifty 50 Index Bullish Sequence to the All Time Highs
Read MoreThe Nifty 50 Index has a bullish sequence from the lows to the all time highs. The index currently shows nine swings up from the all time lows into the 2018 highs. It is now correcting the cycle higher from the February 2016 lows. This is noted on the chart with the red 8 label. In […]
-
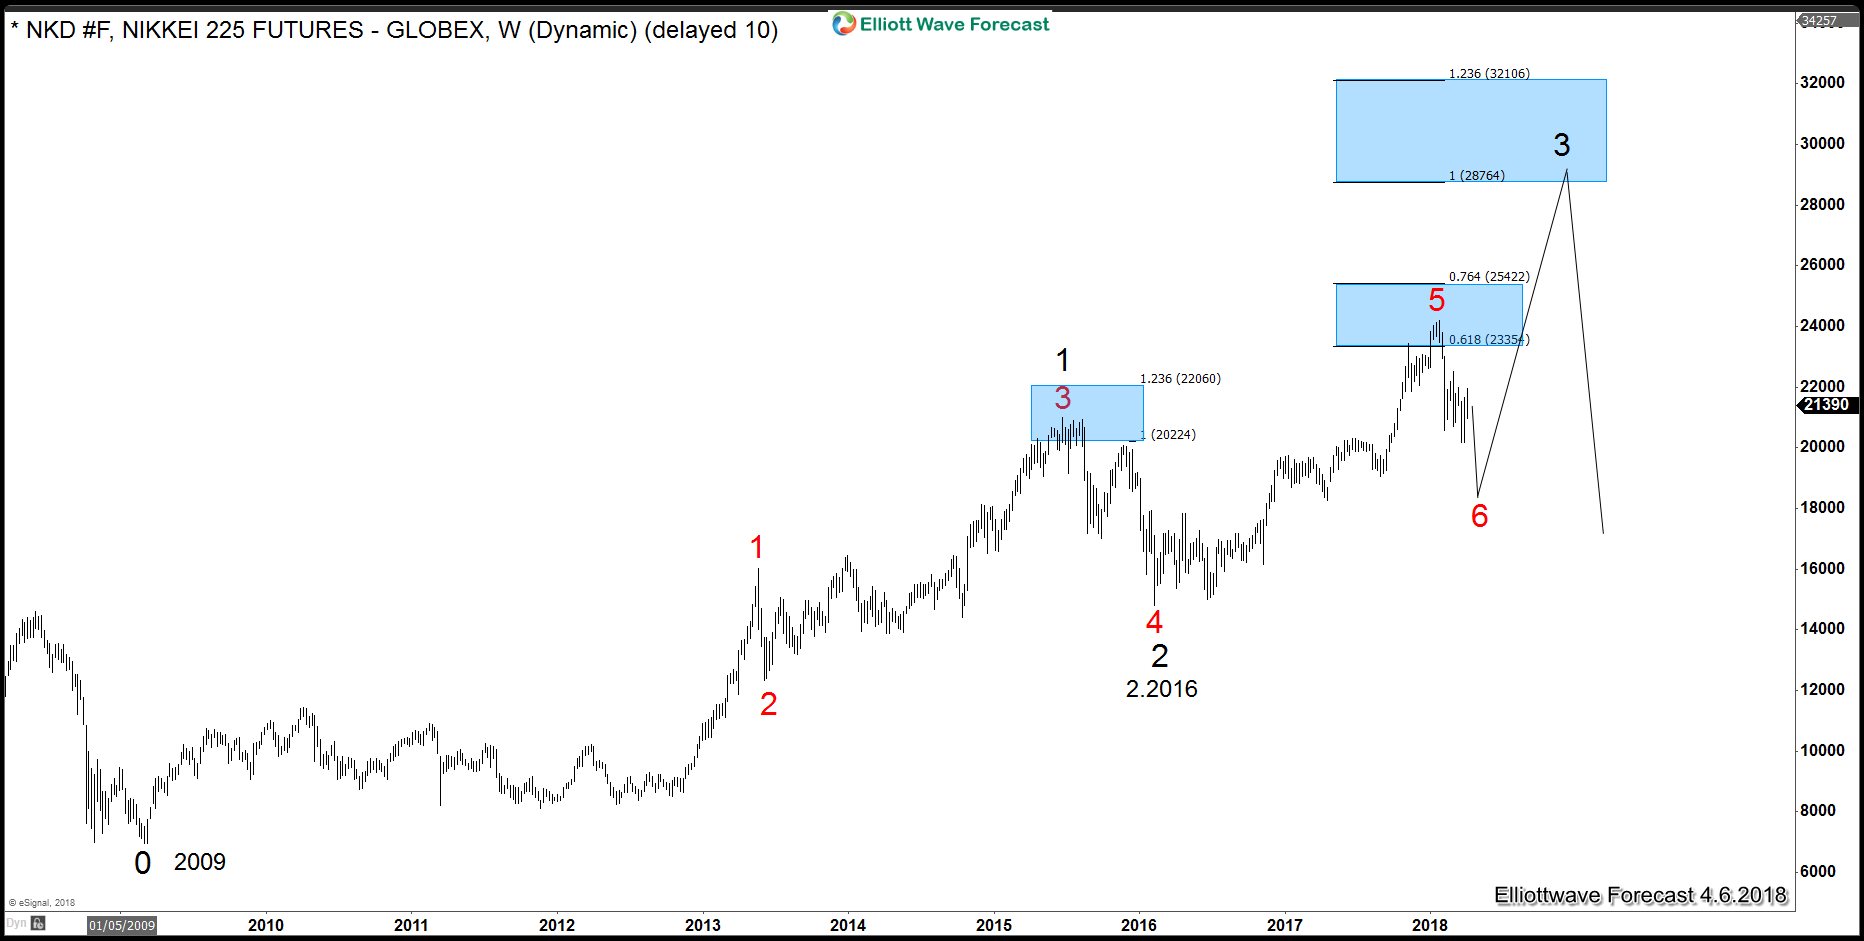
Indices Larger pullback from the Highs is Purely Technical
Read MoreThe Indices larger pullback from the highs is purely technical despite whatever fundamental or reason the news suggests. I will show the technical reasoning in this article. We will look at the Nikkei, FTSE, as well as the Hang Seng indices cycles up from the 2009 and 2008 lows. Each of these indices are shown […]
-
Trade War Uncertainty Limits Market Strength
Read MoreEscalation in U.S. and China Trade War On Tuesday, the White House published a list of 1300 Chinese products subject to tariffs with total value of $50 billion. It’s however still subject to a review process which will last through at least May before it takes effect. The U.S. list focuses on high-tech item such […]
-
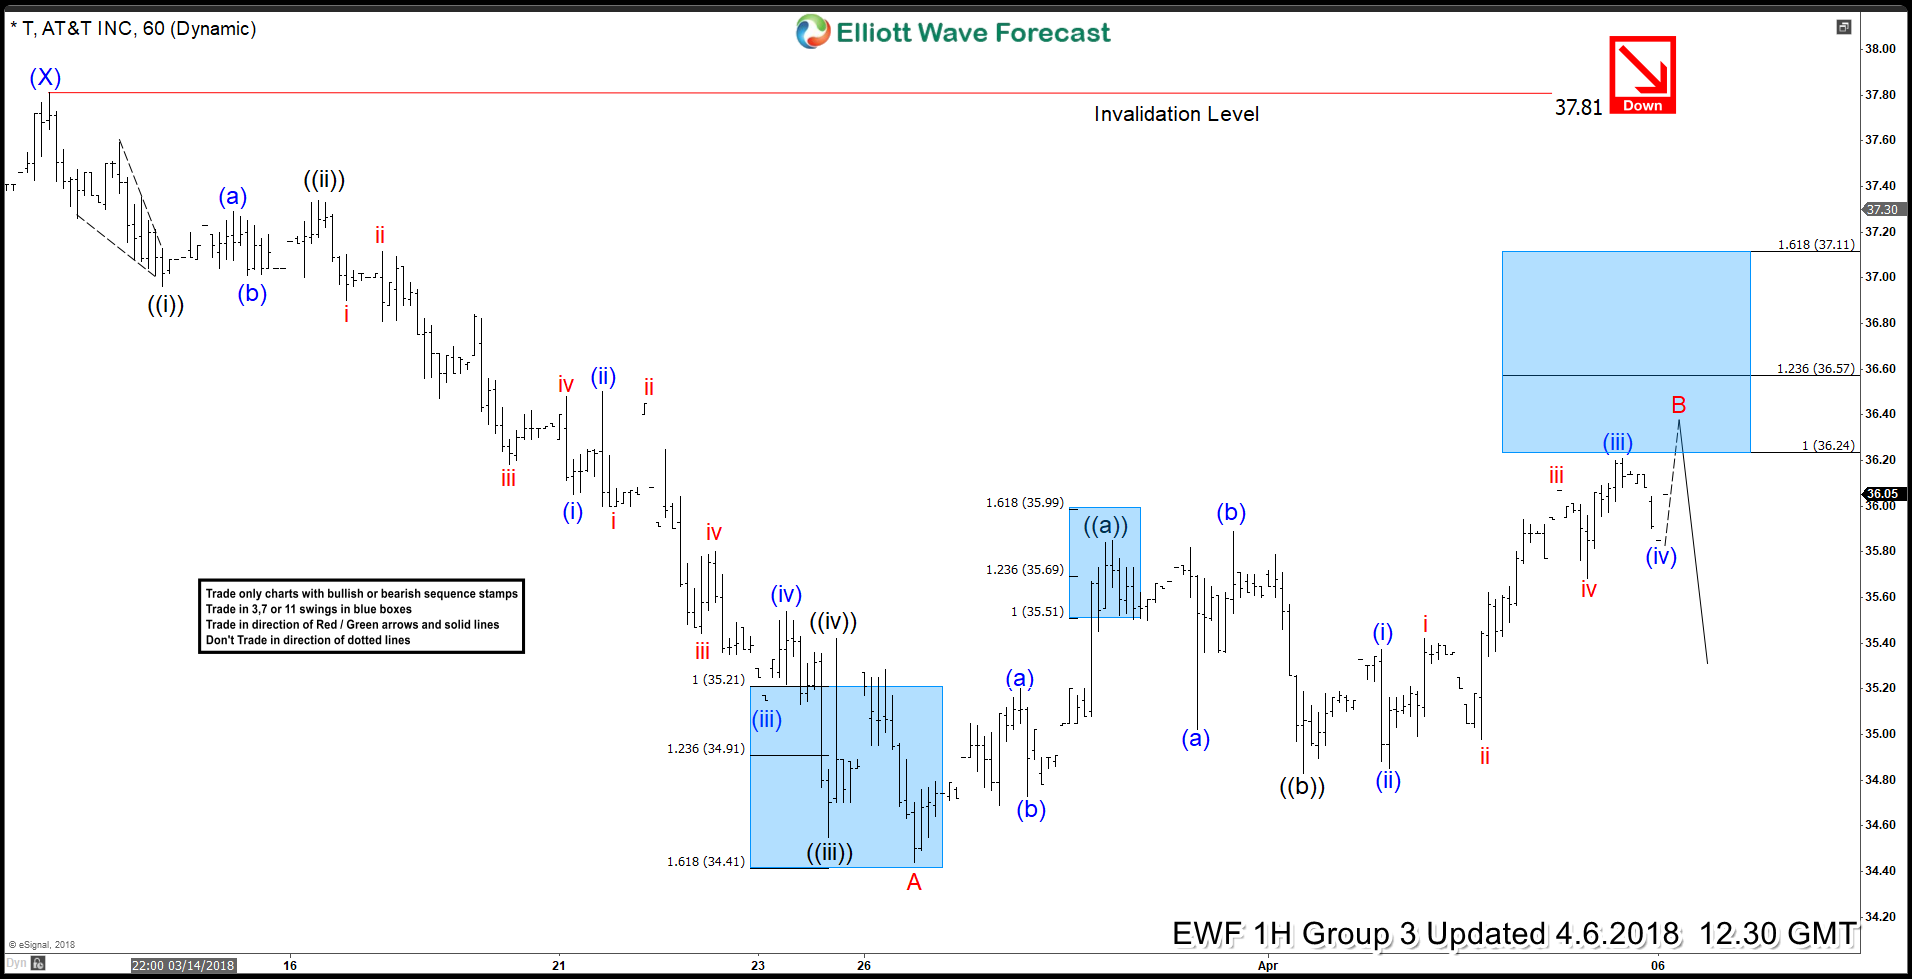
AT&T Elliott Wave View: Calling Bounces to Fail
Read MoreAT&T ticker symbol: ($T) short-term AT&T Elliott Wave view suggests that the bounce to 3/13 high (37.81) ended Intermediate wave (X) bounce. Below from there, intermediate Y leg lower remains in progress as a Zigzag correction. Where initial decline unfolded in 5 waves Elliott Wave Impulse Sequence with extension in Minor wave A. Which can be seen in […]