

The Power of 3-7-11 and the Grand Super Cycle: How We Saw the Bullish Turn in April 2025 Back on April 9, 2025, while World Indices were dropping sharply and global sentiment had turned overwhelmingly bearish, we published an article that challenged the fear-driven narrative. We explained why selling was not the right approach and […]
-
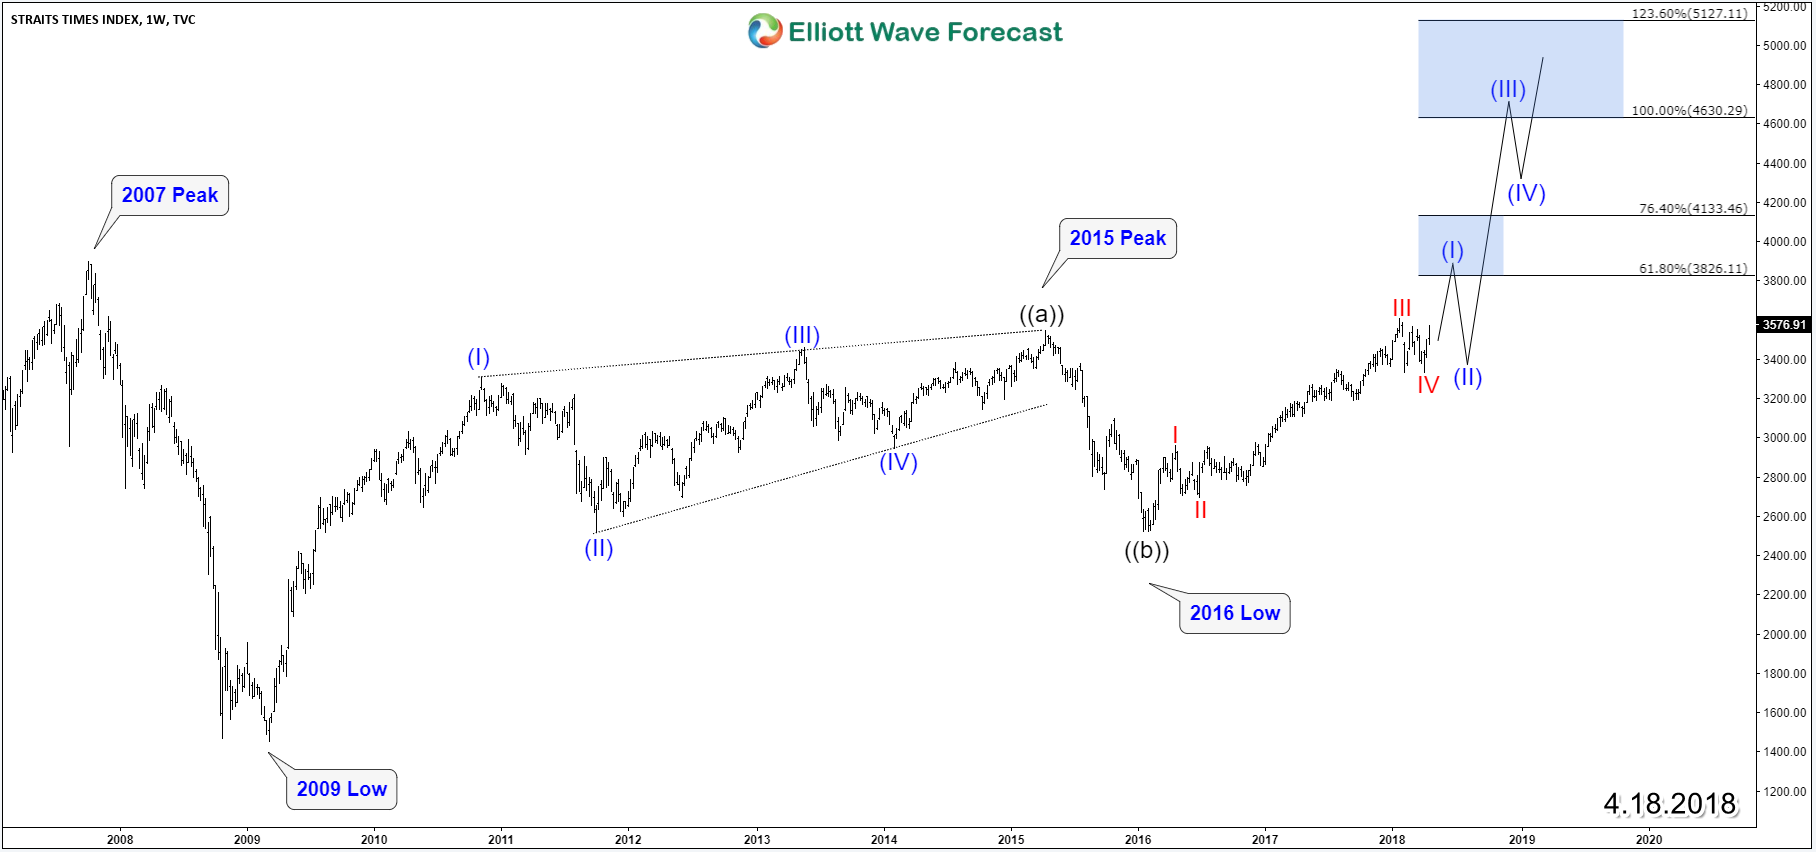
Straits Times Index STI Supporting Stock Market Bulls
Read MoreStraits Times Index (STI) is regarded as the benchmark index for the Singapore stock market. It tracks the performance of the top 30 companies listed on the Singapore Exchange. It is jointly calculated by Singapore Exchange (SGX), Singapore Press Holdings (SPH) and FTSE Group (FTSE). Applying the One Market concept , we know that major world […]
-
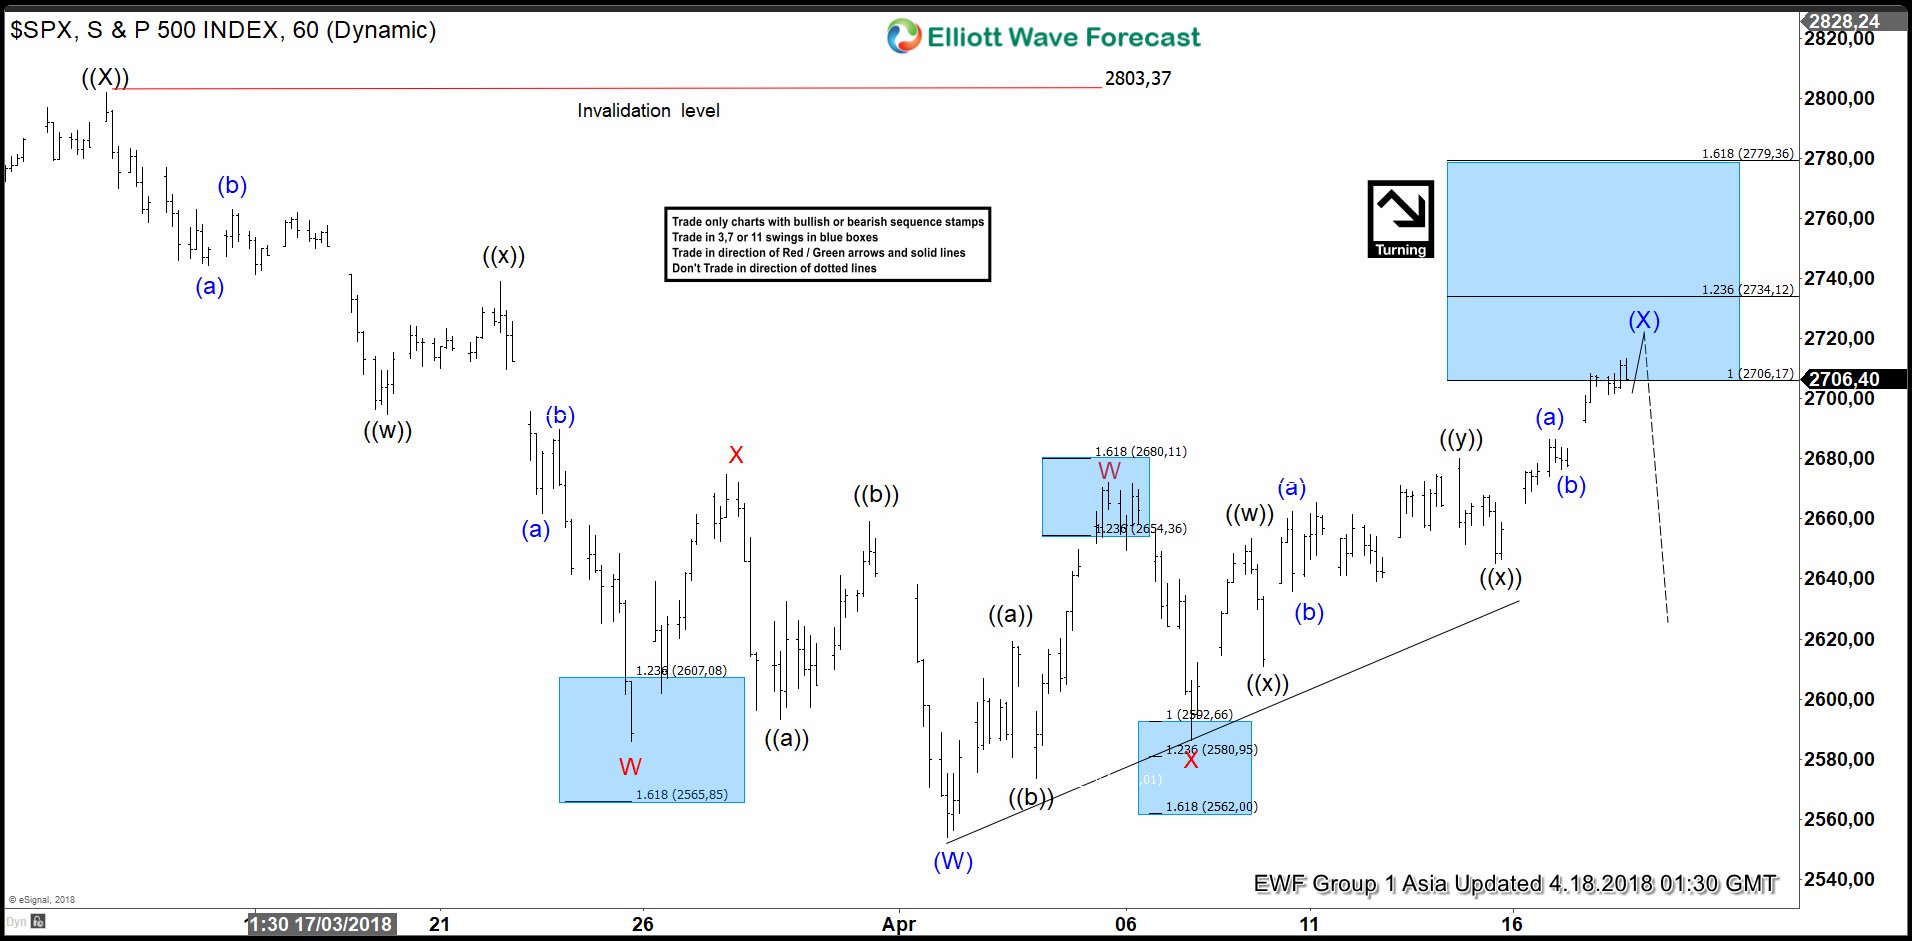
SPX Elliott Wave View: Calling Reaction Lower Soon
Read MoreSPX Elliott Wave view in short-term cycles suggest that the bounce to 3/13 high (2803.37) ended primary wave ((X)). Down from there, primary wave ((Y)) remains in progress as a double three Elliott Wave structure. The internal distribution of wave ((Y)) shows overlapping structure, thus favored it to be a corrective sequence i.e either W.X.Y […]
-
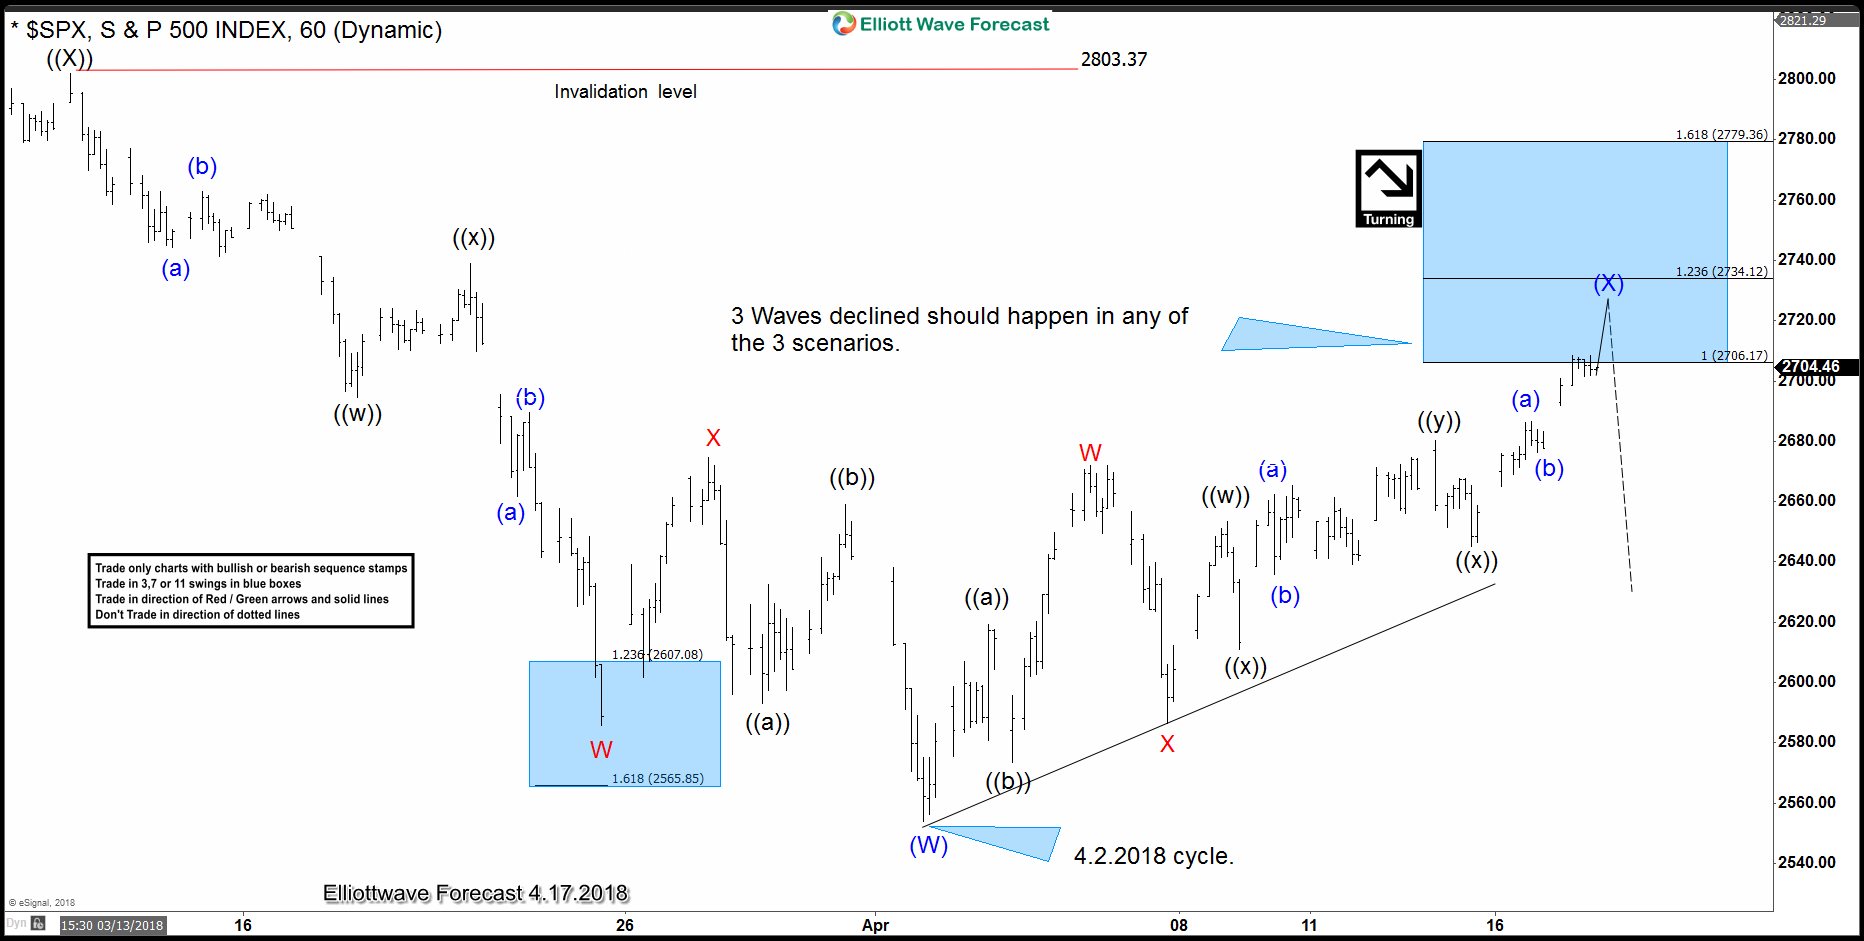
$SPX: The Index Within Areas Where The Hedging Is Calling a Pullback
Read MoreThe $SPX trend is to the upside but the Index ended the cycle from 2.2016 and like every other Index, it is correcting that cycle. In Elliott Wave Theory, corrections run in the sequences of 3-7-11 swings and consequently trading against the main trend which is to the upside is always risky. We do understand […]
-
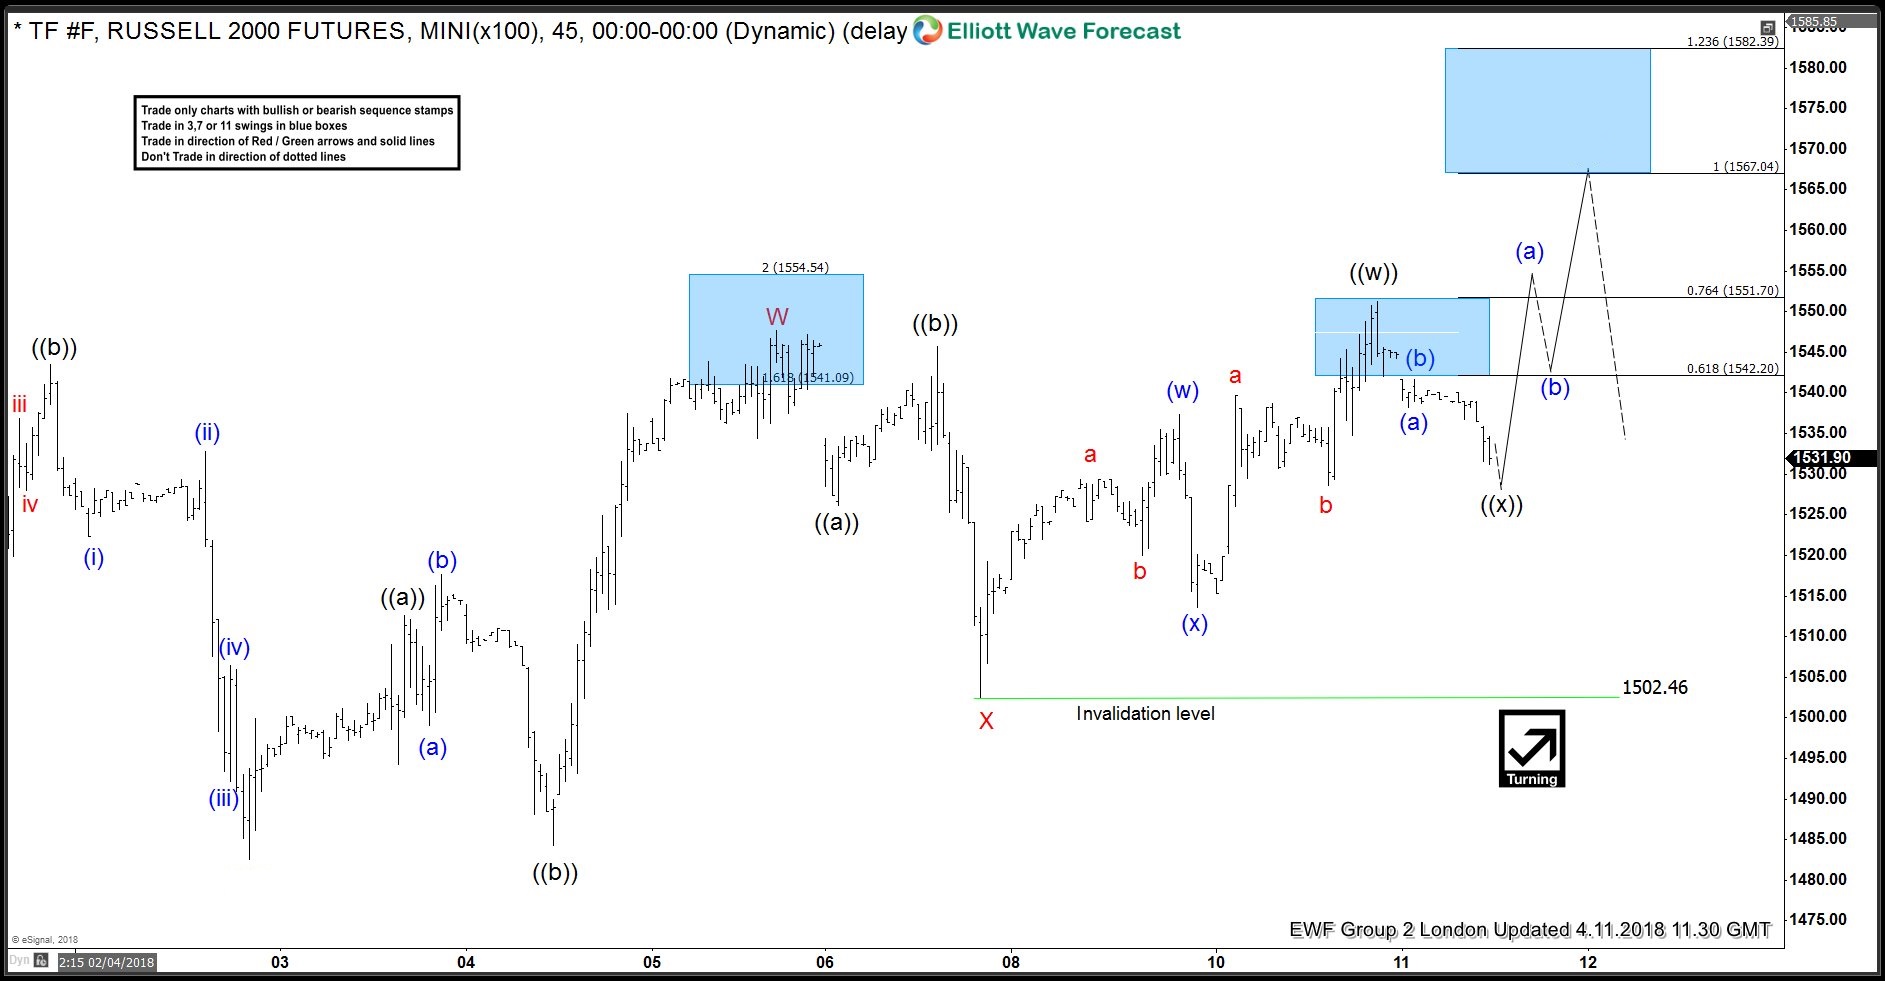
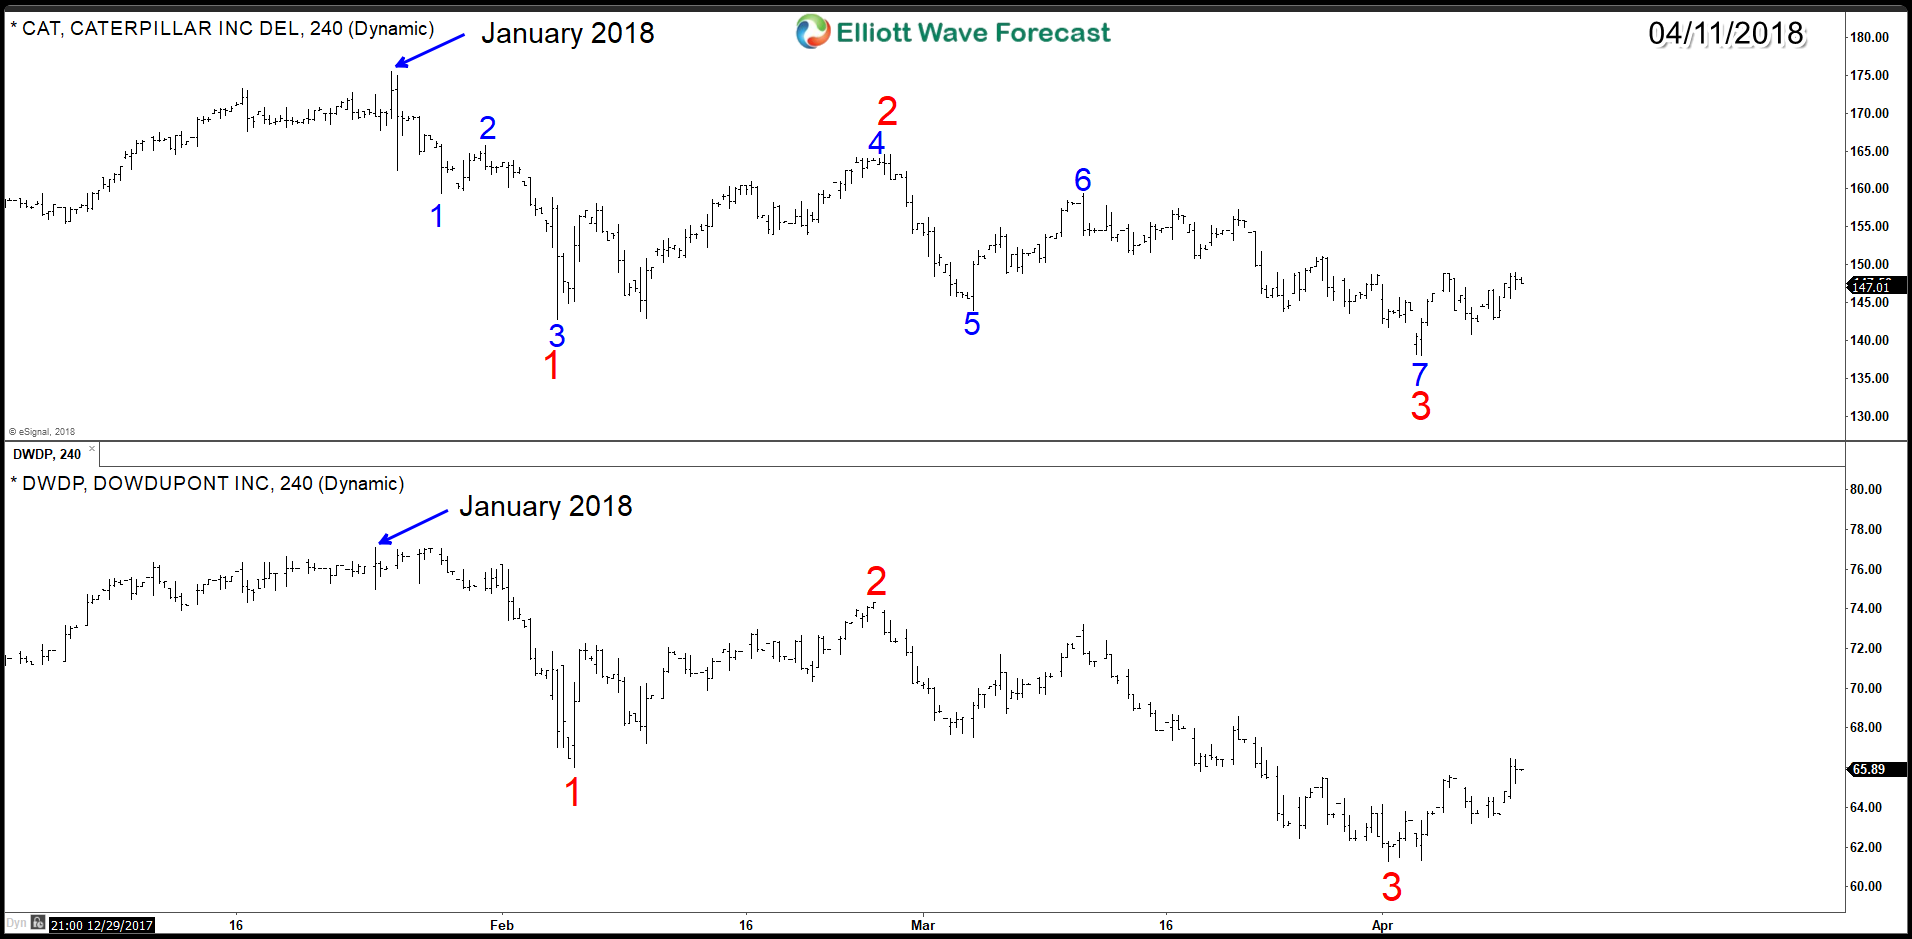
Elliott Wave Analysis: Calling The Double Correction In Russell
Read MoreIn this blog, I will show you some short-term Elliott Wave charts of Russell which we presented to our members in the past. Down below, you see the 1-hour updated chart presented to our clients on the 04/11/18 calling for more upside in a Double Elliott Wave correction in red W-X. Russell ended the cycle from […]
-
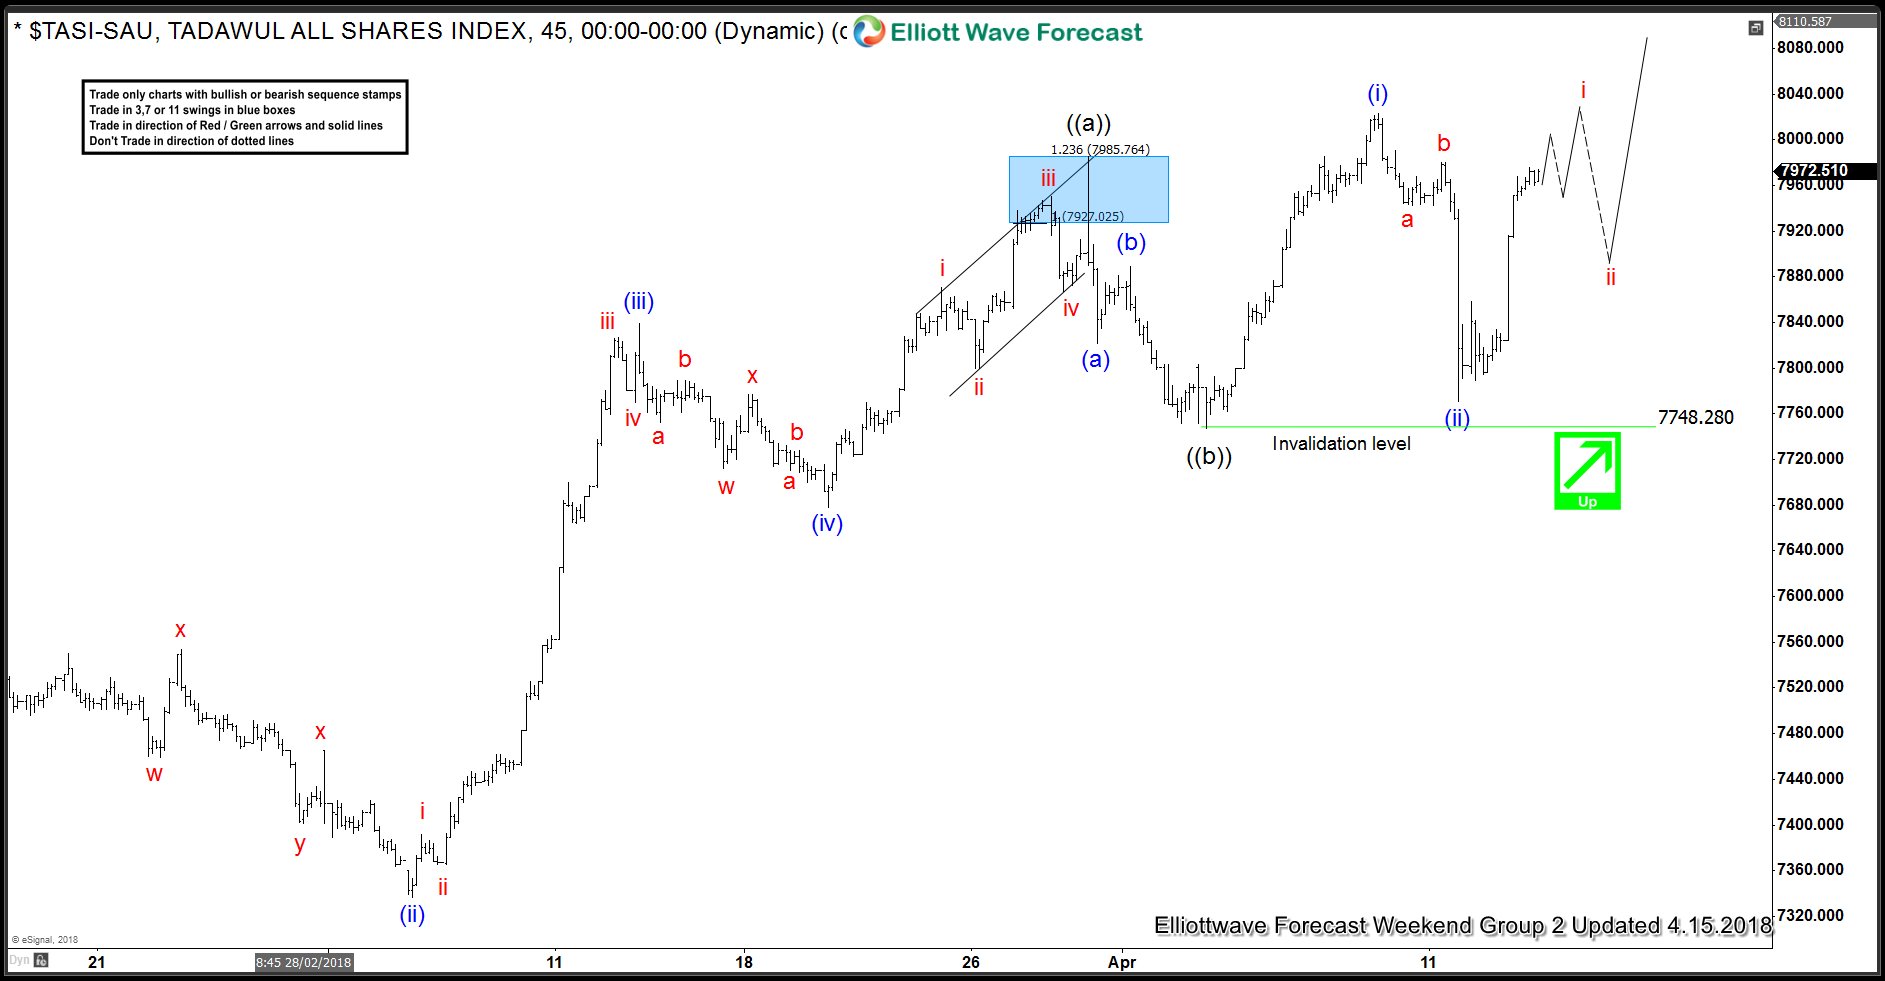
Elliott Wave Analysis: TASI (Tadawul All Shares) Calling Strength Higher
Read MoreTASI (Tadawul All Shares) an index from Saudi Arabia Elliott Wave Analysis suggests that the cycle from 11/21/2017 is showing higher high sequence. Calling for more upside extension towards 8259.82-8484.56 area next before it ends that cycle and starts the pullback. So now let’s take a look at the shorter cycles from February 11.2018 low. Which showed […]
-
Stocks Short Term Elliott Wave Bounce is Purely Technical
Read MoreStocks and ETFs follow the same code in the market same as the rest of financial instruments like Forex. Every 5 waves impulsive structure is followed by a technical corrective sequences which come in 3-7-11. At the end of the corrective sequence, usually the instrument will resume the move within the main trend or at least correct […]