

The Power of 3-7-11 and the Grand Super Cycle: How We Saw the Bullish Turn in April 2025 Back on April 9, 2025, while World Indices were dropping sharply and global sentiment had turned overwhelmingly bearish, we published an article that challenged the fear-driven narrative. We explained why selling was not the right approach and […]
-
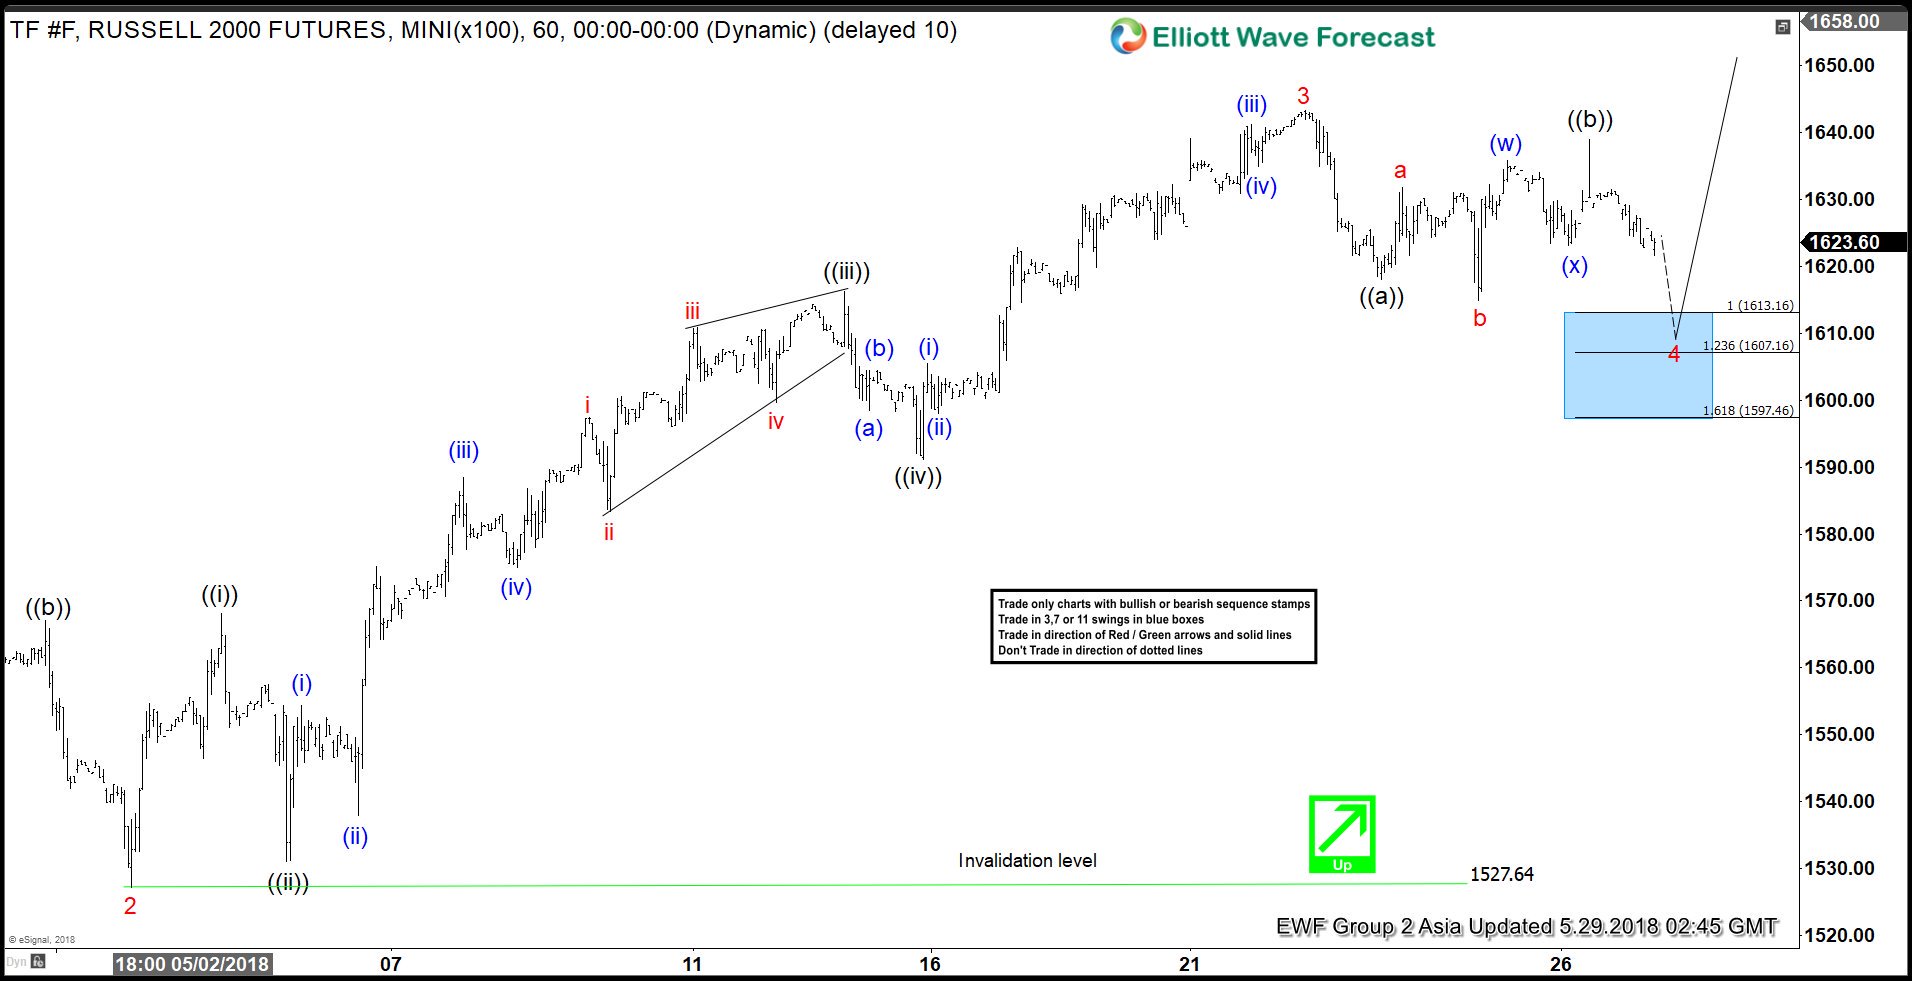
RUSSELL Forecasting The Rally & Buying The Dips
Read MoreHello fellow traders. Another trading opportunity we have had lately is RUSSELL Futures. In this technical blog we’re going to take a quick look at the Elliott Wave charts of RUSSELL published in members area of the website. In further text we’re going to explain the forecast and trading setup. As our members know, RUSSELL […]
-
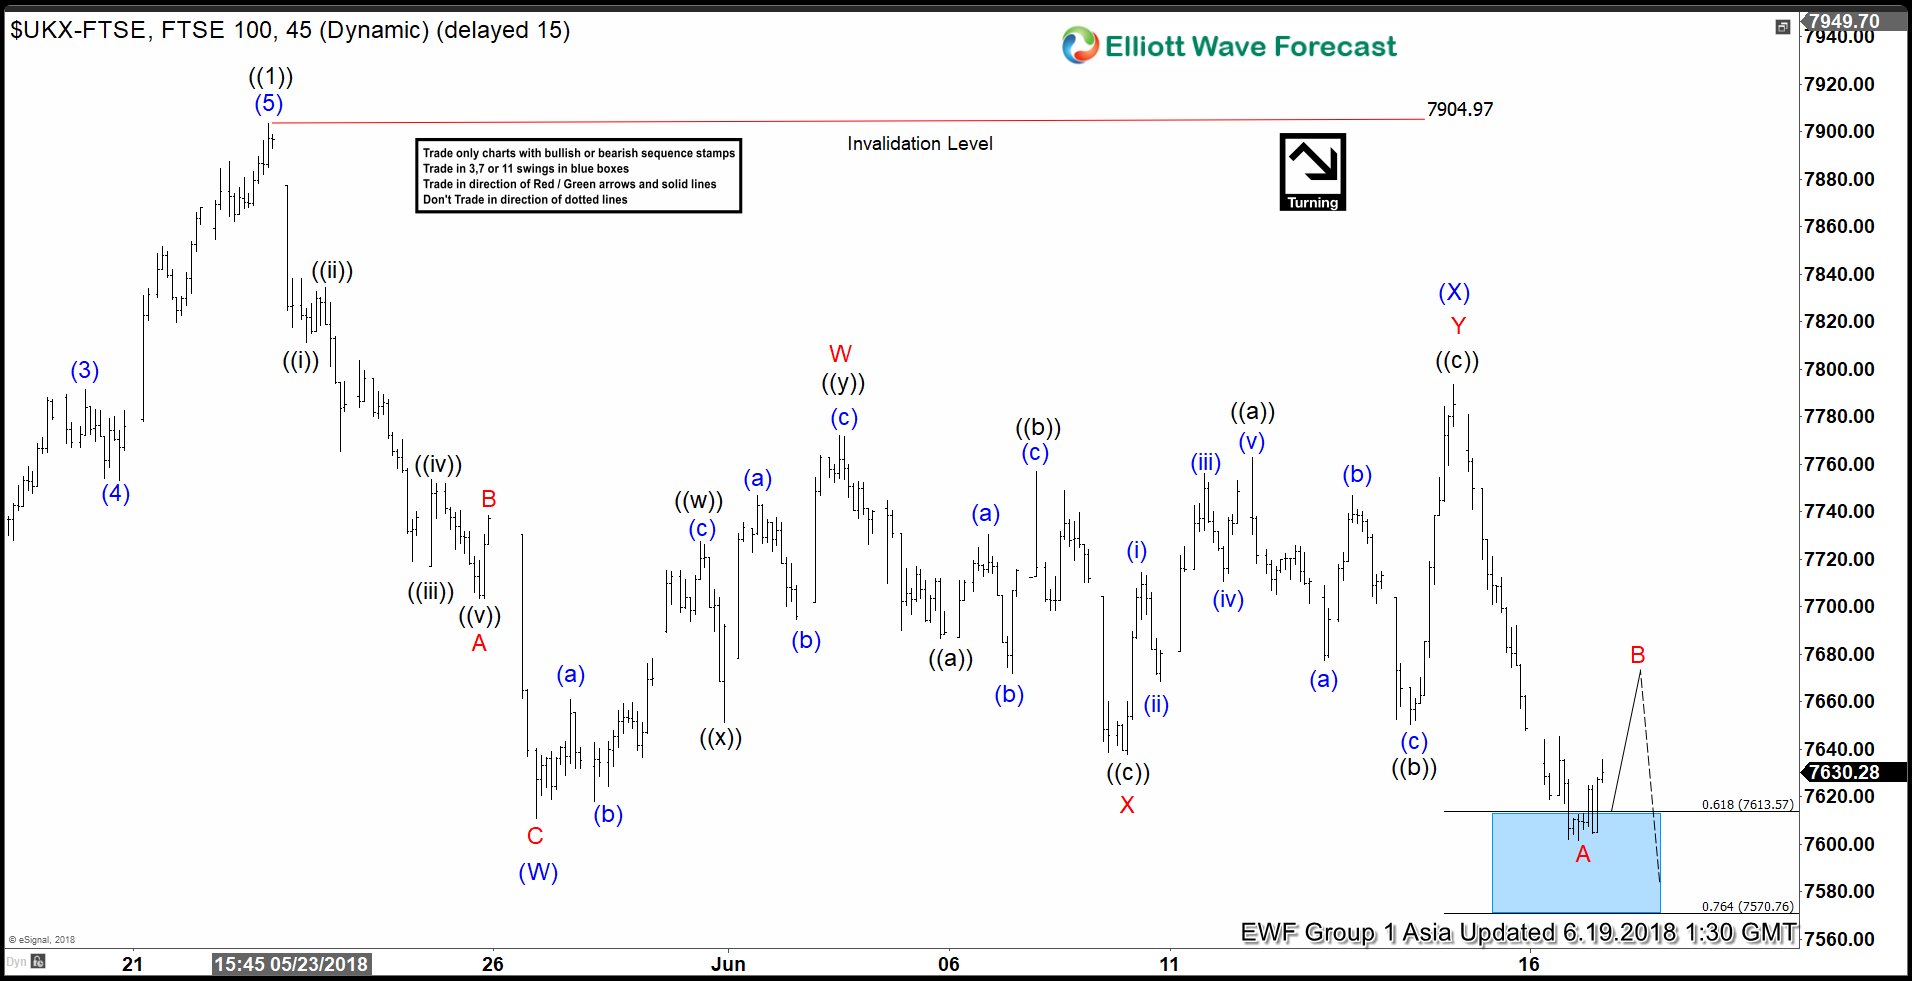
FTSE Elliott Wave View: Calling For Another Leg Lower
Read MoreFTSE short-term Elliott Wave view suggests that the bounce to 7904.97 high on 5/22/2018 peak ended primary wave ((1)). Below from there, the index is doing a pullback in Primary wave ((2)) in 3, 7 or 11 swings to correct cycle from 3/23/2018 low. Down from 7904.97 high, the decline to 7610.66 low ended the first leg […]
-
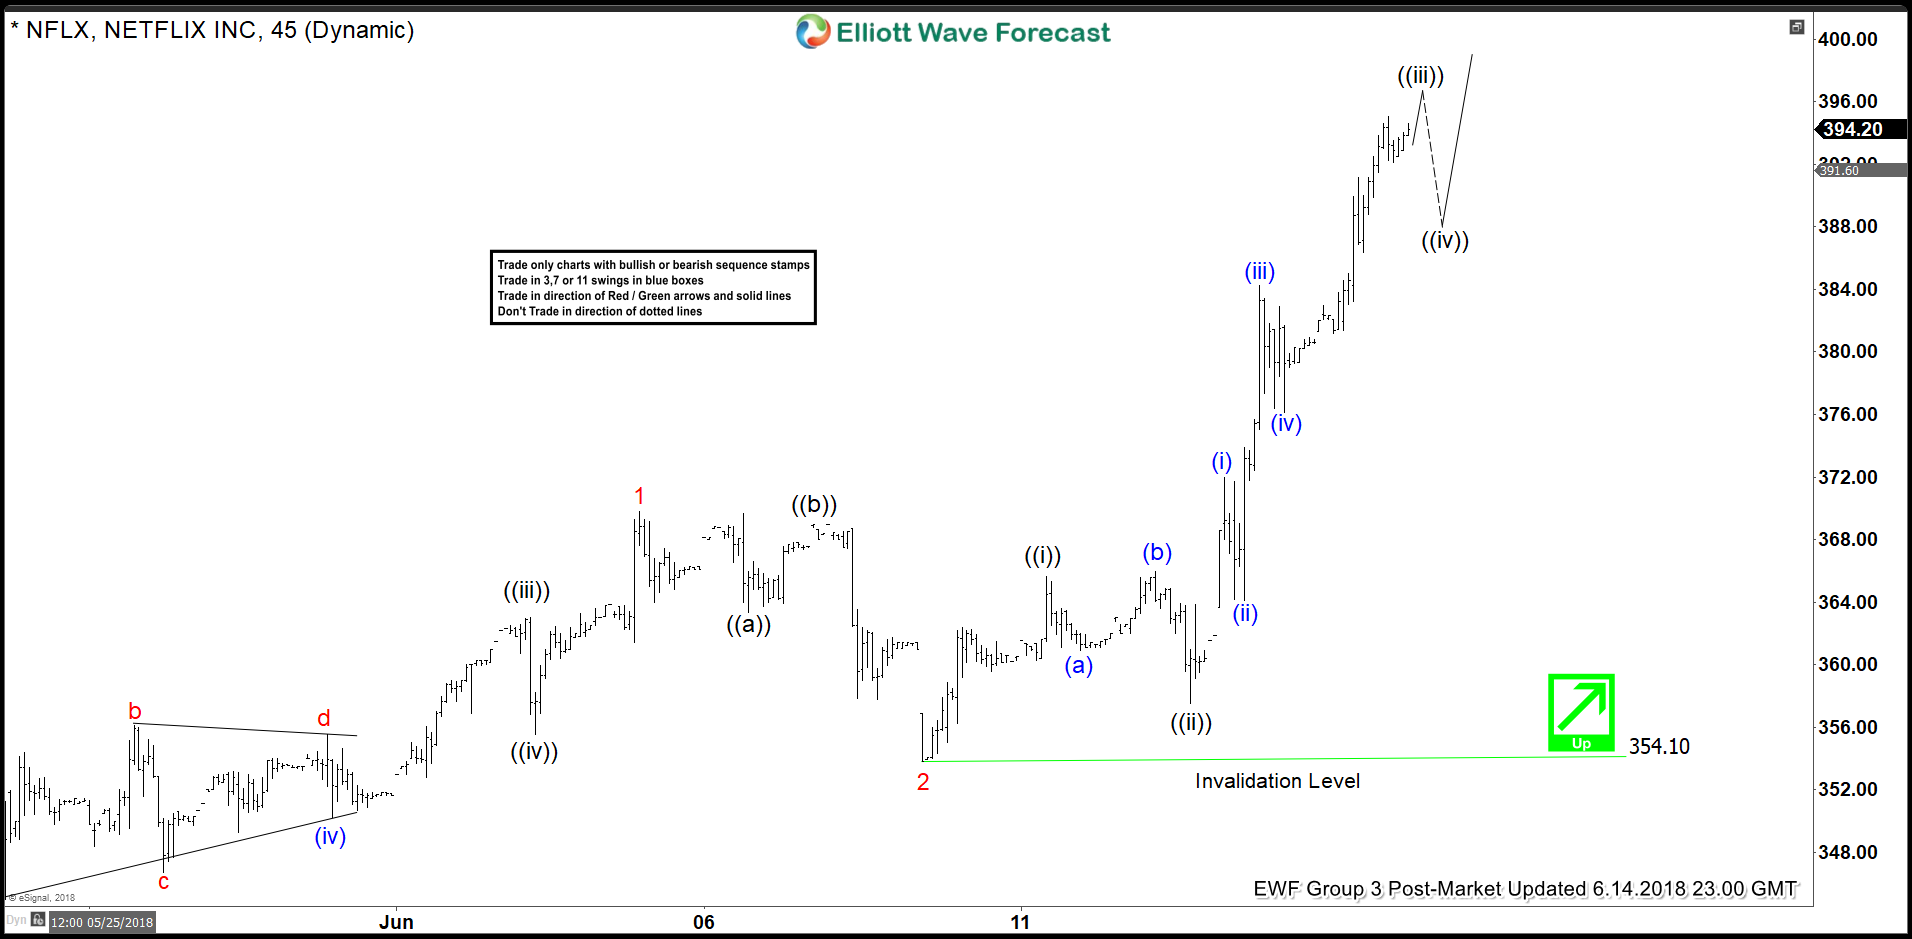
Netflix Elliott Wave View: More Strength is Expected
Read MoreNetflix ticker symbol: $NFLX short-term Elliott wave view suggests that the rally to $369.83 high on 6/05/2018 ended Minor wave 1. The internals of that rally unfolded as Elliott wave impulse structure with lesser degree 5 waves structure in Minute wave ((i)), ((iii)), and ((v)). Below from $369.83, the decline to $354.10 low on 6/08/2018 […]
-
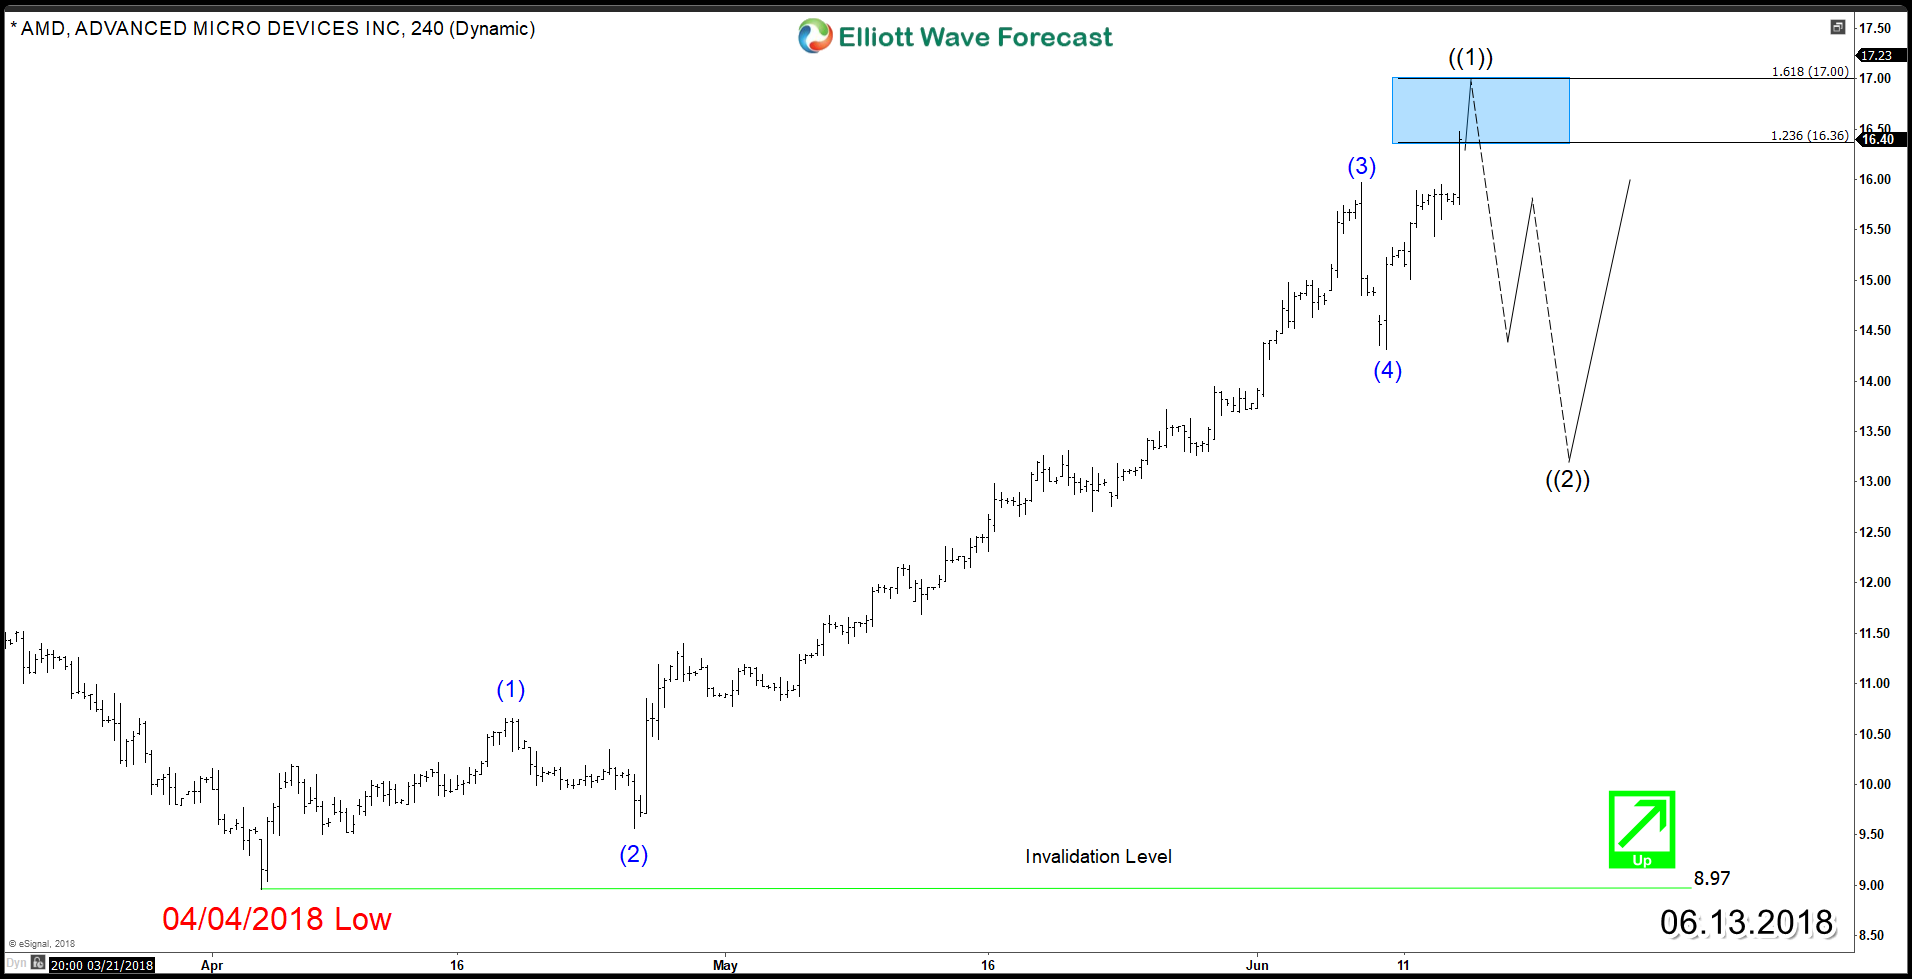
AMD Elliott Wave Bullish structure suggesting more upside
Read MoreSince 2017 peak, Advanced Micro Devices (AMD: NASDAQ) has been lagging the move higher compared to its competitors. Despite a weak start of 2018 around the stock market, AMD managed to recover strongly since the 4th of April. The semiconductor stock, starred a strong rally showing an impulsive 5 waves structure to the upside as […]
-
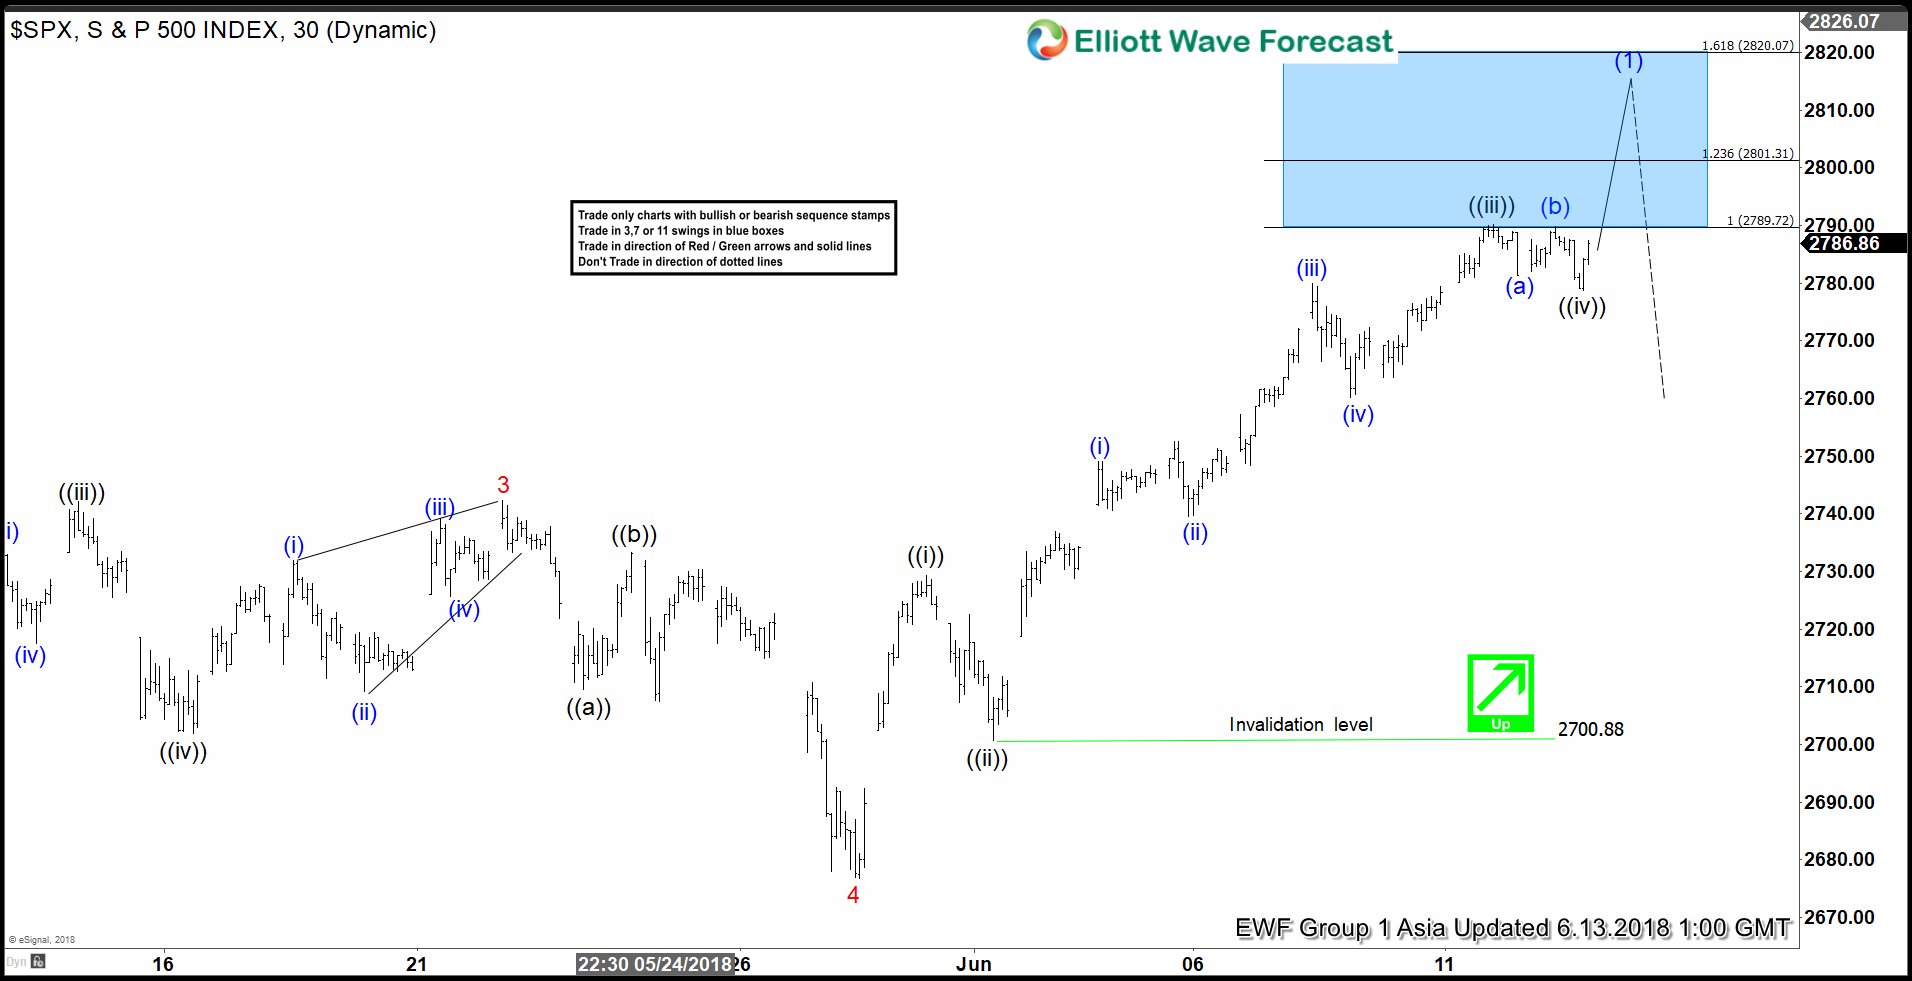
Intraday Elliott Wave Analysis: SPX Due for Pullback Soon
Read MoreSPX short-term Elliott wave view suggests that the rally to 2742.24 high ended Minor wave 3 as Elliott wave impulse. Below from there the pullback to 2676.81 on 5/29/2018 low ended Minor wave 4 as Zigzag structure. Up from there, Minor wave 5 rally is unfolding as impulse Elliott wave structure with extension in 3rd wave […]
-
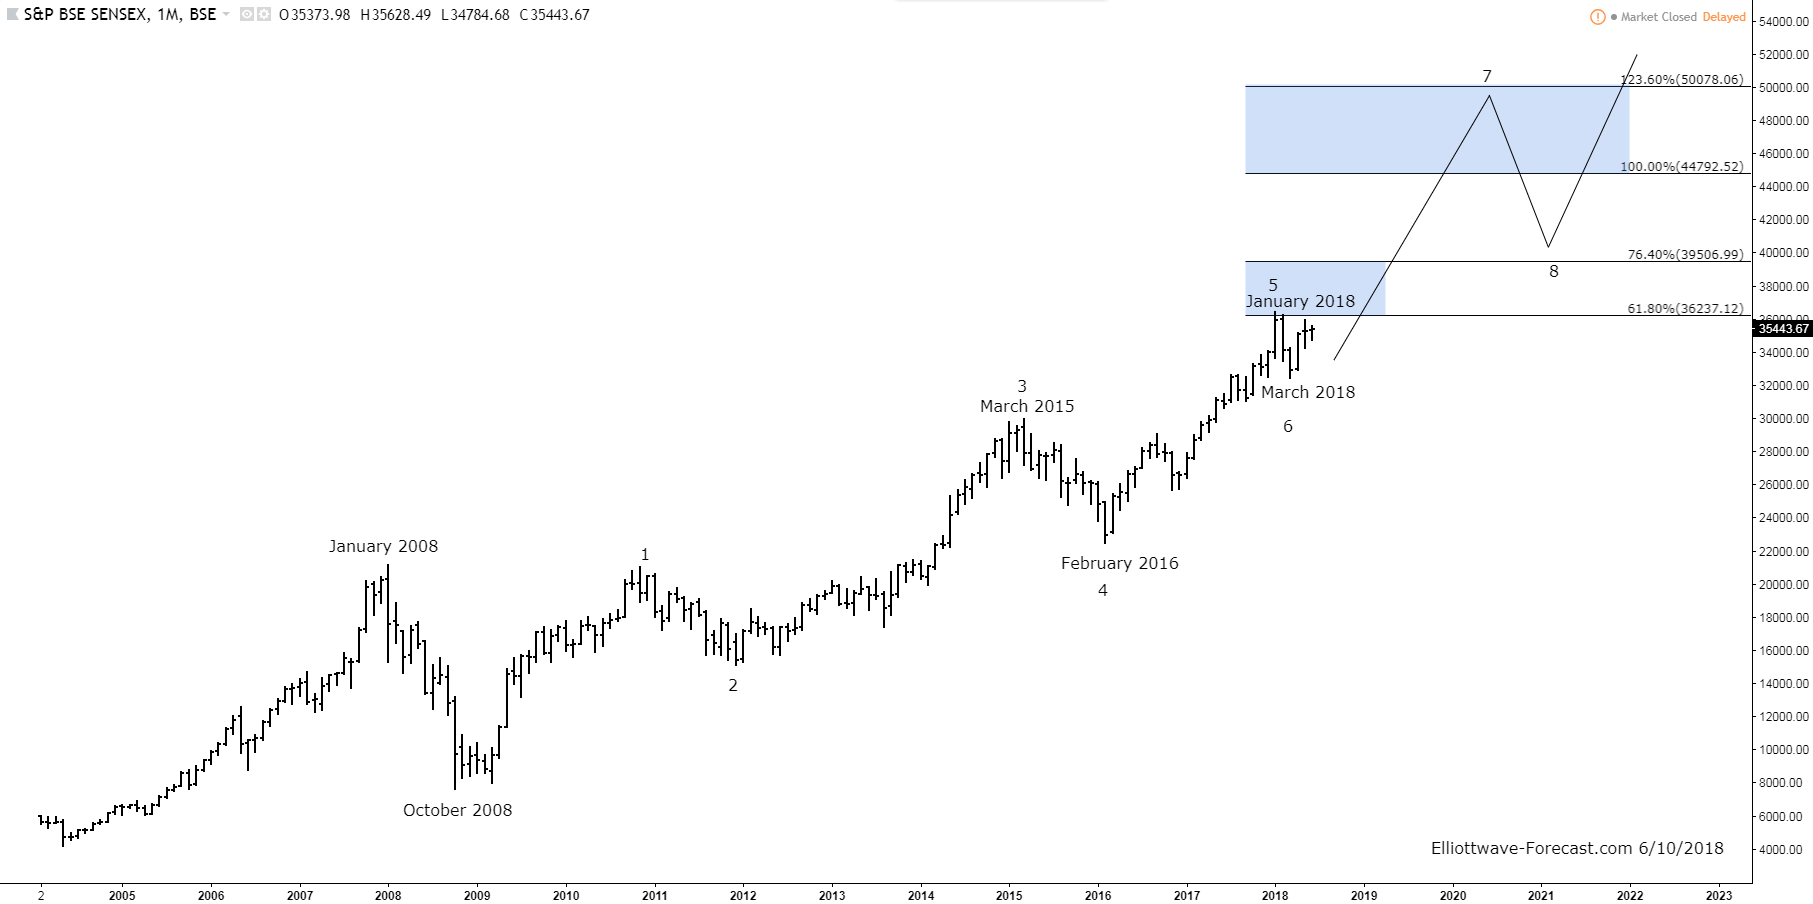
The Sensex Index Long Term Bullish Cycles
Read MoreThe Sensex Index Long Term Bullish Cycles The Sensex Index long term bullish cycles have been trending higher with other world indices. Firstly in it’s base year 1978 to 1979 the index’s point value was set at 100. From there it rallied with other world indices trending higher into the January 2008 highs. It then corrected […]