

The Power of 3-7-11 and the Grand Super Cycle: How We Saw the Bullish Turn in April 2025 Back on April 9, 2025, while World Indices were dropping sharply and global sentiment had turned overwhelmingly bearish, we published an article that challenged the fear-driven narrative. We explained why selling was not the right approach and […]
-
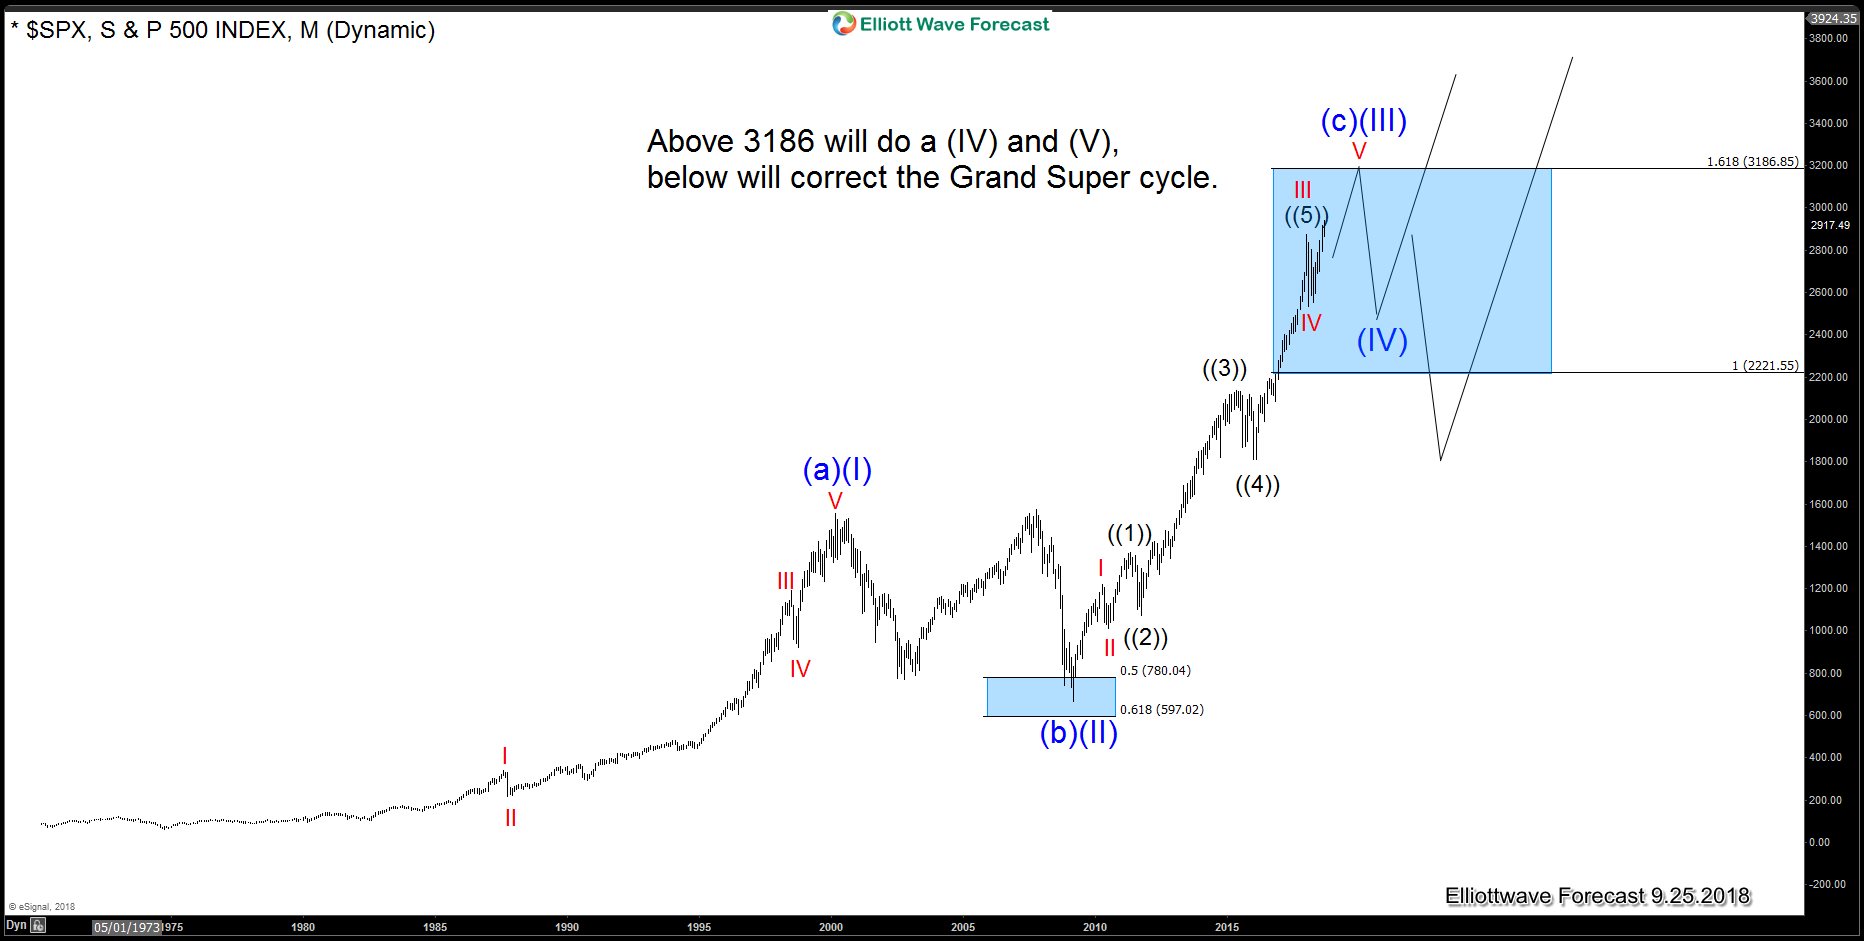
SPX500: The American Election and the Grand Supercycle
Read MoreMany traders and Presidents believe that the Market is a reaction of the agendas and even their own trades. The Reality is that the Market follows cycles, sequences and trades within extensions in both Time and Price. Therefore, we will have a look at the SPX500 monthly chart and some other relevant world indices. We believe […]
-

BAC Elliott Wave View: Ready To Resume Higher?
Read MoreBAC short-term Elliott wave view suggests that the rally to $31.49 low ended Minor wave X bounce. Down from there, the decline to $30.08 low ended Minor wave Y & also completed intermediate wave (2) pullback. The internals of Minor wave Y unfolded as double three structure where Minute wave ((w)) ended at $30.62 low […]
-
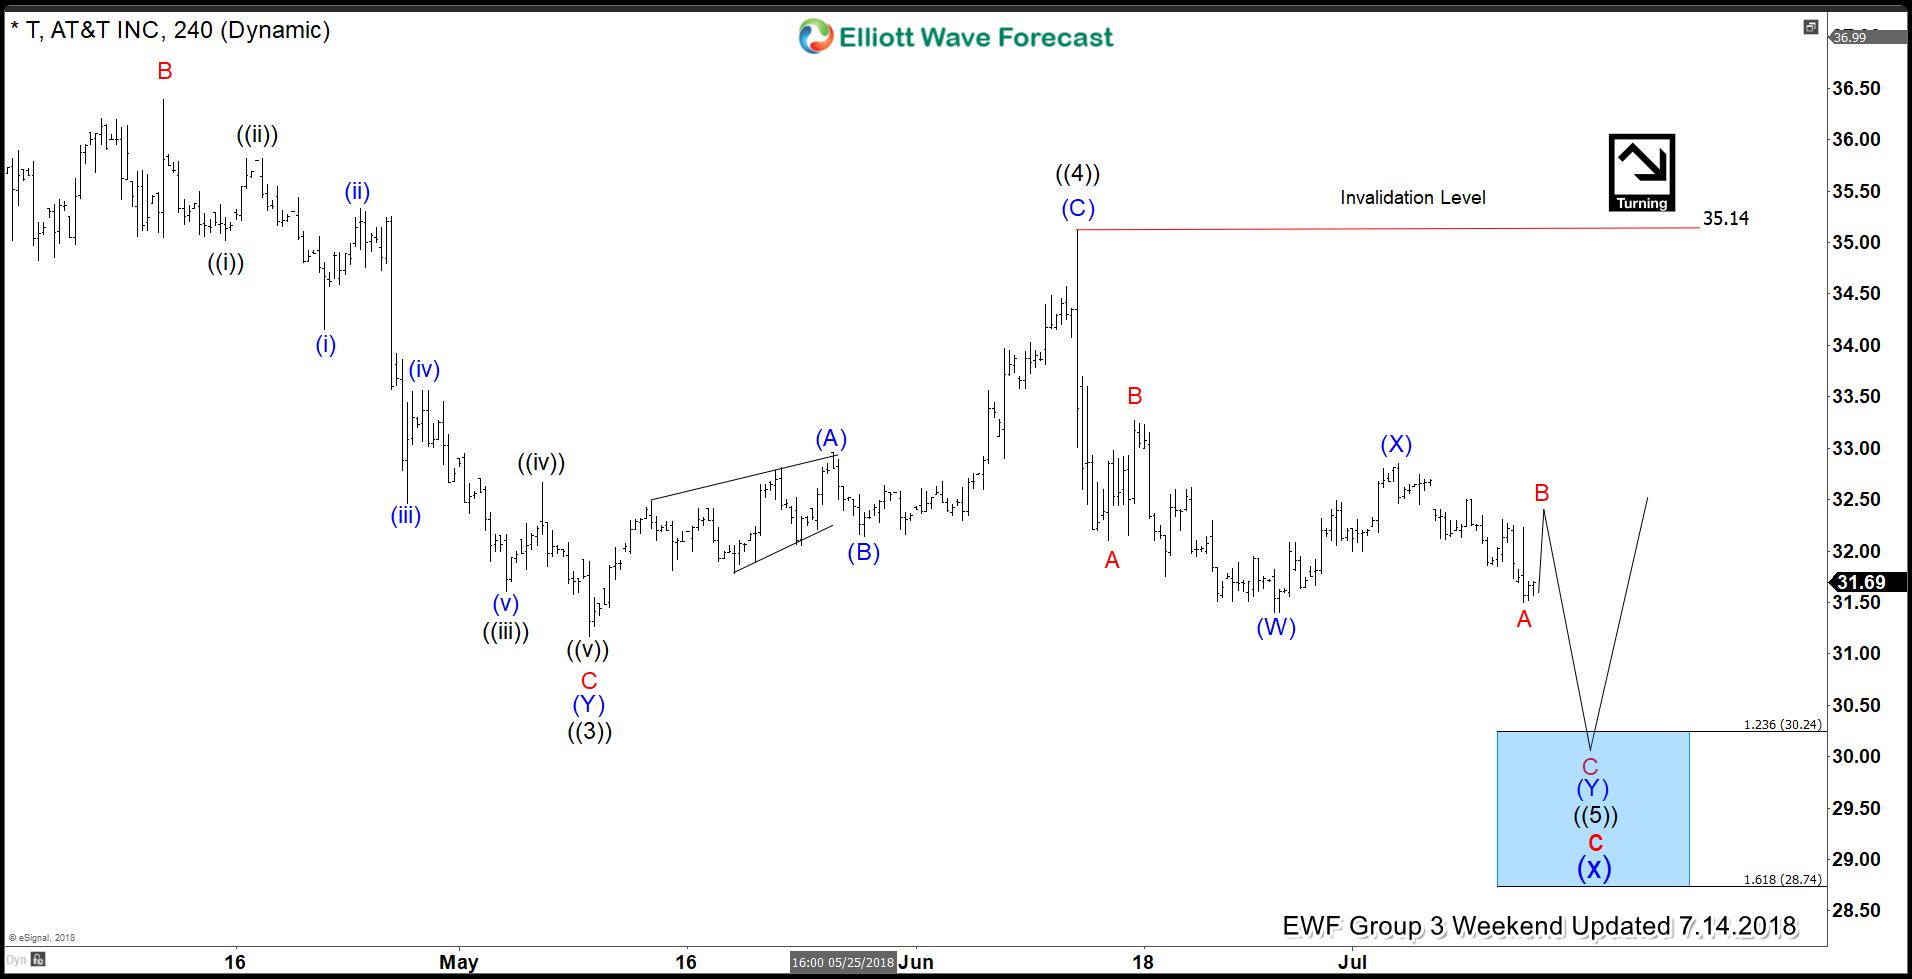
AT&T: Drop and Rally Was Fundamental or Technical?
Read MoreIn this blog, we will take a look at the drop in AT&T in July and how that presented a buying opportunity in the stock which we highlighted on our chart. We also prove that all markets are technical and even when fundamentals news can create short-term volatility in the market, it doesn’t have the […]
-
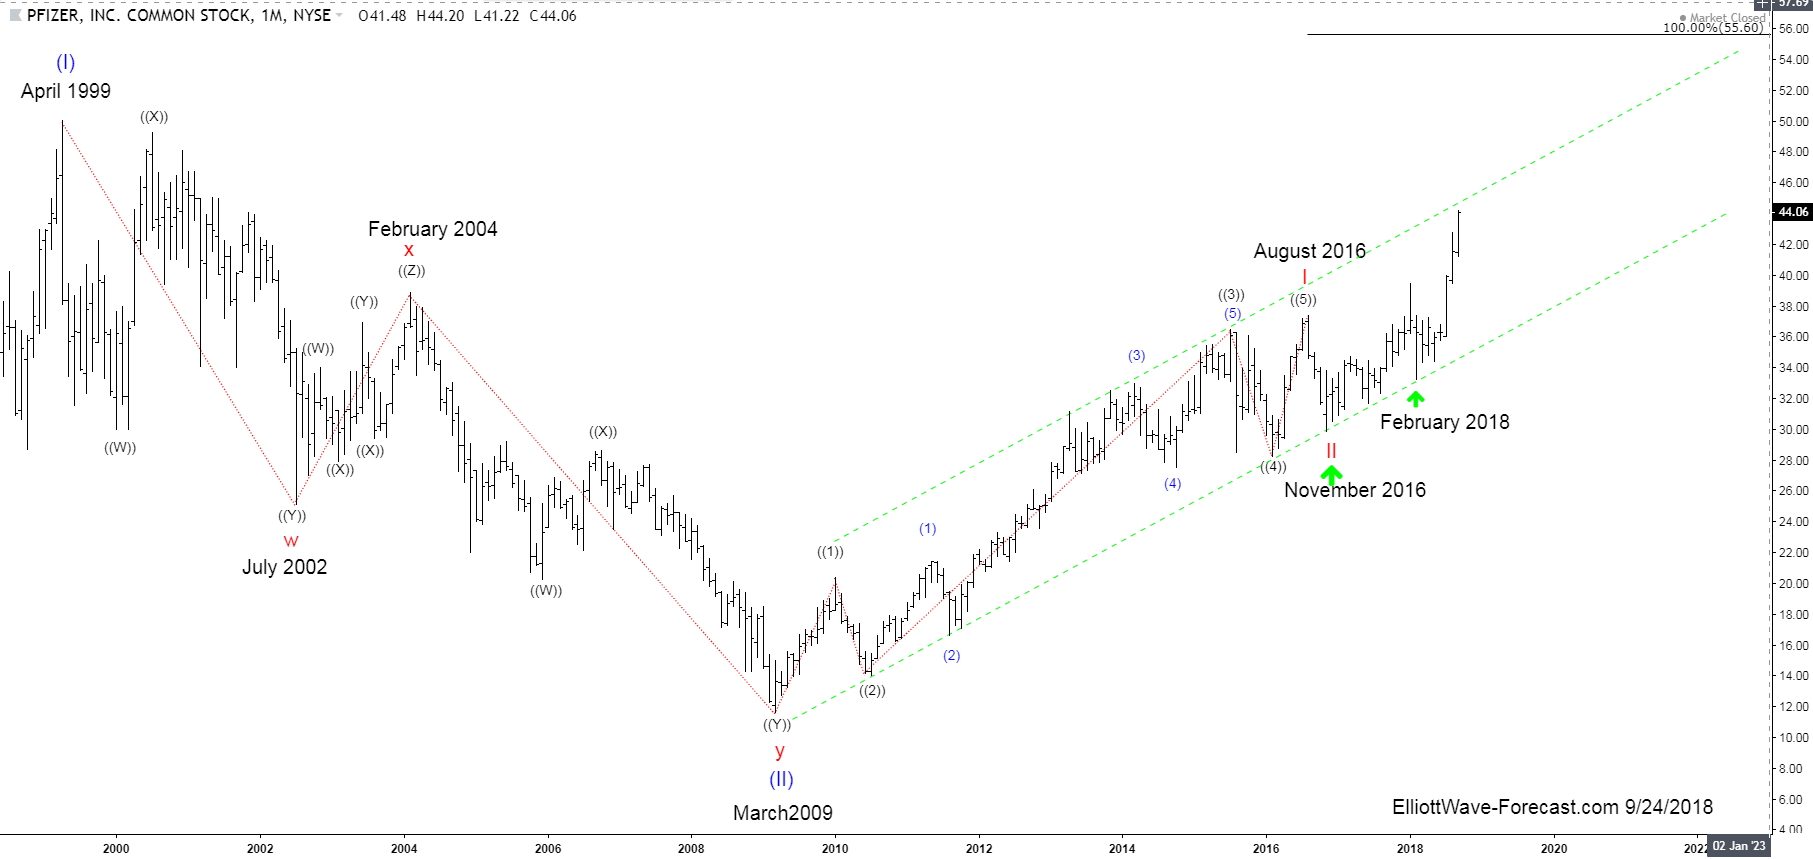
PFIZER Long Term Bullish Trend and Elliott Wave Cycles
Read MorePFIZER Long Term Bullish Trend and Elliott Wave Cycles The PFIZER long term bullish trend and Elliott Wave cycles suggest the stock price will be trending higher. The cycles project it should continue toward the April 1999 highs 50.04 while it is above the February 2018 lows. From the beginning of the stock trading it had […]
-
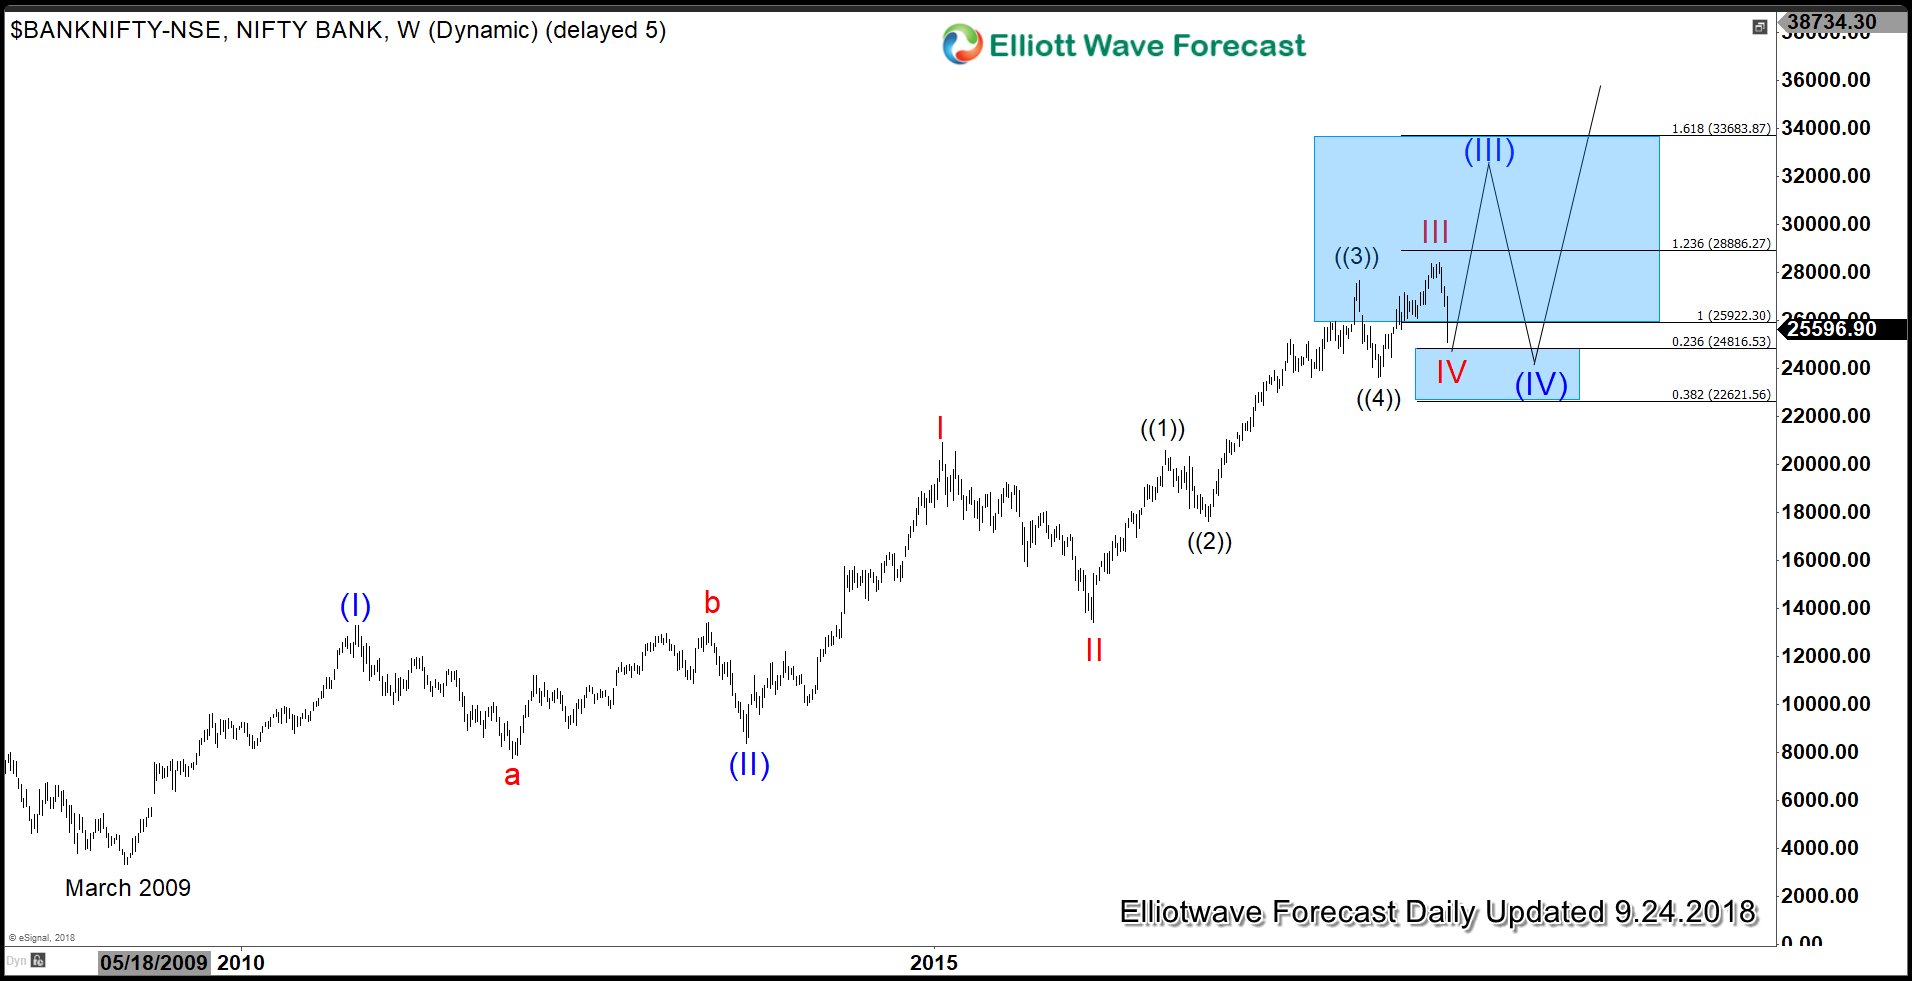
Bank Nifty: Will Trouble in Financial Sectors Drag India Stock Market?
Read MoreVolatility in India stocks spiked higher last week as panic set in the nation’s financial shares and dragging down Bank Nifty and other benchmark Index. Investors confidence remain fragile after the recent default by IL&FS (Infrastructure Leasing & Financial Services). Then last Friday, India’s central bank rejected the tenure extension of Yes Bank’s Chief Executive […]
-
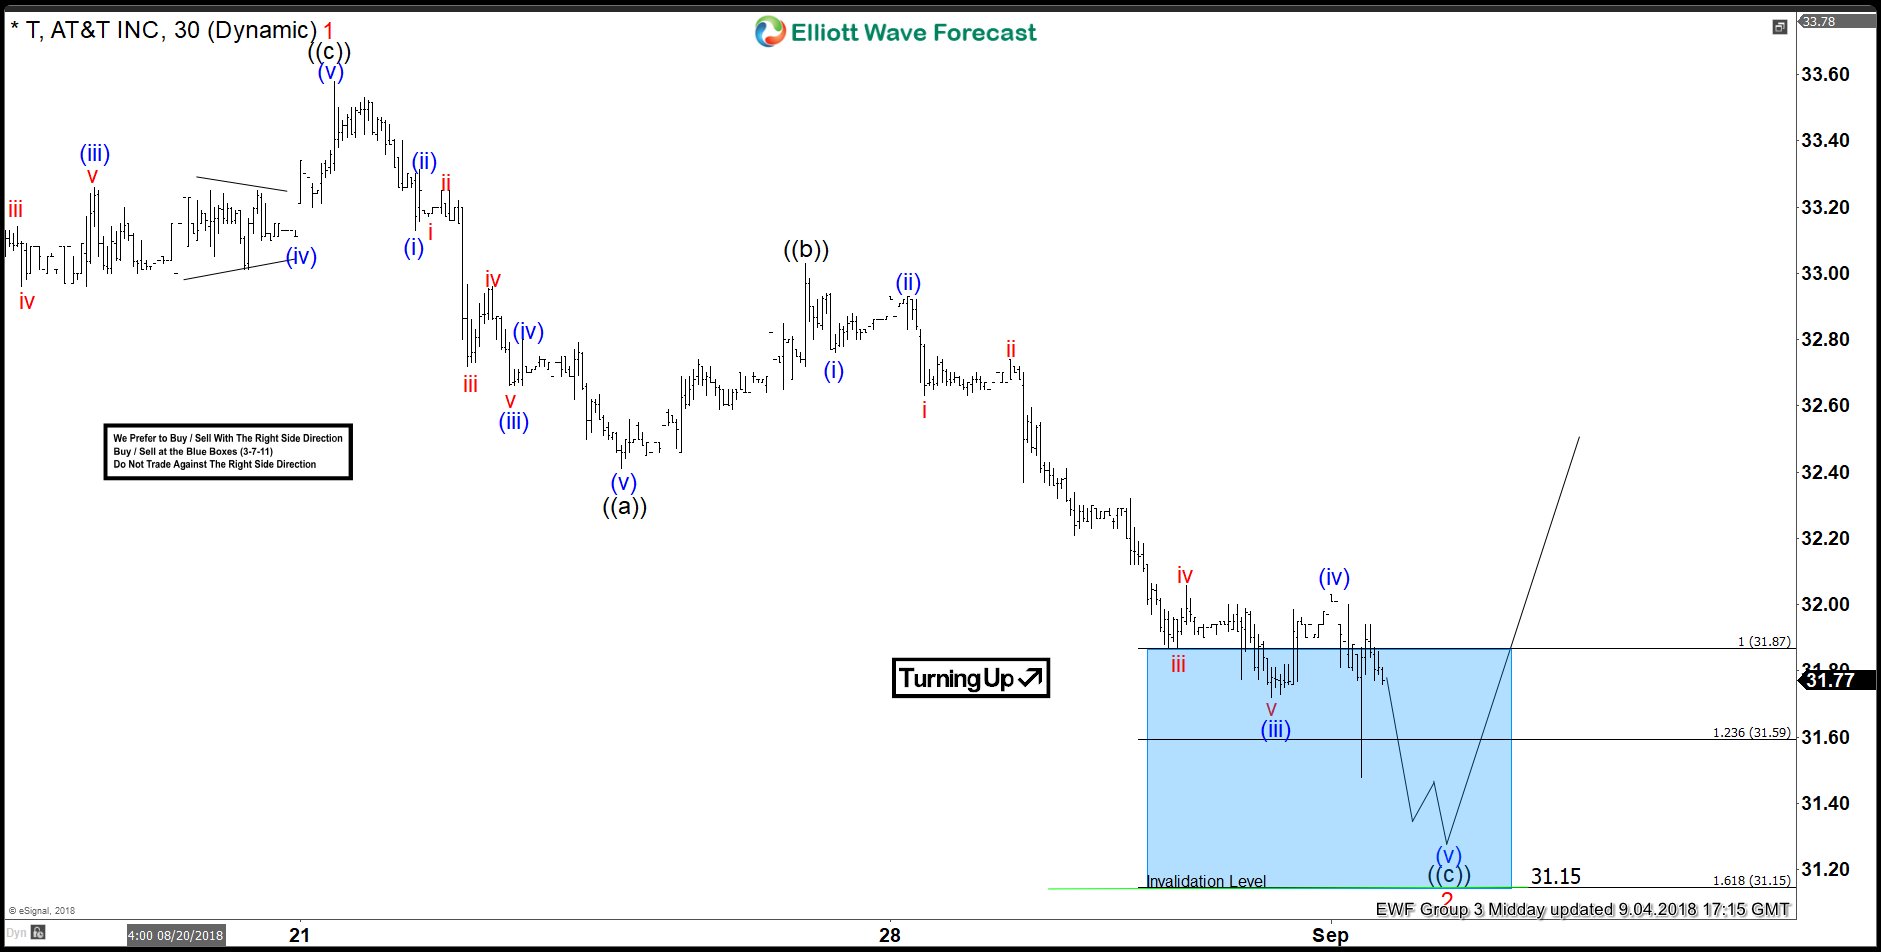
AT&T ( T ) Buying Elliott Wave Dips Into The Direction Of Right side
Read MoreIn this Technical blog, we are going to take a quick look at the past performance of AT&T ticker symbol: T Elliott Wave charts that we presented to our clients. We are going to explain the structure and the forecast. As our members knew, we were pointing out that the right side of the market remains higher in […]