

The Power of 3-7-11 and the Grand Super Cycle: How We Saw the Bullish Turn in April 2025 Back on April 9, 2025, while World Indices were dropping sharply and global sentiment had turned overwhelmingly bearish, we published an article that challenged the fear-driven narrative. We explained why selling was not the right approach and […]
-
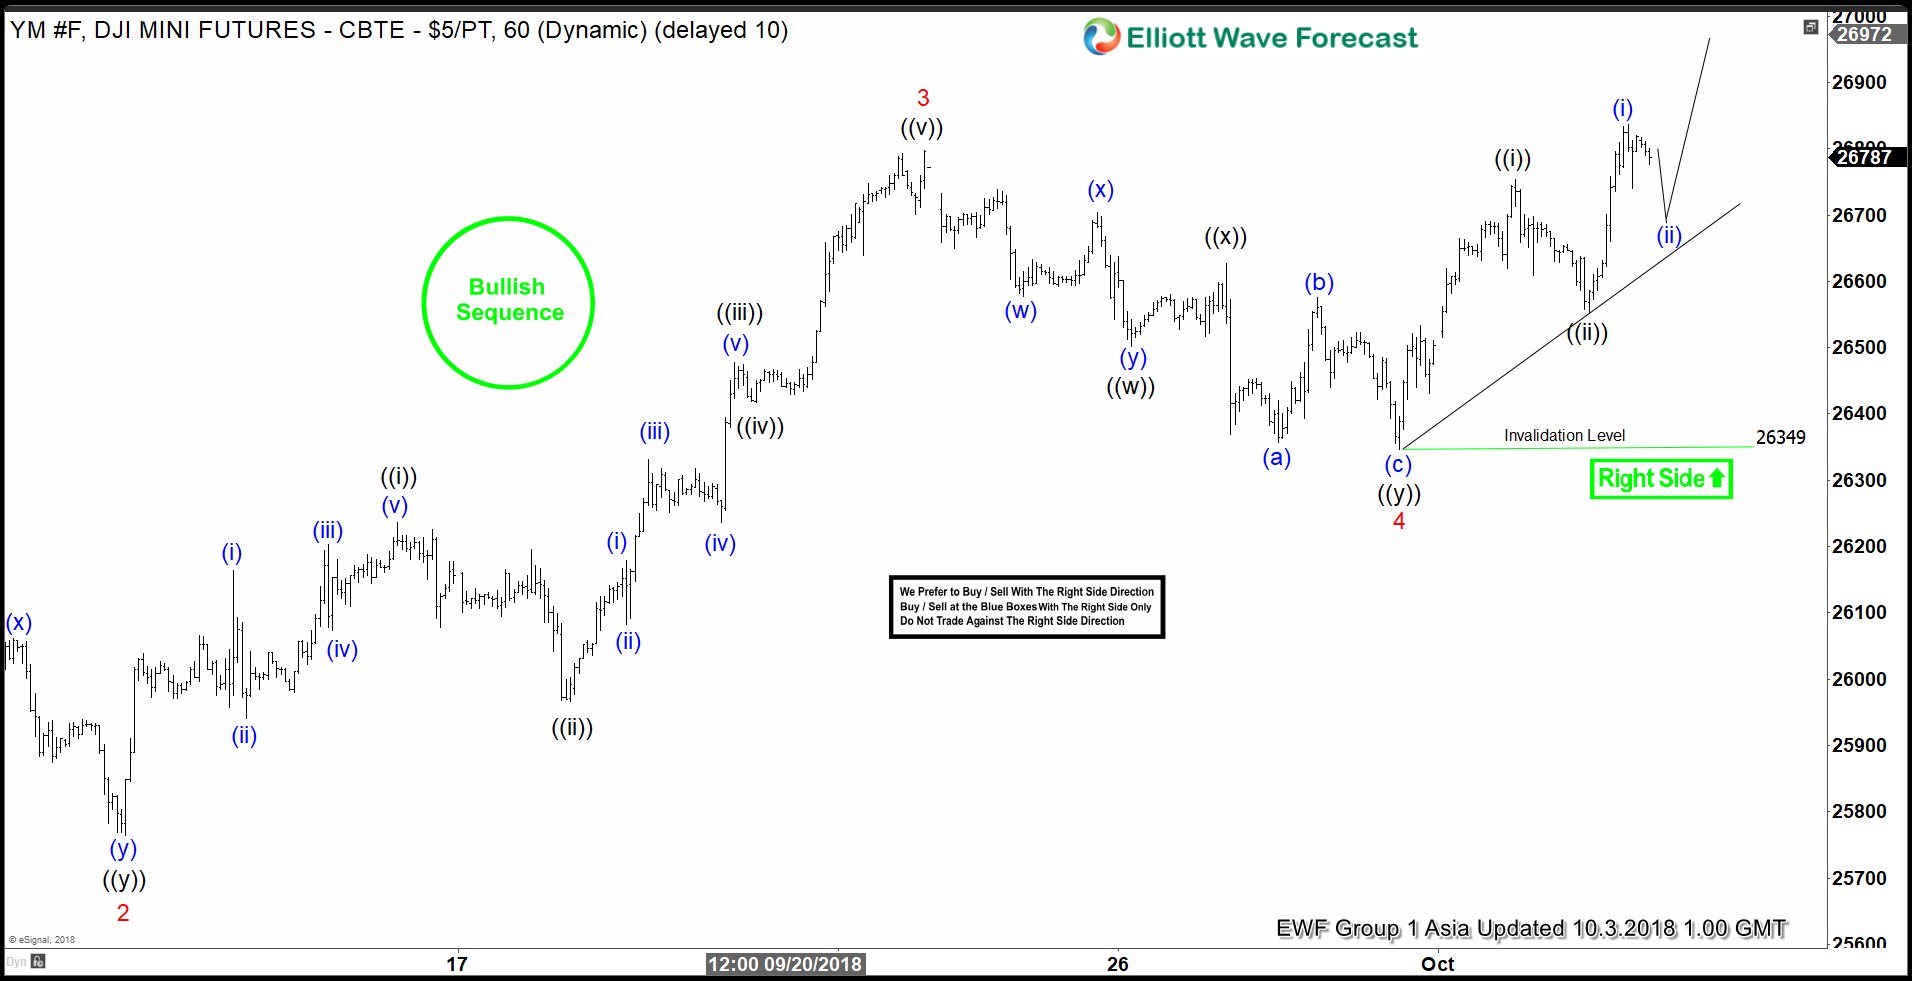
YM_F Elliott Wave: Started Nesting Next Leg Higher
Read MoreDJI Mini Futures ticker symbol: YM_F short-term Elliott wave view suggests that the index is nesting higher as impulse structure looking for more upside. The internals of lesser degree cycles is showing the sub-division of 5 waves advance in each leg higher i.e Minor wave 1, 3 & 5. While Minor wave 2 & 4 […]
-
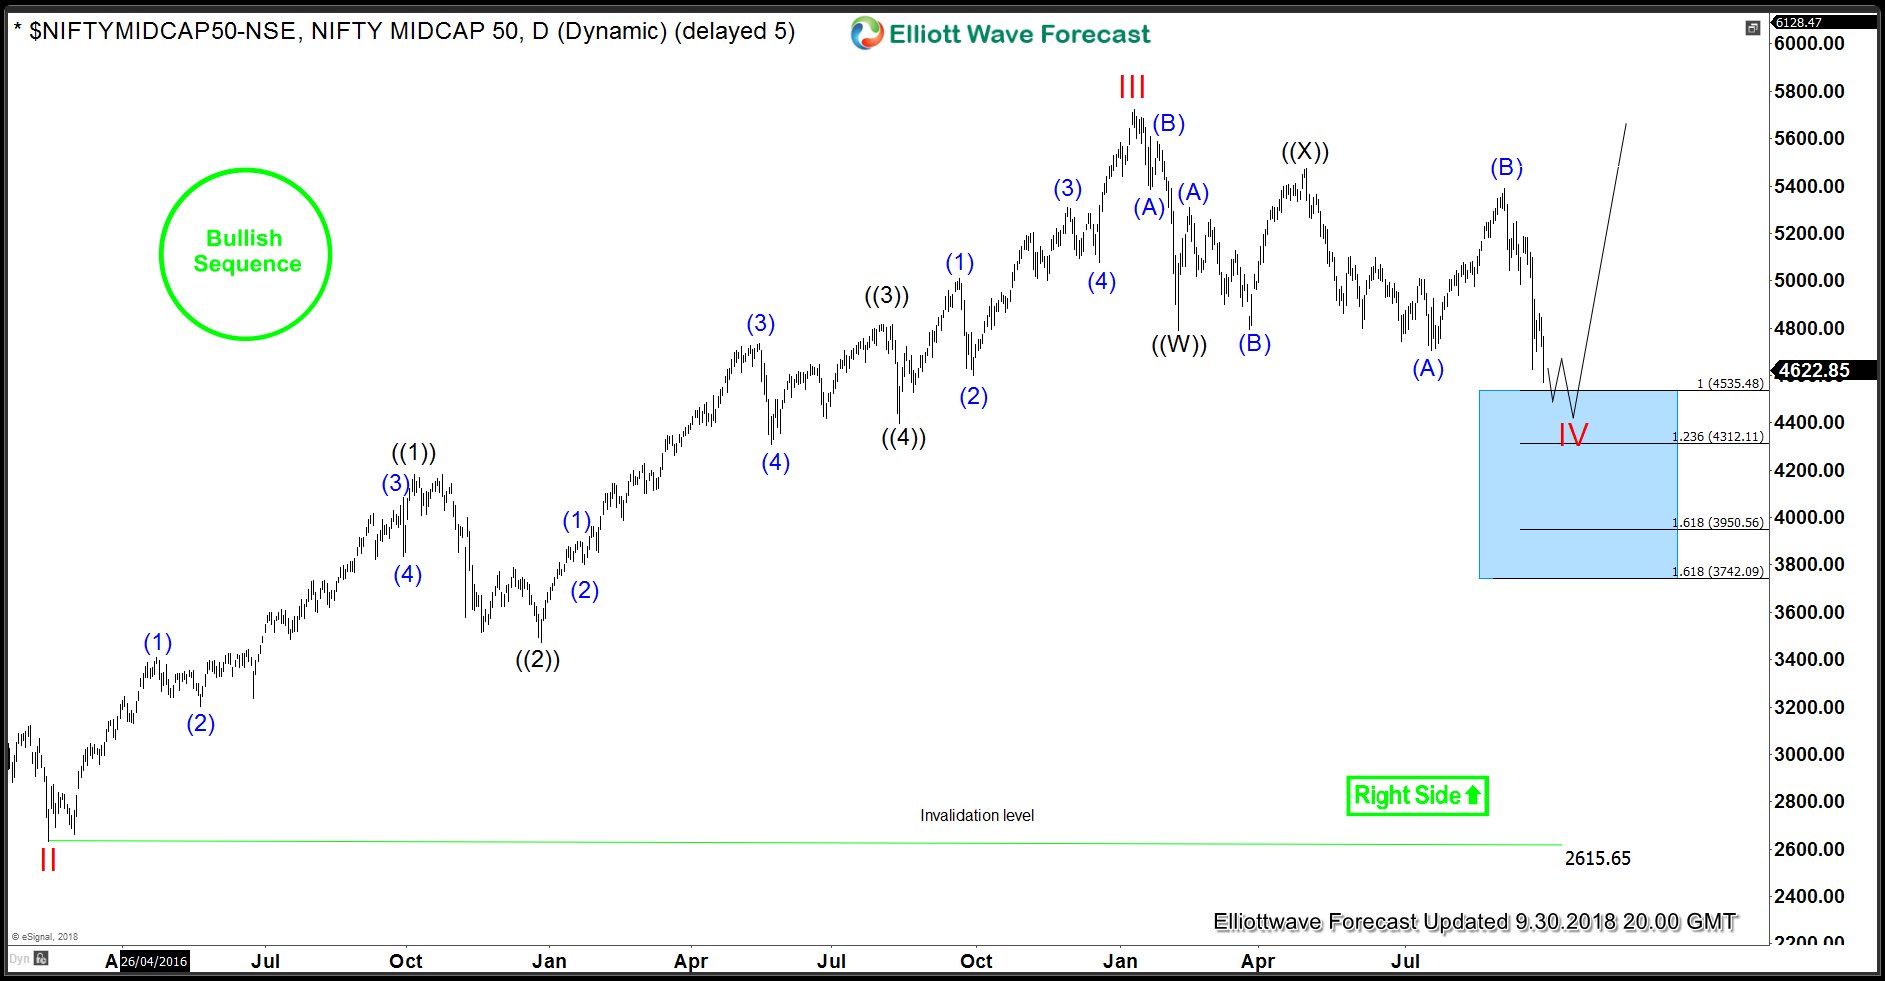
Nifty Midcap Index Turned Bearish or Still a Buy?
Read MoreNifty Midcap Index has dropped from a high of 5387 to close at 4622.85 on Friday losing 14% in the month of September 2018. In this article, we will take a look at the Elliott Wave view to determine whether Index has found a peak and now turned bearish or at least started a larger […]
-
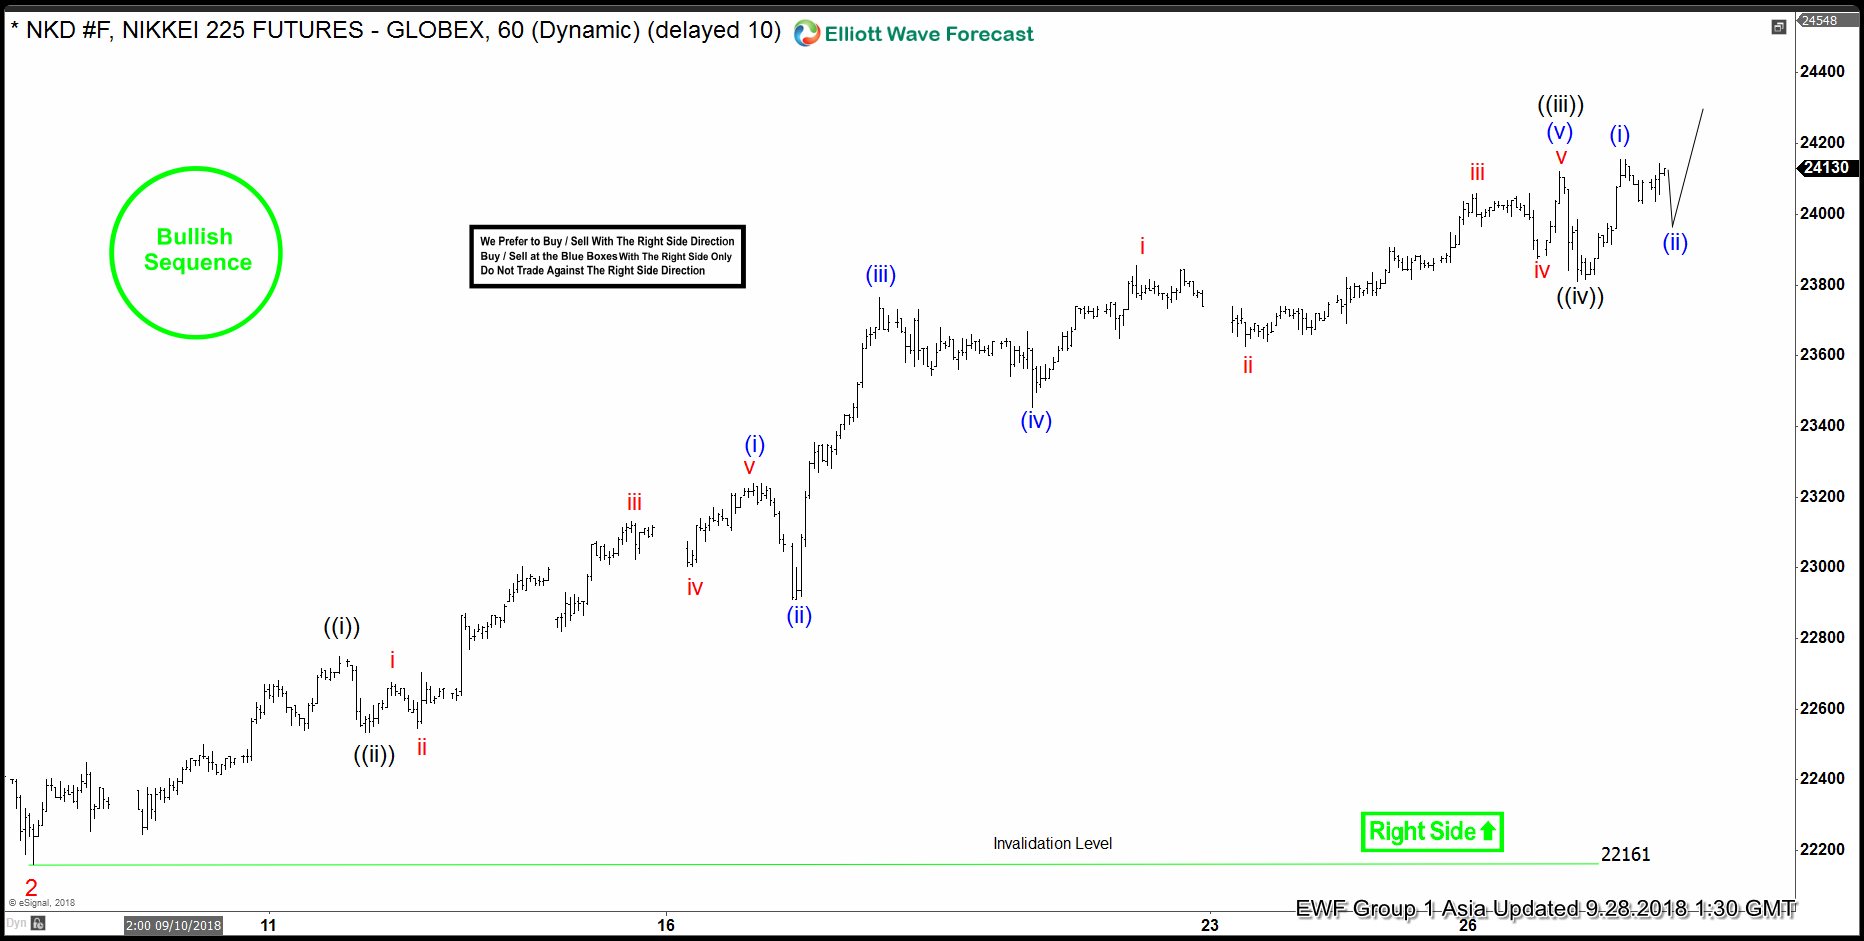
Nikkei Elliott Wave Right Side Calling Higher
Read MoreNikkei short-term Elliott wave view suggests that the decline to 22161 on 9/06/2018 low ended Minor wave 2. Above from there, Minor wave 3 remain in progress, nesting higher in an impulse structure. With lesser degree cycles showing sub-division of 5 waves structure in each leg higher i.e Minute wave ((i)), ((iii)) & ((v)) expected […]
-
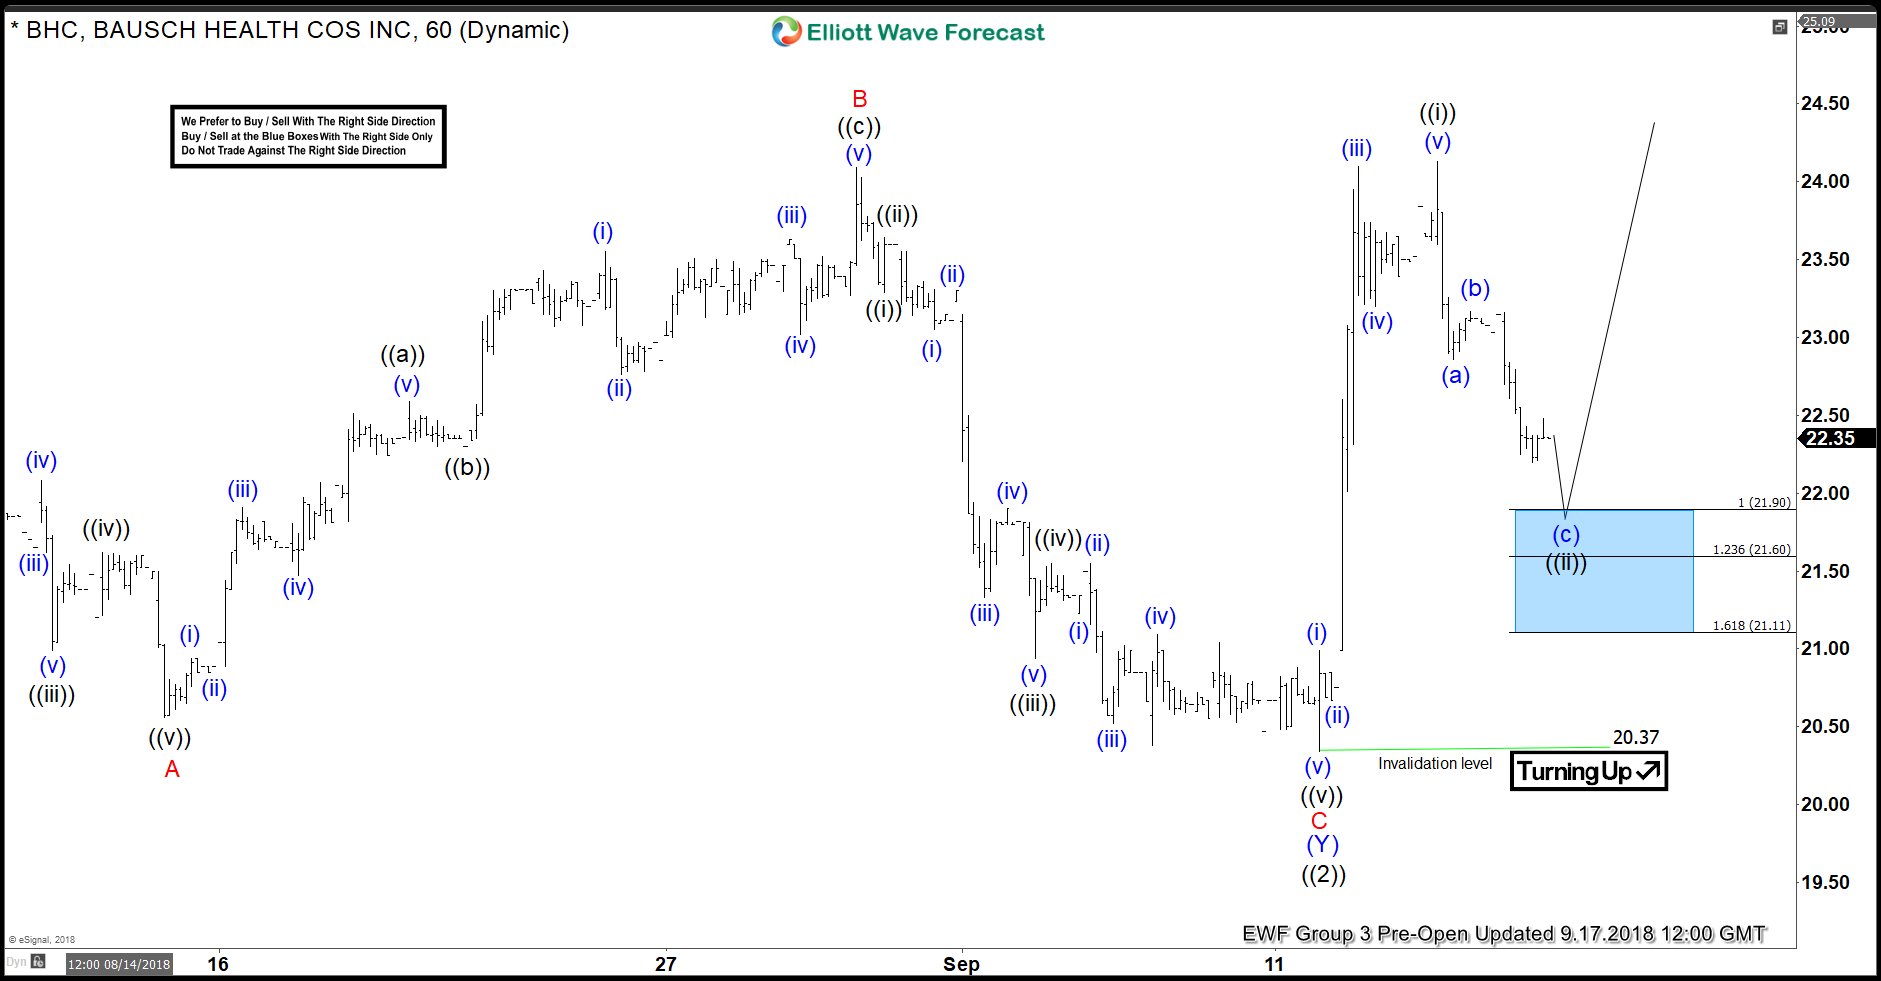
BHC Elliott Wave Analysis: Inflection Area Called The Bounce
Read MoreIn this blog, I want to share some short-term Elliott Wave charts of the BAUSCH Health stock which we presented to our members in the past. Below, you see the 1-hour updated chart presented to our clients on the 09/17/18 indicating that BHC ended the cycle from 06/13 peak low in black wave ((2)). As BHC ended the […]
-
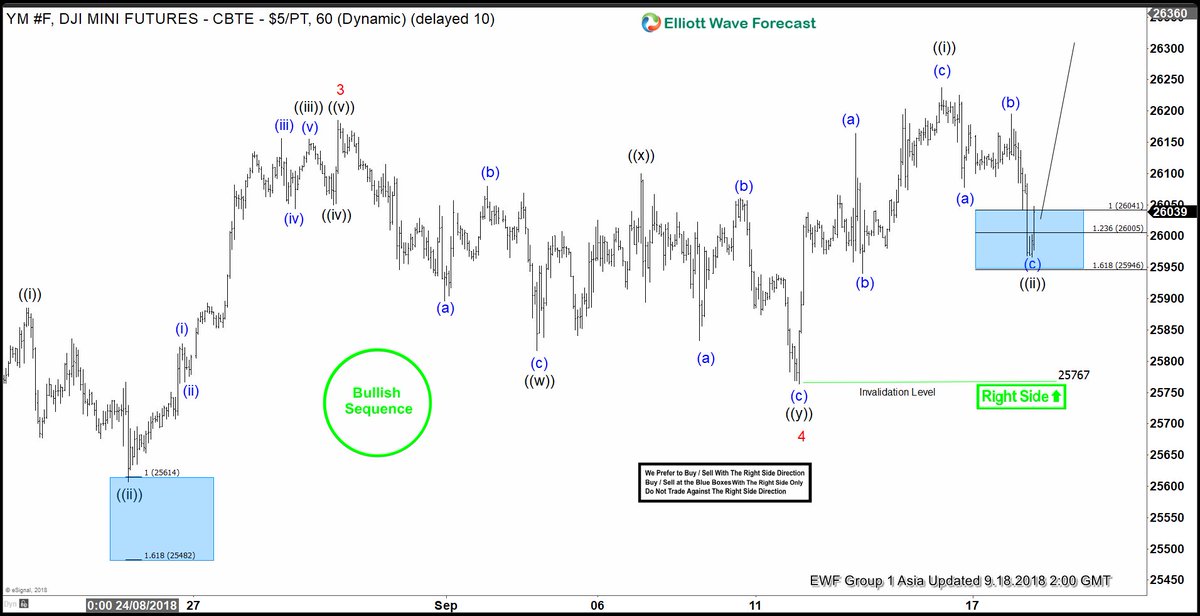
$DJI ( YM #F) Buying The Intraday Dips in 3,7,11 Swings
Read MoreAnother trading opportunity we have had lately is long trade in $DJI Mini Futures. In this technical blog we’re going to take a quick look at the Elliott Wave charts of $DJI published in members area of the website. As our members know, the right side in $DJI is long side. Futures has incomplete bullish […]
-
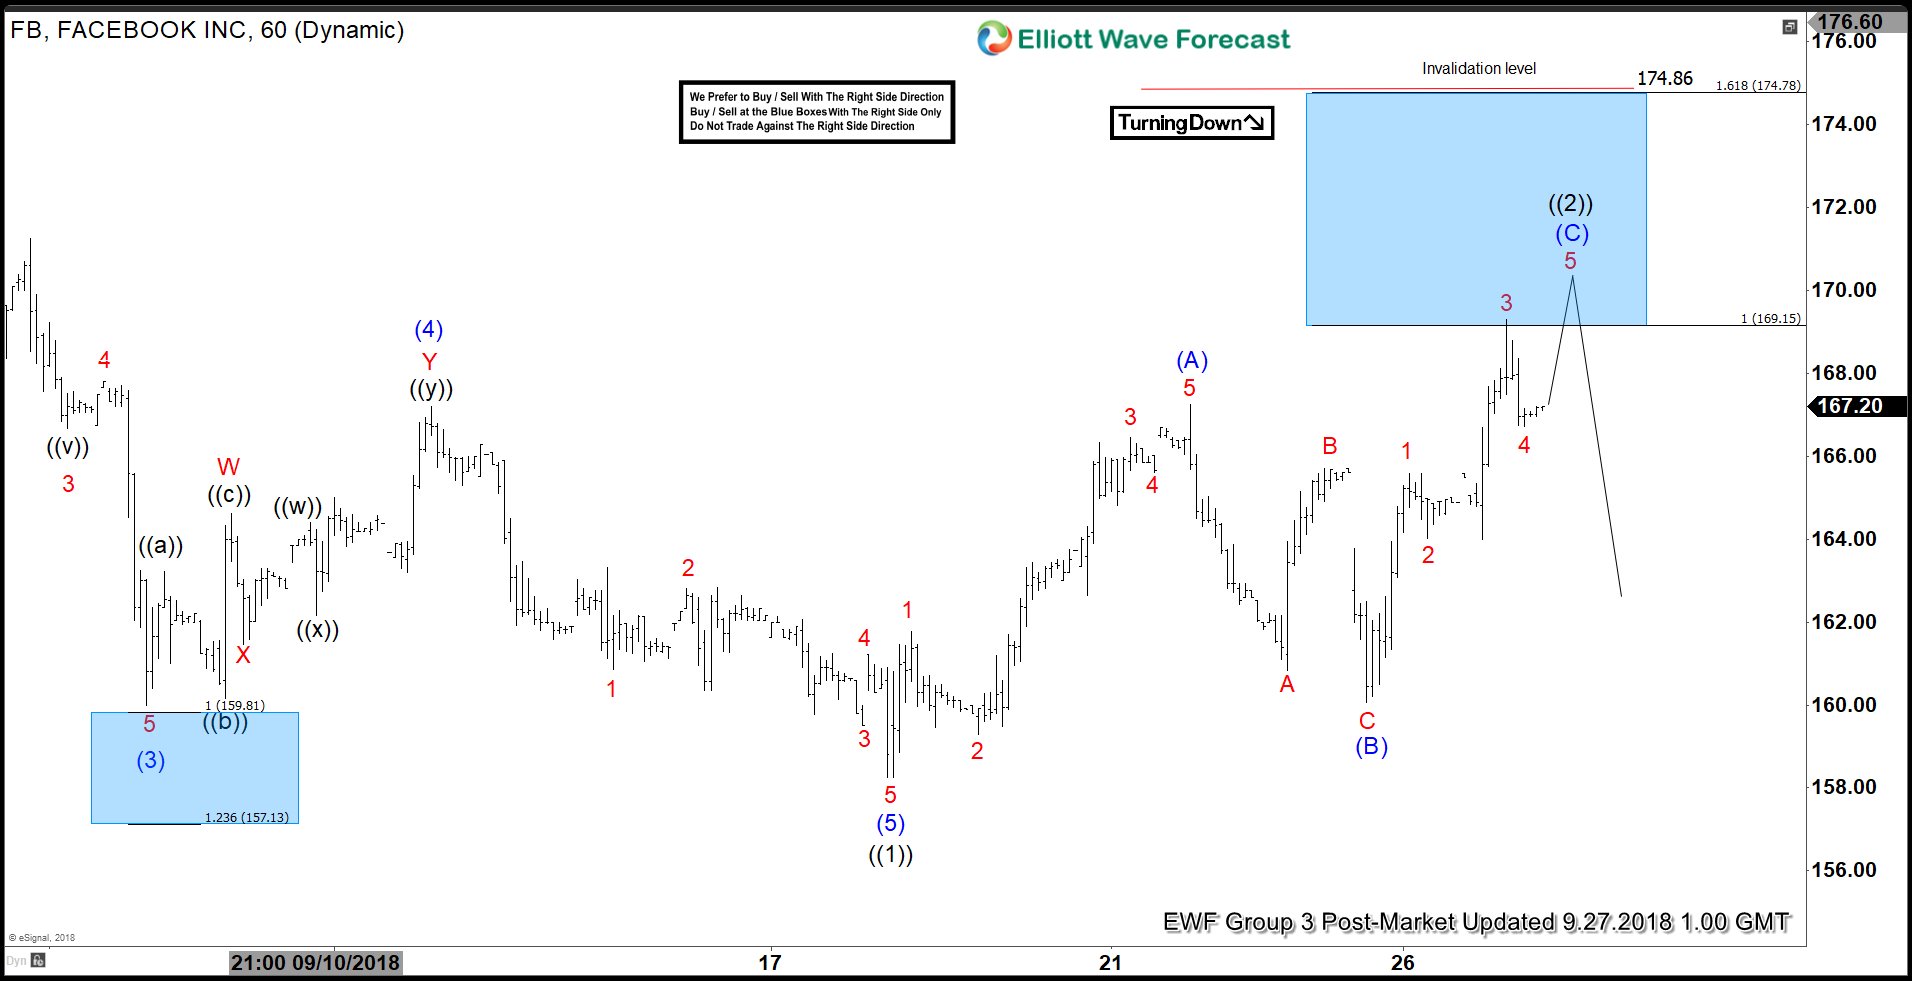
Facebook At Verge Of Rejection Again?
Read MoreFacebook ticker symbol: $FB short-term Elliott wave view suggests that the decline to $158.26 low ended the cycle from 8/07/2018 peak in primary wave ((1)). The internals of that decline unfolded in 5 waves impulse structure with lesser degree cycles showing the sub-division of 5 waves structure in it’s each leg lower i.e intermediate wave […]