

The Power of 3-7-11 and the Grand Super Cycle: How We Saw the Bullish Turn in April 2025 Back on April 9, 2025, while World Indices were dropping sharply and global sentiment had turned overwhelmingly bearish, we published an article that challenged the fear-driven narrative. We explained why selling was not the right approach and […]
-
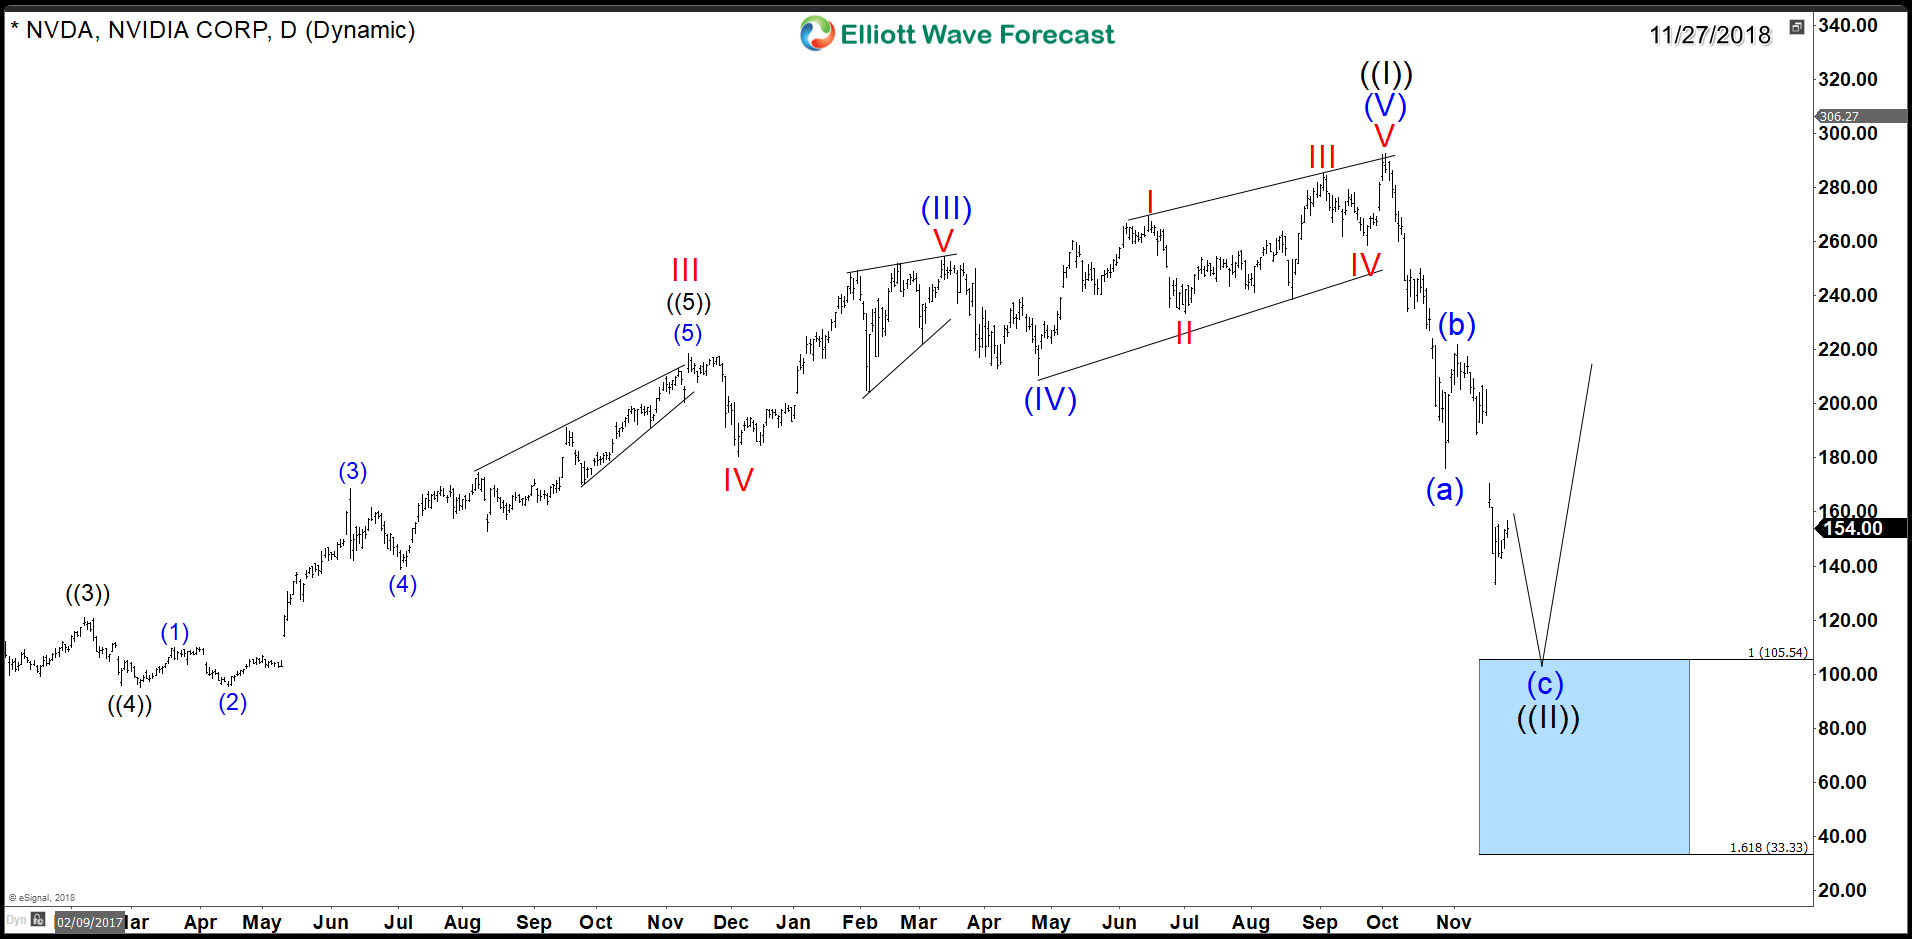
Nvidia (NASDAQ:NVDA) – New Buying Opportunity in the Horizon?
Read MoreNvidia Corporation (NASDAQ:NVDA) has grown to become a leader in manufacturing graphic processing units (GPU) for computer and gaming devices as well as Artificial Intelligence (AI). In the recent 2 years, the American company benefited the most from the growth of cryptocurrency and artificial intelligence markets. However, back in October 2018, the stock made a major peak […]
-
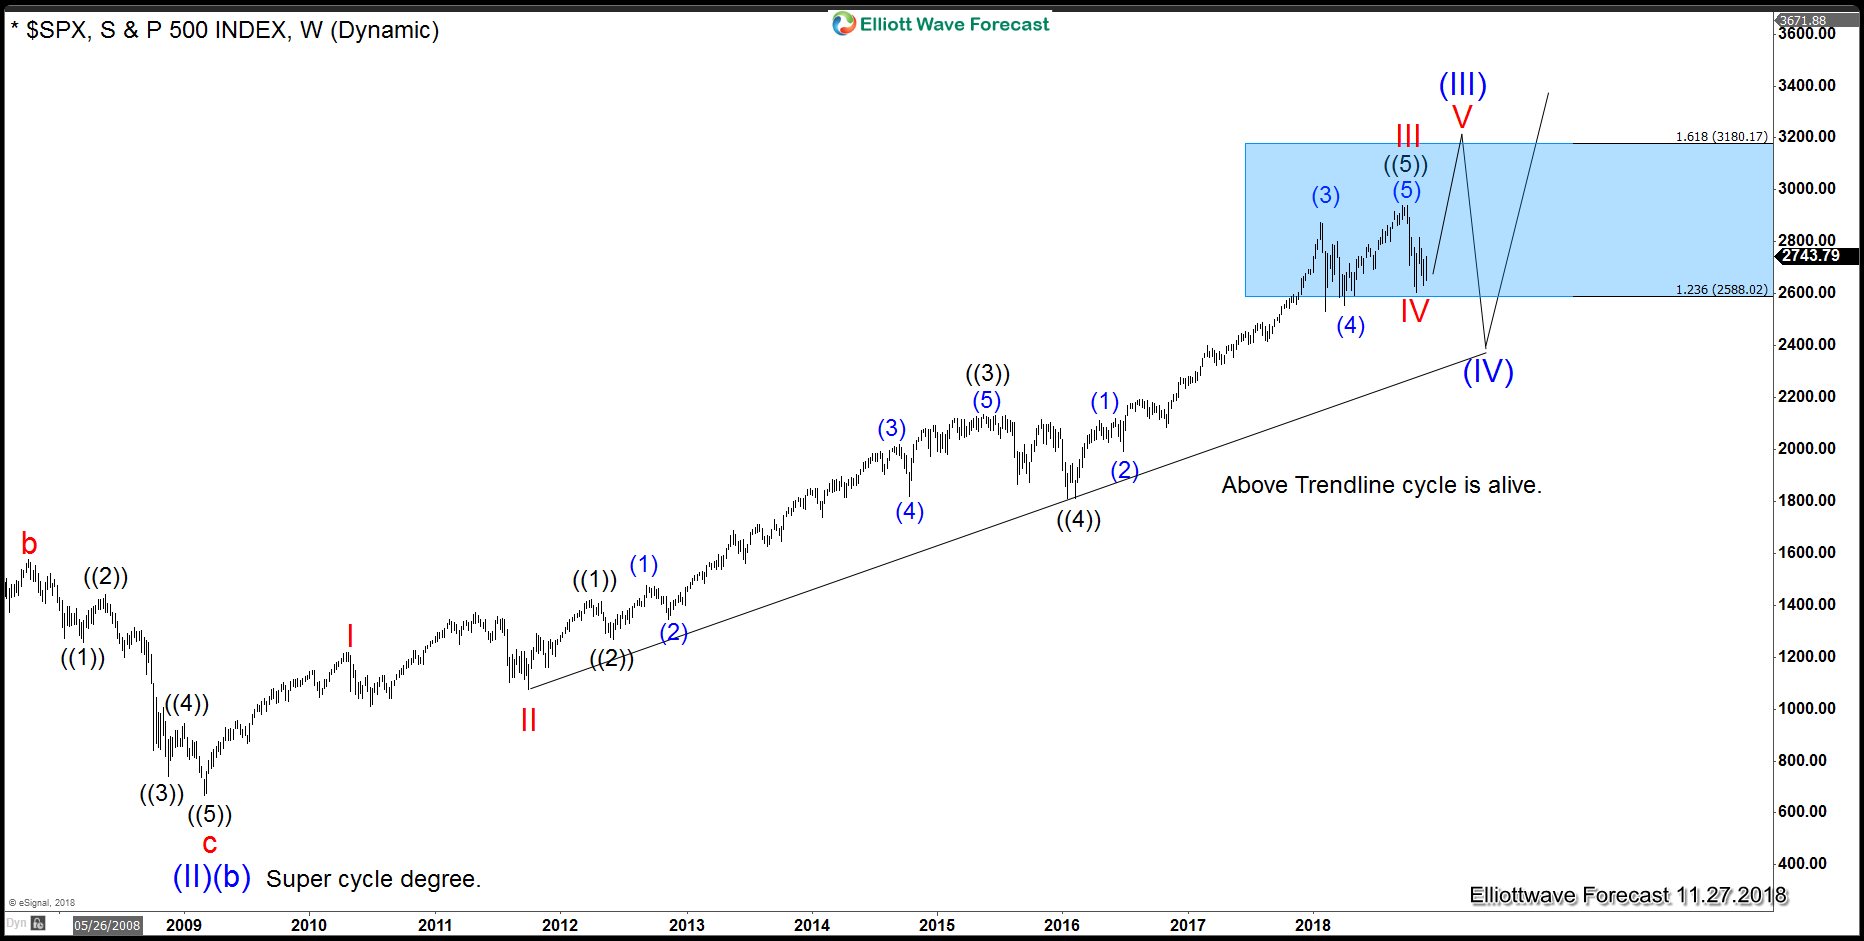
Elliott Wave: SPX Decision Time Is Coming Soon
Read MoreThe SPX Index is trading within a Blue Box in our system, these boxes are areas in which the Market needs to define whether it will become an Impulsive sequence which runs in 5-9-13 waves or corrective sequence in which runs in 3-7-11 waves. Many traders who follow The Elliott wave Theory understand the idea of […]
-

Elliott Wave Analysis: Amazon Rally Should Fail for Yet Another Low
Read MoreShort term Elliott Wave View in Amazon (ticker: AMZN) suggests that the bounce to 1784 ended Cycle degree wave x. Cycle degree wave y is currently in progress lower as a double three Elliott Wave structure. Down from 1784, Primary wave ((W)) ended at 1420 and Primary wave ((X)) bounce is in progress towards 1631.54 […]
-
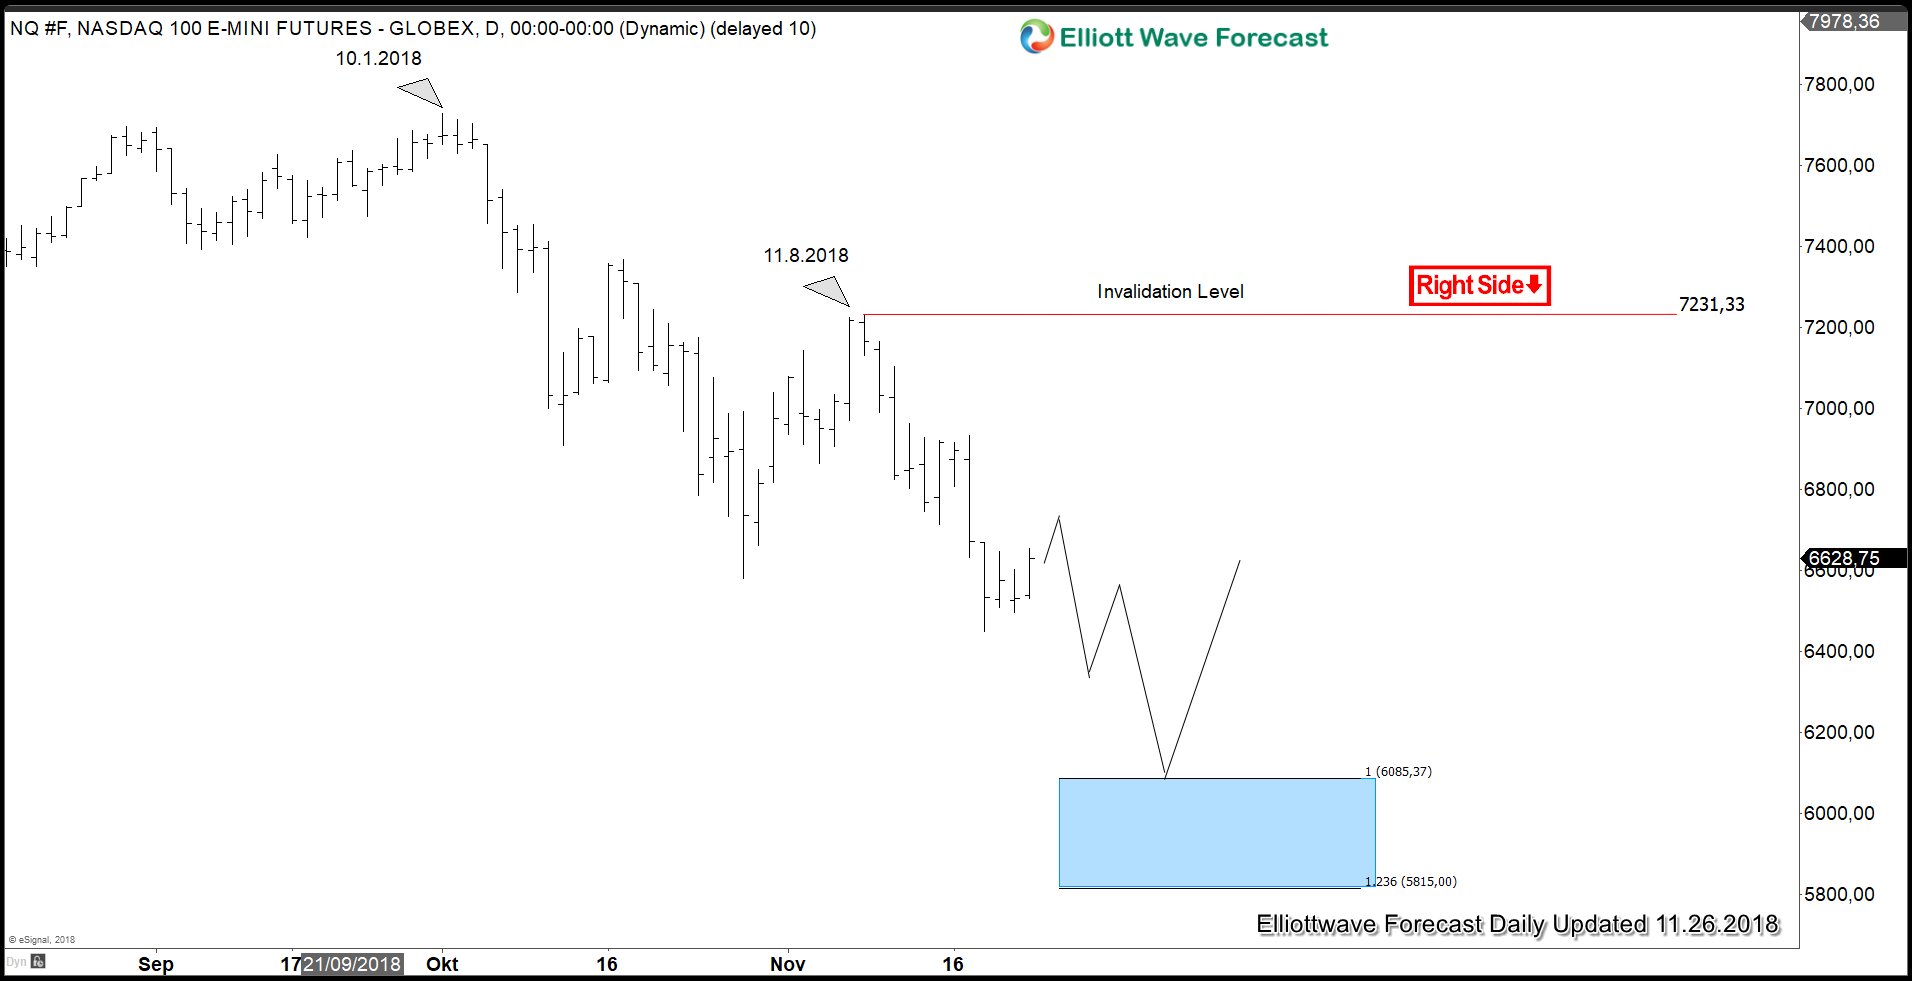
G20 Meeting May Dictate Path of Stock Market for Rest of the Year
Read MoreGlobal Indices continue to retreat in the fourth quarter of this year as the combination of Fed’s quantitative tightening and escalating trade wars threatens to derail the 10 year bullish market. Below is the Year-to-Date return of the Global Indices as of Friday Nov 24: Next week, global Indices will have a chance to find […]
-
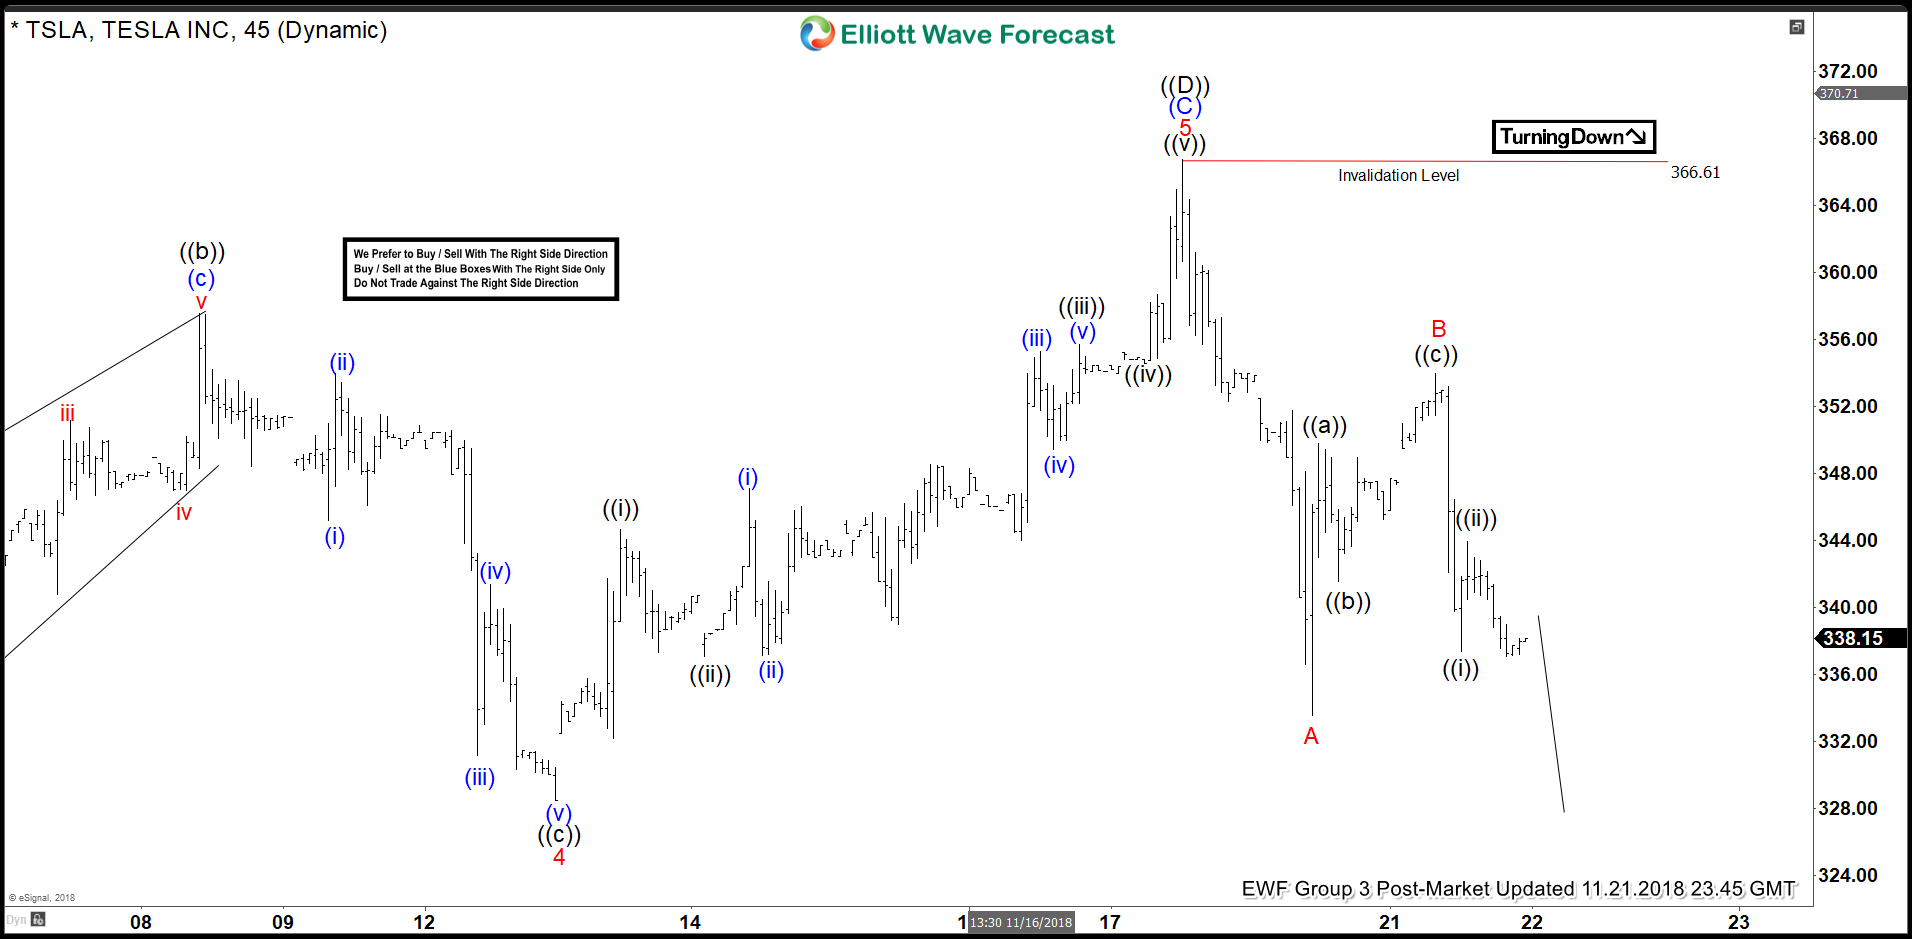
Tesla Maturing Sideways Price Action?
Read MoreTesla ticker symbol: $TSLA short-term Elliott wave view suggests that Minor wave 3 ended at $349.20 high. Down from there, a pullback to $328.50 low ended Minor wave 4. The internals of that pullback unfolded as a Flat correction. Minute wave ((a)) of 4 ended at $330.14 low in lesser degree Flat correction. Above from […]
-
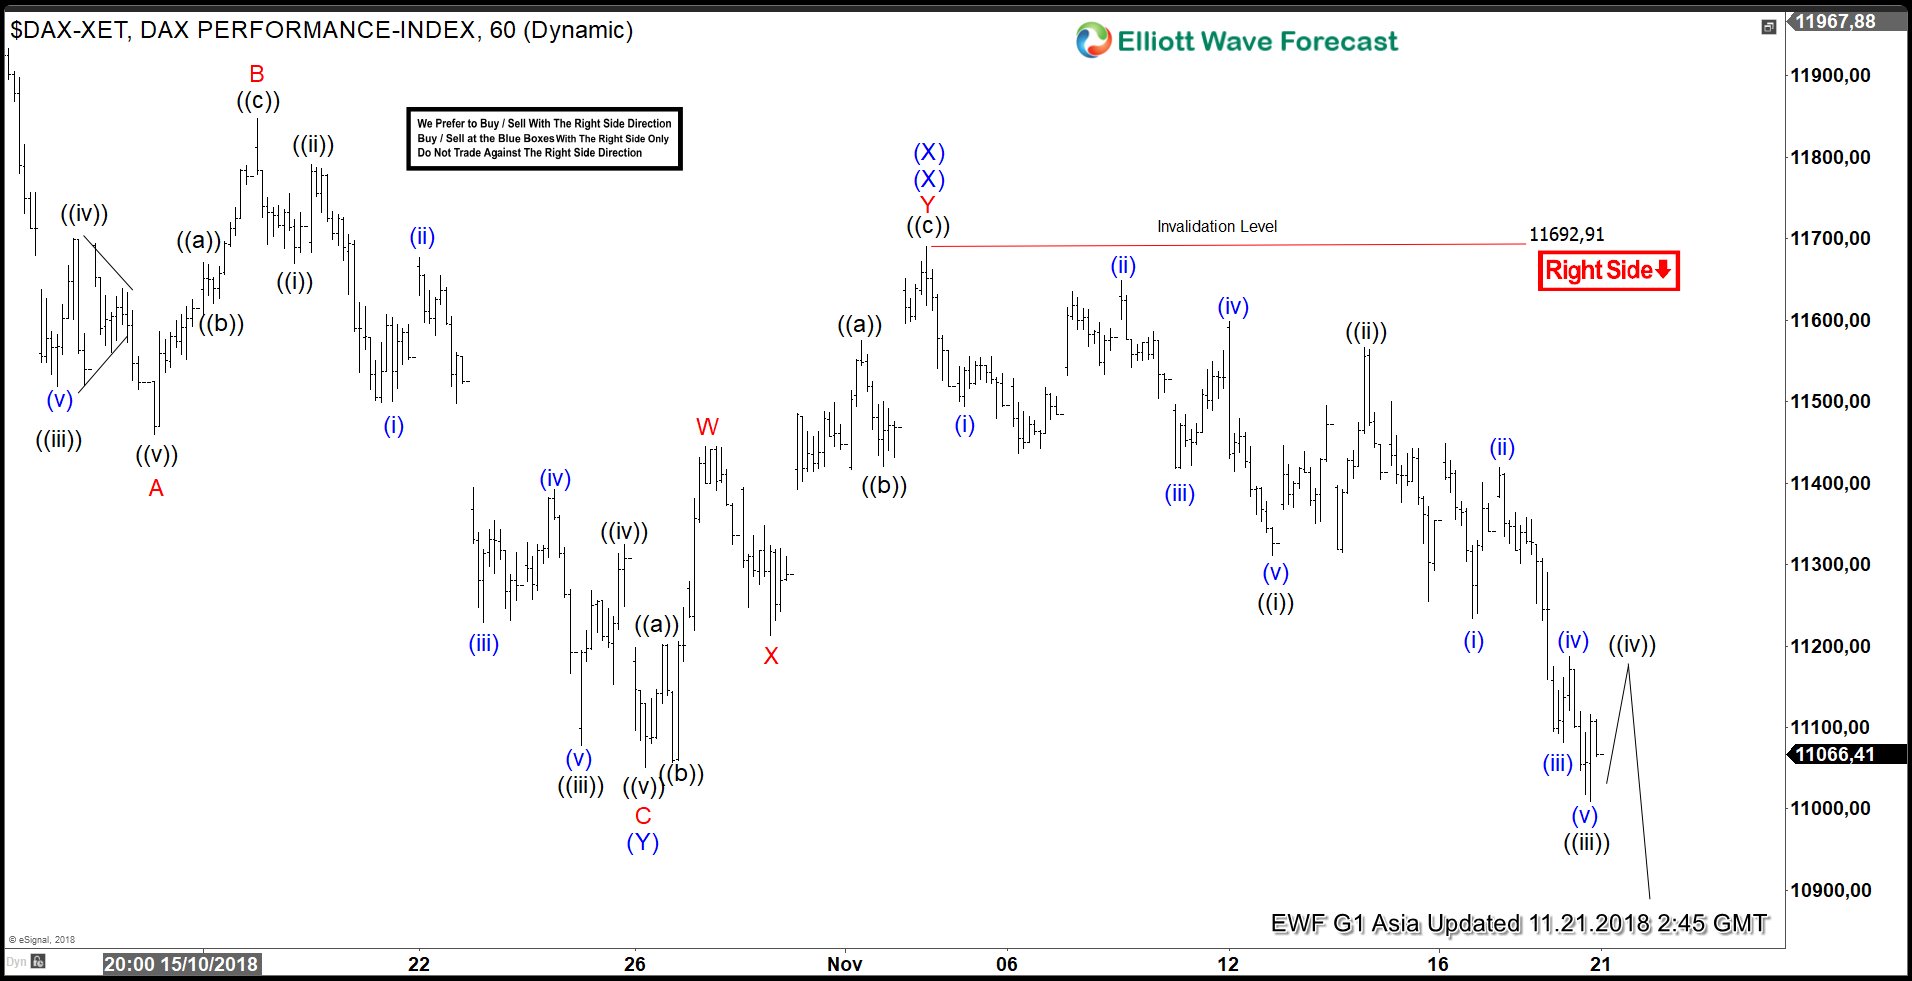
DAX Elliott Wave Analysis Calling Rally to Fail for Extension Lower
Read MoreDAX has broken below Oct 26 low (11051) and suggests that the Index has resumed the decline lower. We are calling the decline from July 27 high (12886.83) as a triple three Elliott Wave Structure. Decline to 11051.04 low on Oct 26 ended Intermediate wave (Y). From there, rally to 11692.91 high on Nov 2 ended […]