

The Power of 3-7-11 and the Grand Super Cycle: How We Saw the Bullish Turn in April 2025 Back on April 9, 2025, while World Indices were dropping sharply and global sentiment had turned overwhelmingly bearish, we published an article that challenged the fear-driven narrative. We explained why selling was not the right approach and […]
-
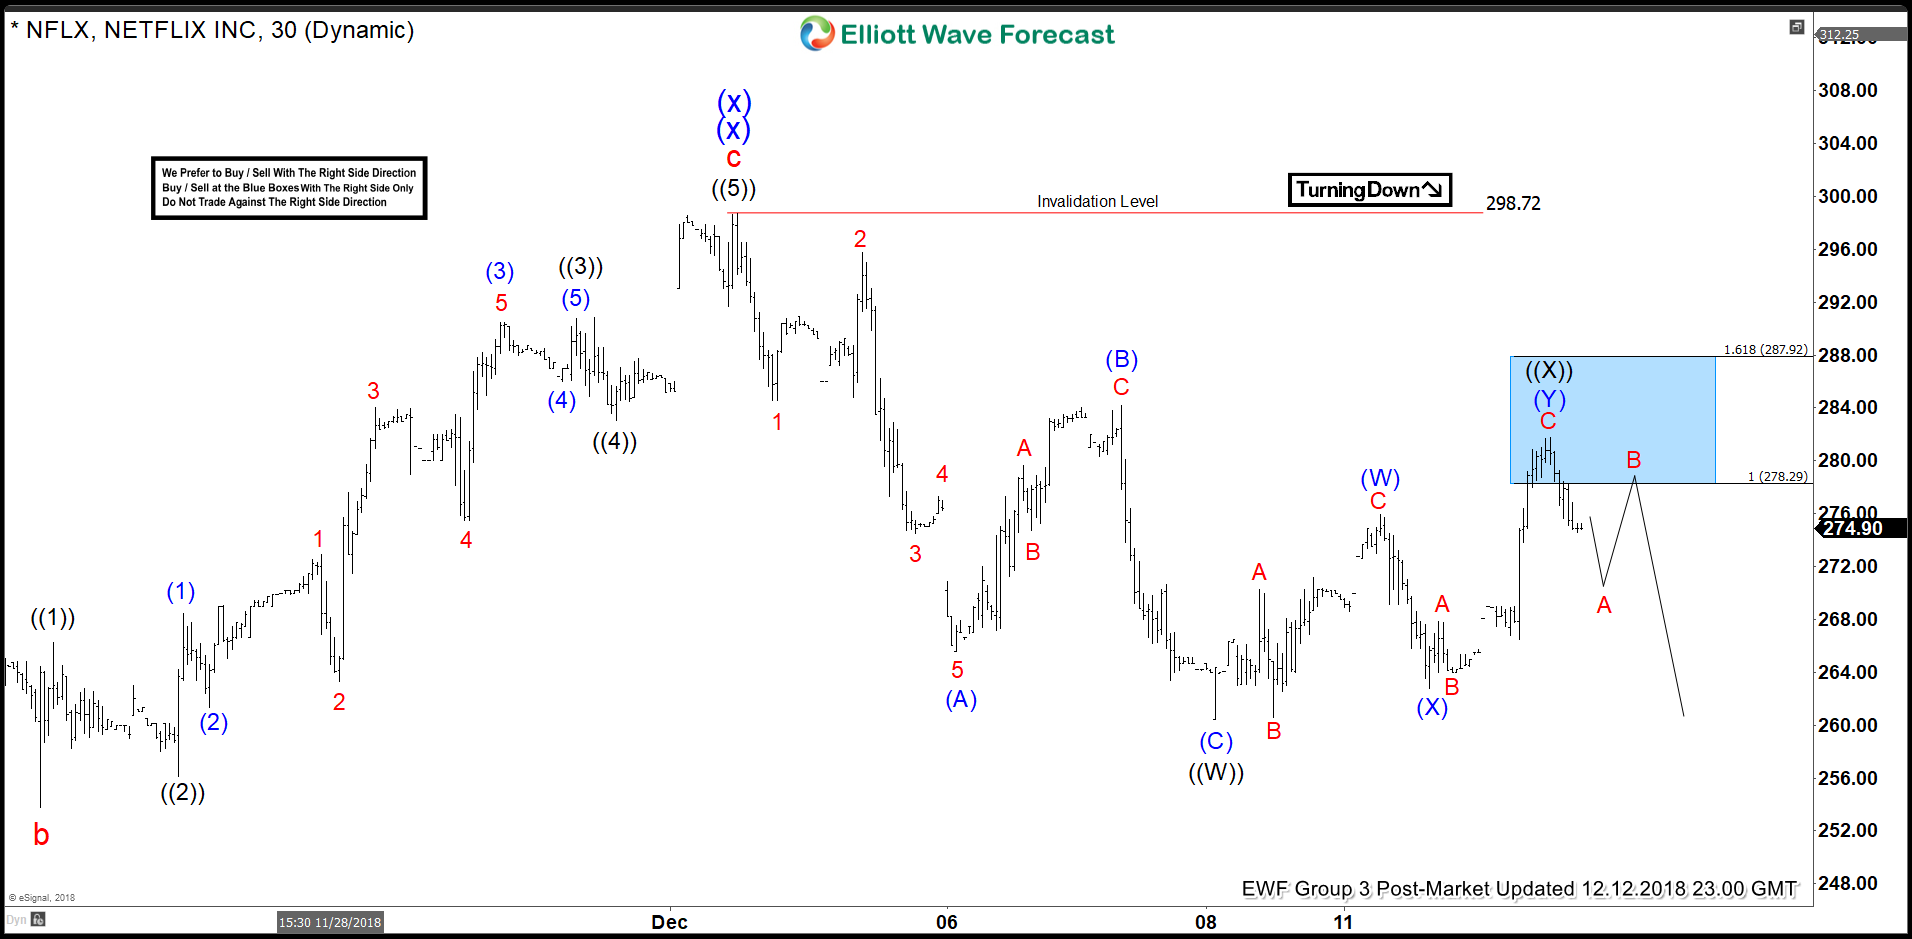
Elliott Wave Analysis: Netflix Reacted Lower from Blue Box
Read MoreHello fellow traders, In this blog, we will have a look at some short-term Elliott Wave charts of Netflix which we presented to our members in the past. You see the 1-hour updated chart presented to our clients on the 12/12/18. Netflix ended the cycle from 12/03/18 peak in black wave ((W)) at 12/10/18 low (260.22). Above from […]
-
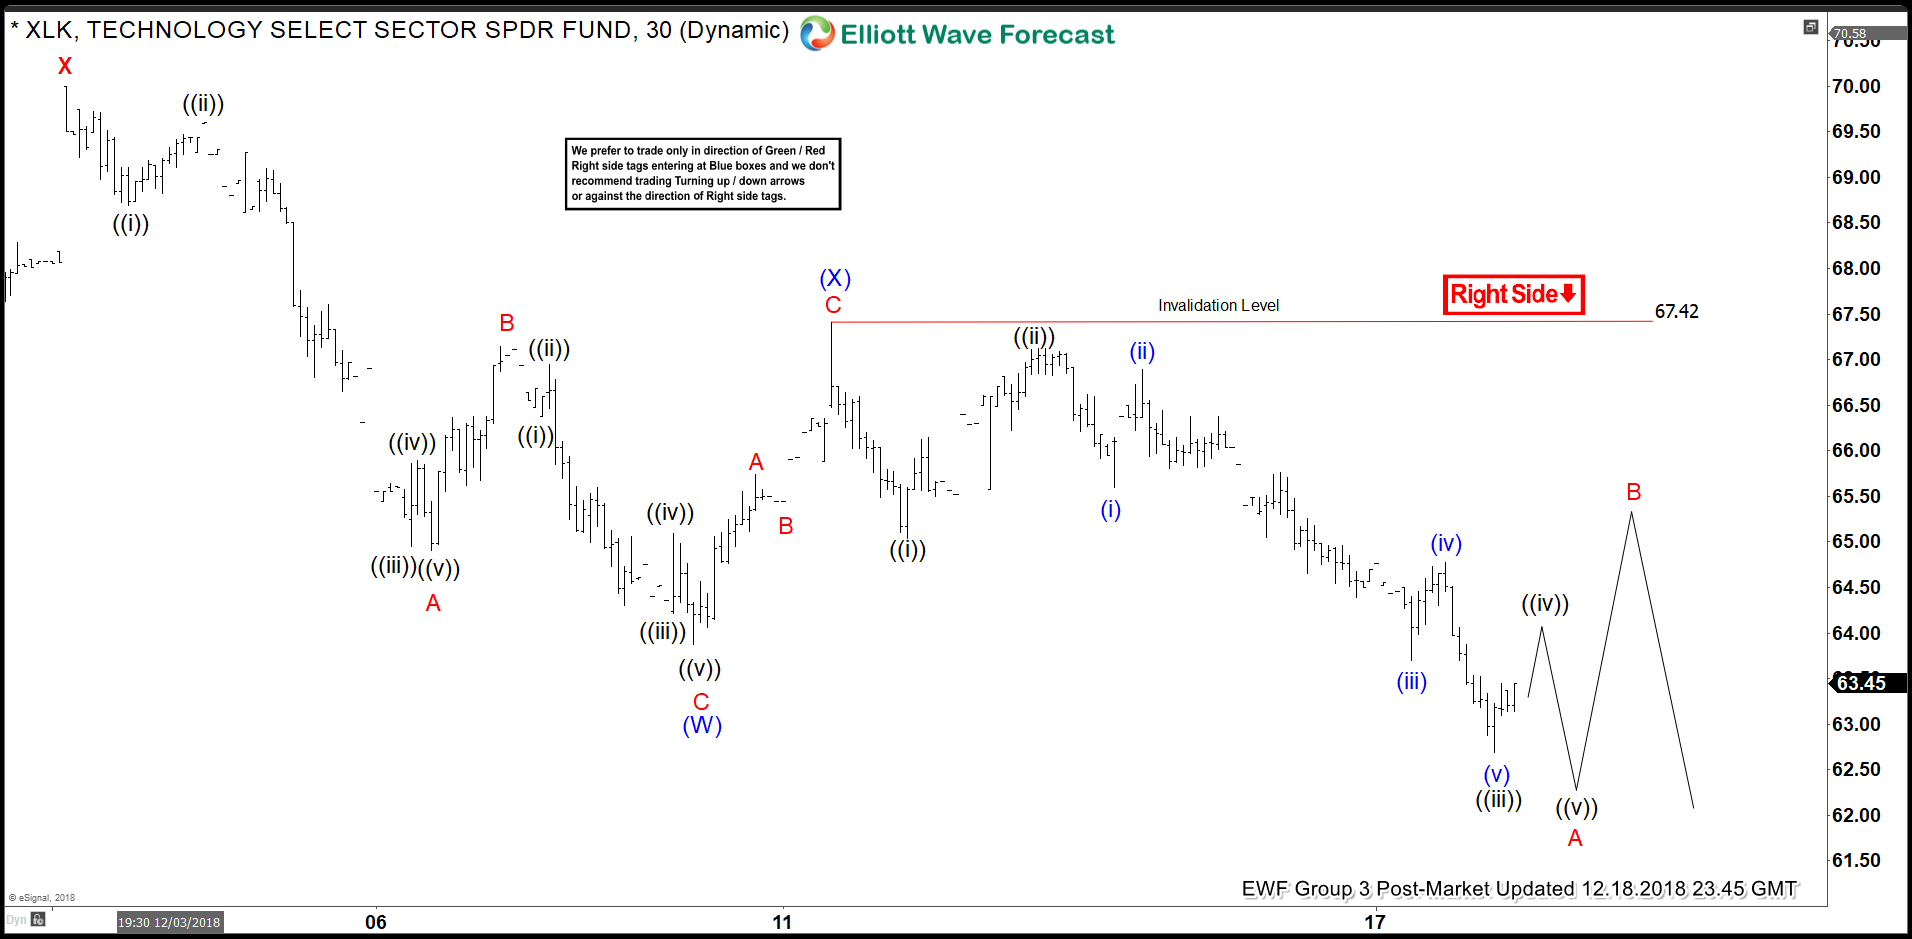
XLK Lower Low Sequence Can Help Trying To Reach Its Extreme?
Read MoreTechnology Sector ETF: ticker symbol XLK short-term Elliott Wave view suggests that a bounce to $70 ended cycle degree wave “x” bounce on 12/03/2018 peak. Down from there, the ETF has broken to new low below 11/20/2018 low $63.38 confirming the cycle degree wave “y”. And with this break below $63.38 low the sequence from […]
-
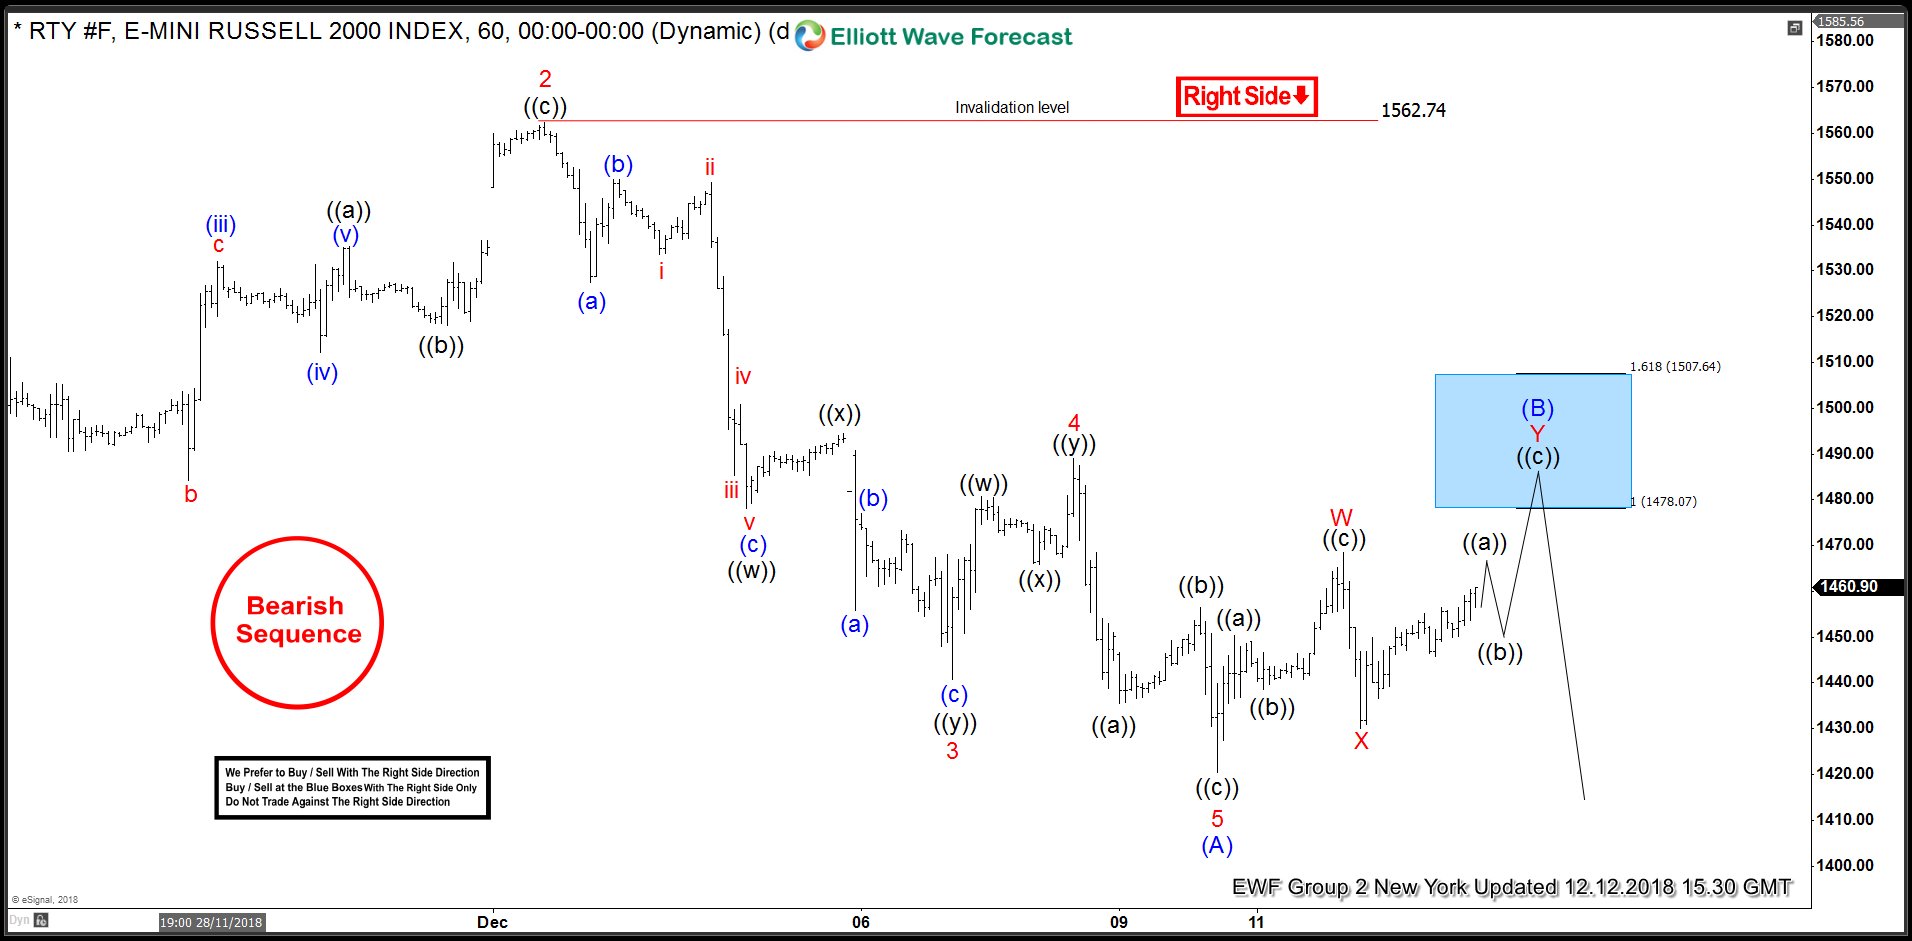
RUSSELL Incomplete Bearish Sequences Calling The Decline
Read MoreHello fellow traders. In this technical blog we’re going to take a quick look at the charts of RUSSELL published in members area of the website. As our members know, RUSSELL has incomplete sequences in the cycle from the August 31th 2018 peak. Break of October 24th low, has made 31th August cycle incomplete to […]
-
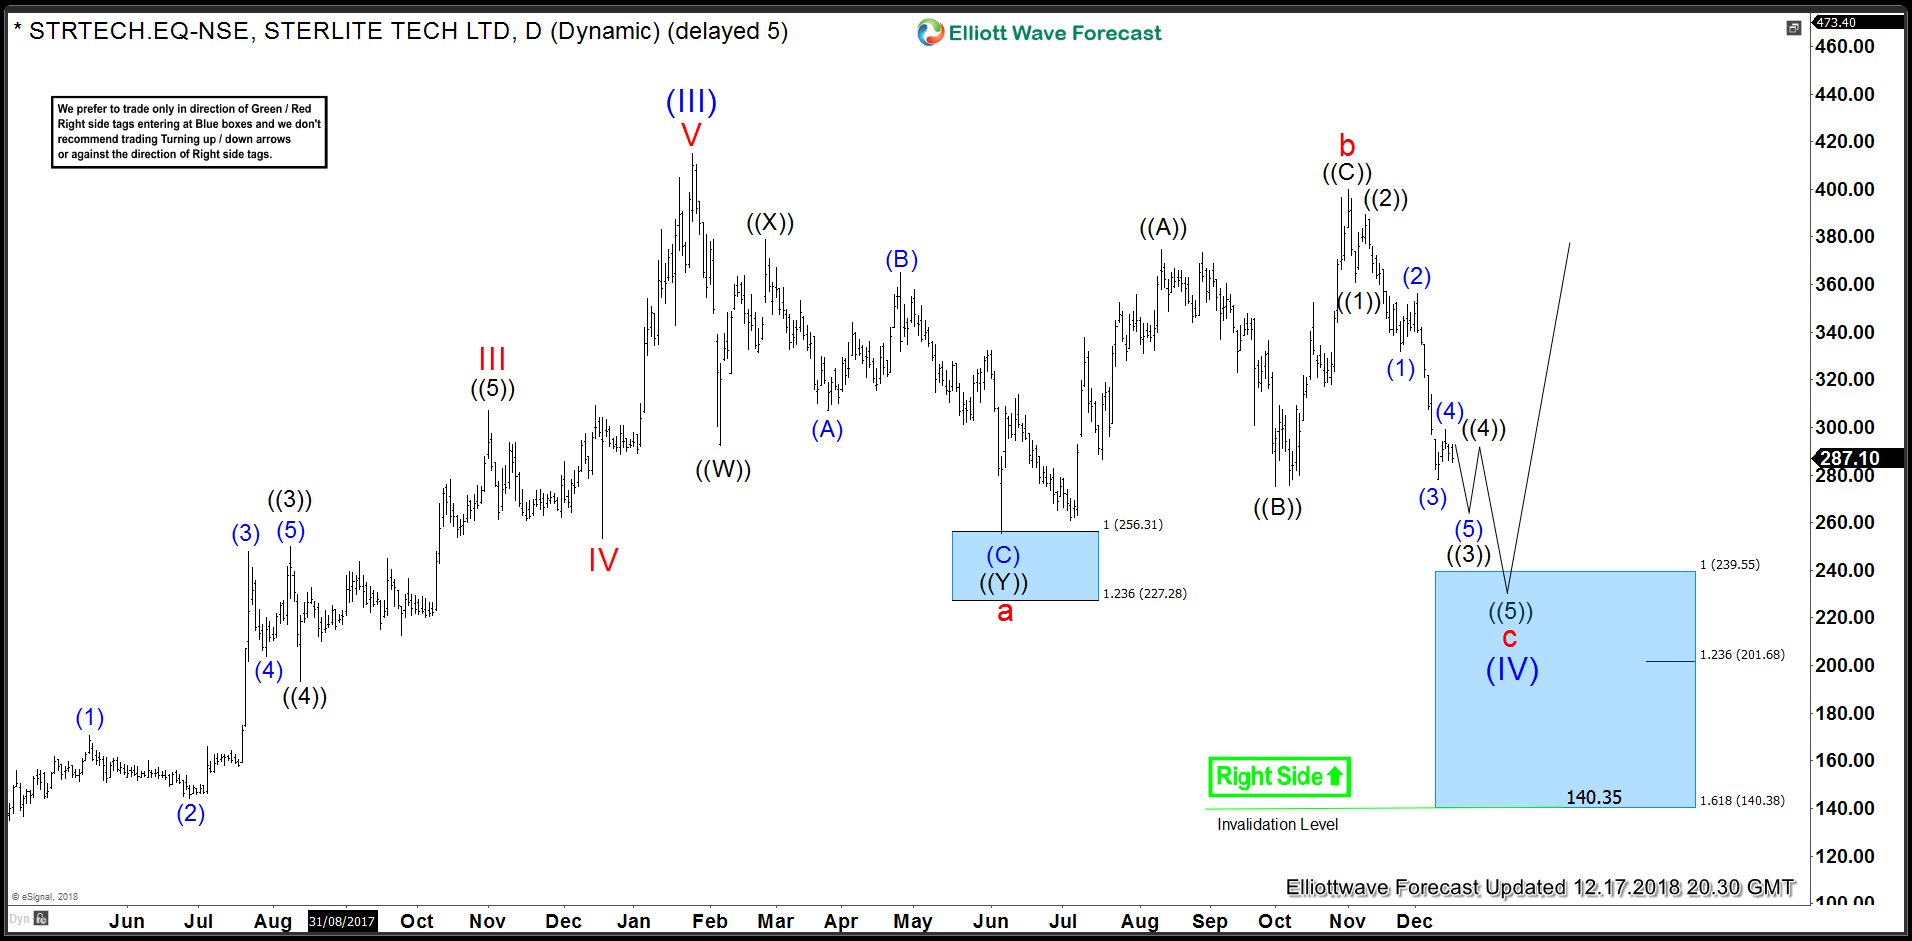
STRTECH (Sterlite Technologies): Elliott Wave FLAT Structure
Read MoreSterlite Technologies Ltd. (STRTECH) Sterlite Technologies Limited designs, builds and manages “smarter networks” Sterlite Tech develops & delivers optical communication products, network & system integration services and software solutions for telecoms globally. The company is listed on the Bombay Stock Exchange and the National Stock Exchange of India. The company changed its name to Technologies Limited’ from Dec.2006. It is India’s only integrated […]
-
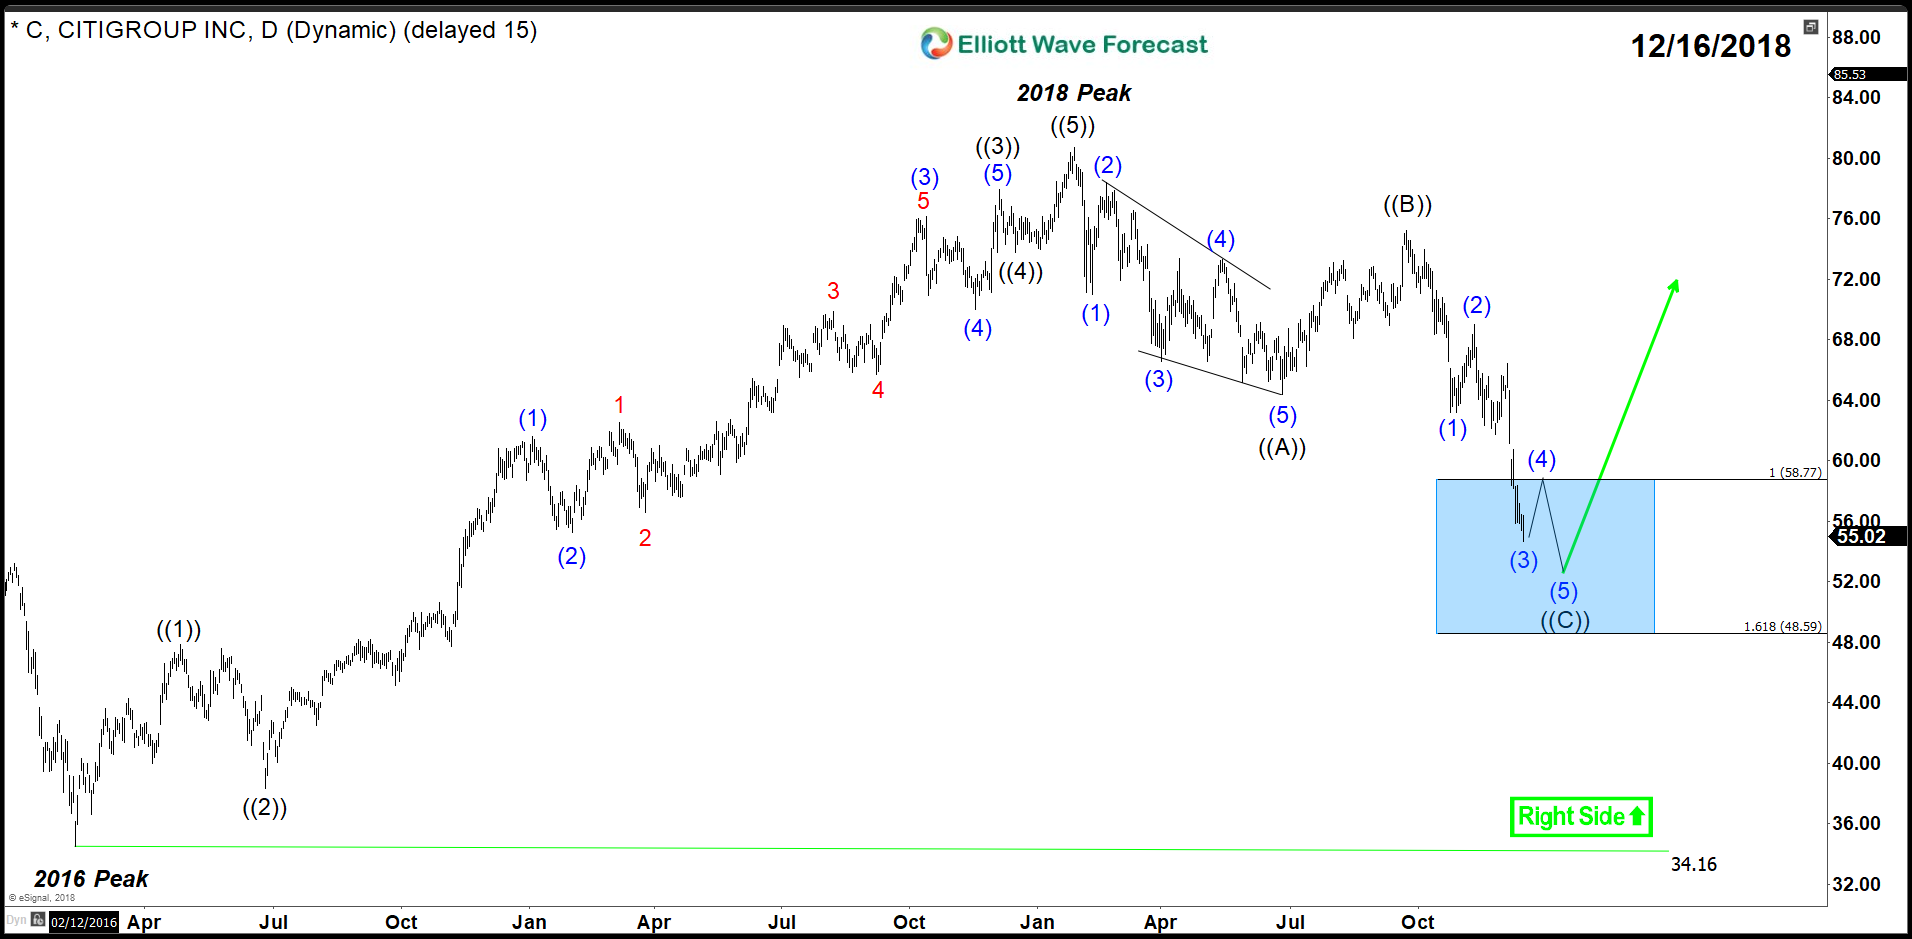
Citigroup (NYSE:C) – Time to Wake Up Bulls
Read MoreCitigroup (NYSE:C) is the 3rd largest bank in the United States. Since the crash of 2008, its stock wasn’t able to recover 15% of that decline compared to other Banks like JP Morgan or Goldman Sachs. 2018 wasn’t a good year for the entire market and Citigroup wasn’t any different as its stock price is currently […]
-

Elliott Wave Analysis: SPX Bounce Expected to Fail
Read MoreSPX has broken below Oct 30 low (2603.54), i.e. Primary wave ((W)), opening further downside with incomplete bearish sequence from Sept 21 high (2940.91). Near term Elliott Wave view suggests the decline to 2603.54 on Oct 30 low ended Primary wave ((W)). Bounce to 2815.6 ended Primary wave ((X)) as a zigzag Elliott Wave structure. Up […]