

The Power of 3-7-11 and the Grand Super Cycle: How We Saw the Bullish Turn in April 2025 Back on April 9, 2025, while World Indices were dropping sharply and global sentiment had turned overwhelmingly bearish, we published an article that challenged the fear-driven narrative. We explained why selling was not the right approach and […]
-
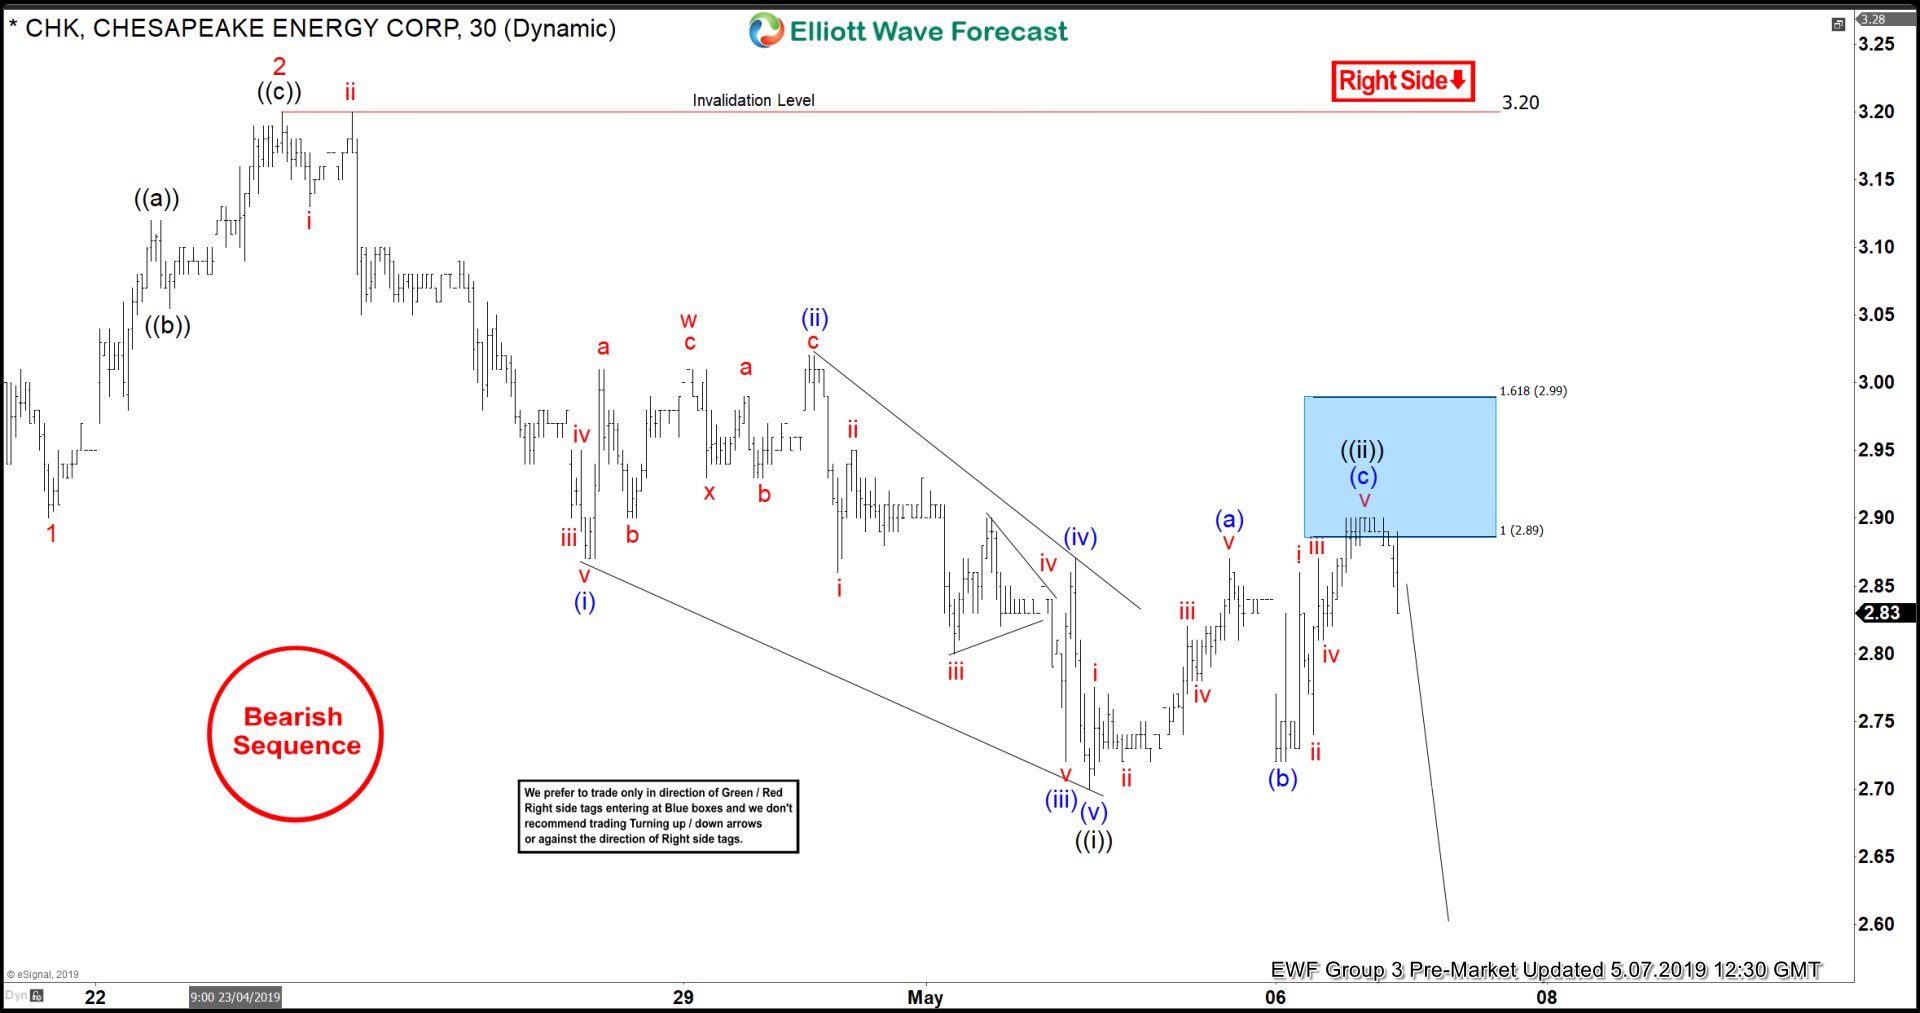
CHK Incomplete Bearish Sequences Calling The Decline
Read MoreHello fellow traders. In this technical blog we’re going to take a look at the charts of Chesapeake Energy Corporation Stock CHK published in members area of the website. As our members know CHK has had incomplete sequences in the cycle from the April 8th peak (3.57). Consequently , we advised clients to avoid buying […]
-
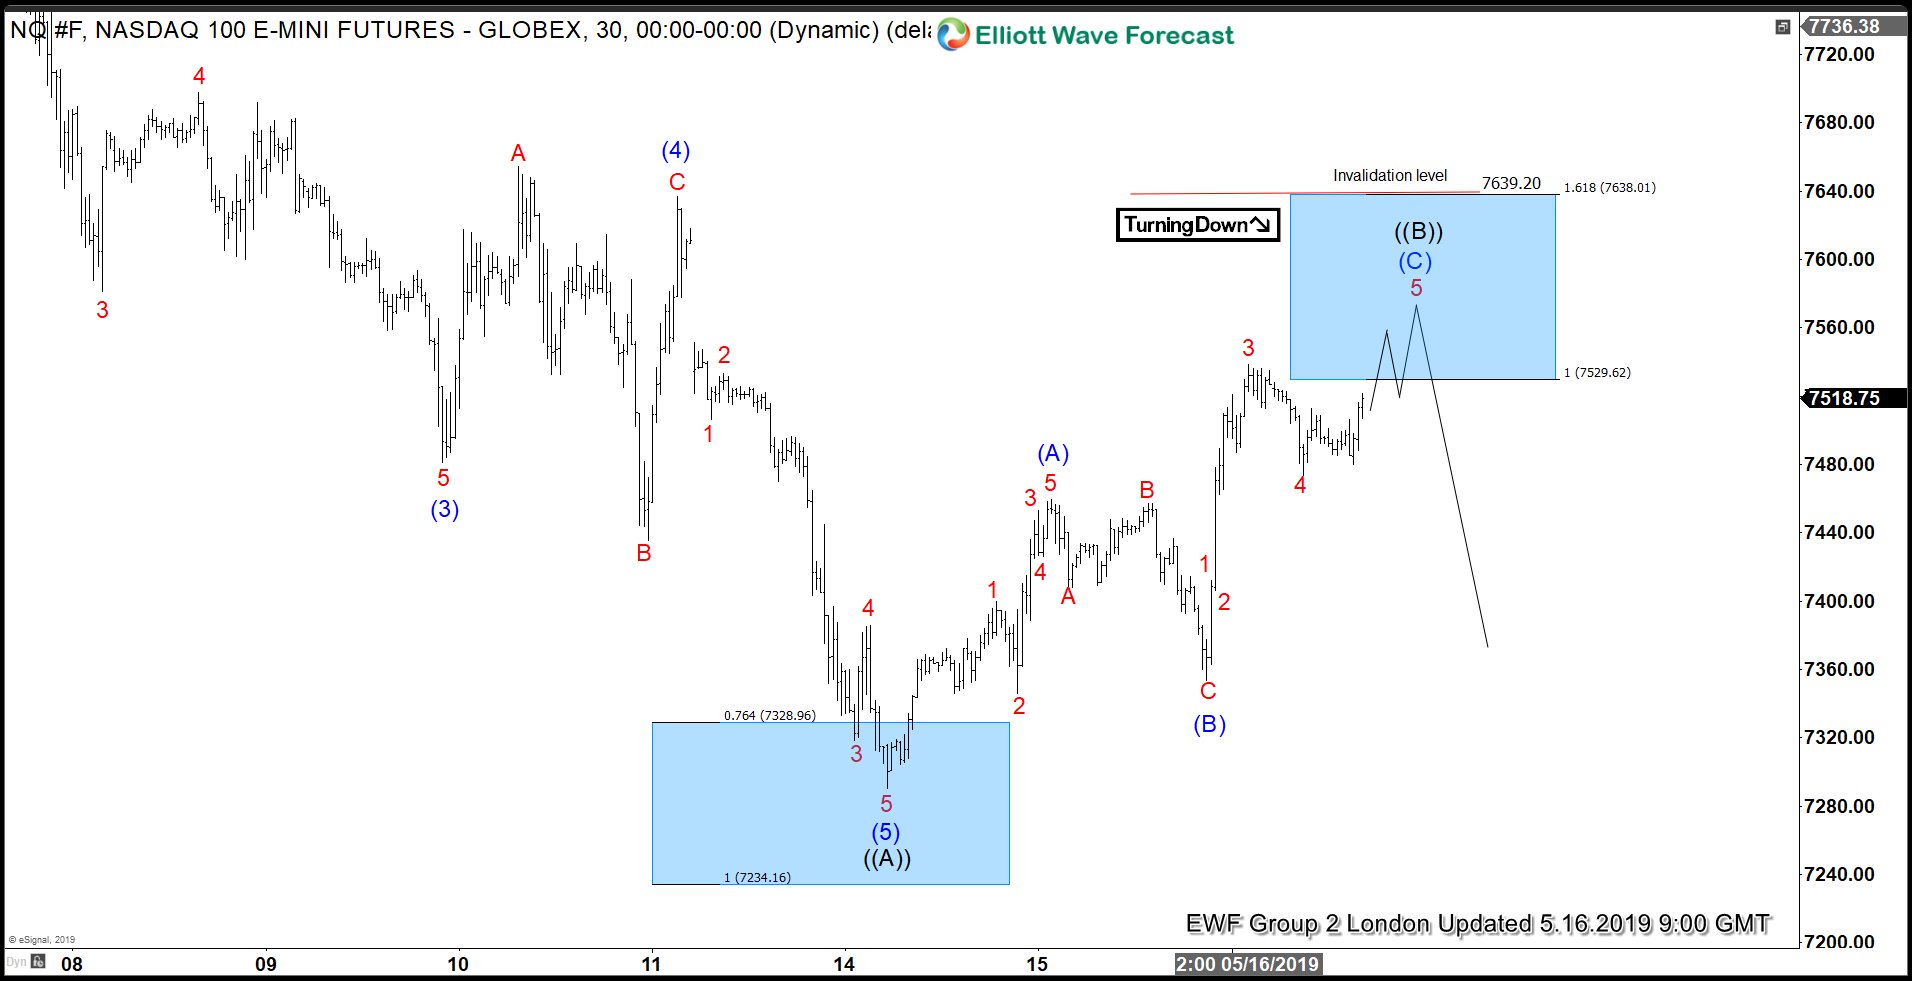
Elliott Wave View: Nasdaq Looking to Turn Lower
Read MoreNasdaq is correcting cycle from April 25 peak in 3, 7, or 11 swing but it’s expected to turn lower. This article & video explains the short term Elliott Wave path.
-
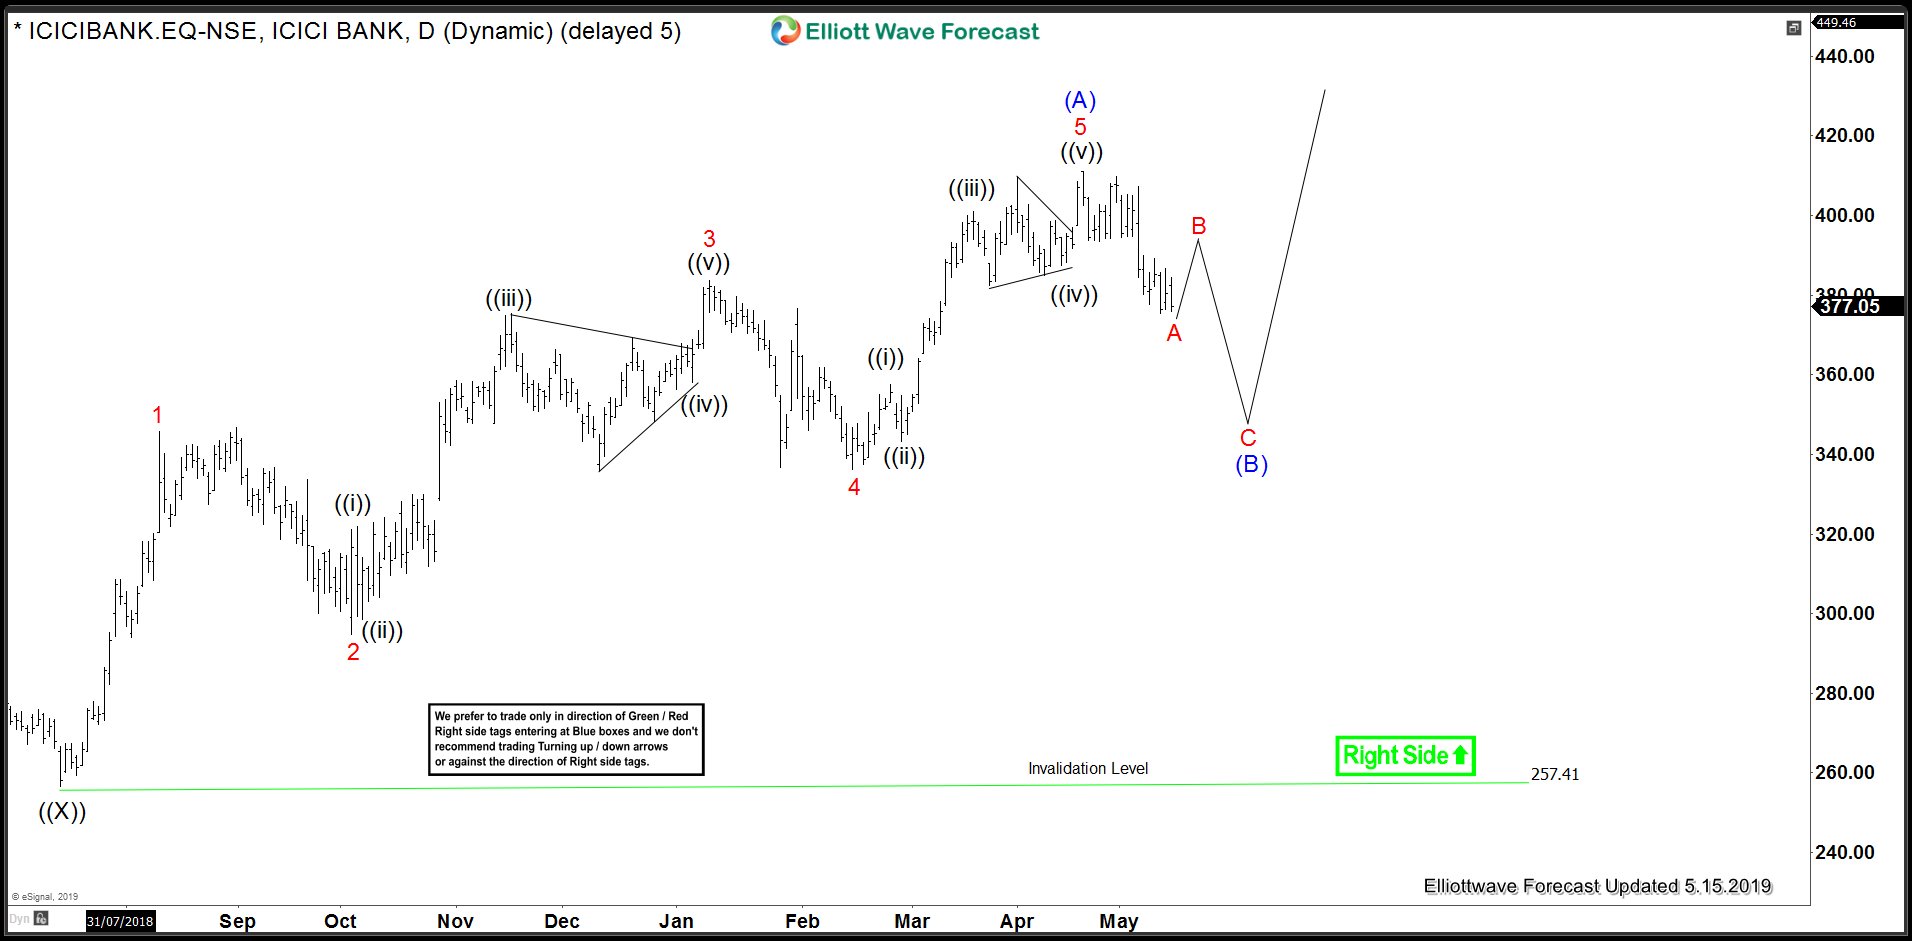
ICIC Bank Elliott Wave View Calls For Correction but Still Bullish
Read MoreICICI Bank Limited is an Indian multinational banking and financial services company headquartered in Mumbai, Maharashtra with its registered office in Vadodara, Gujarat. As of 2018, ICICI Bank is the second largest bank in India in terms of assets and market capitalisation. In this technical blog, we would take a look at the cycle since […]
-
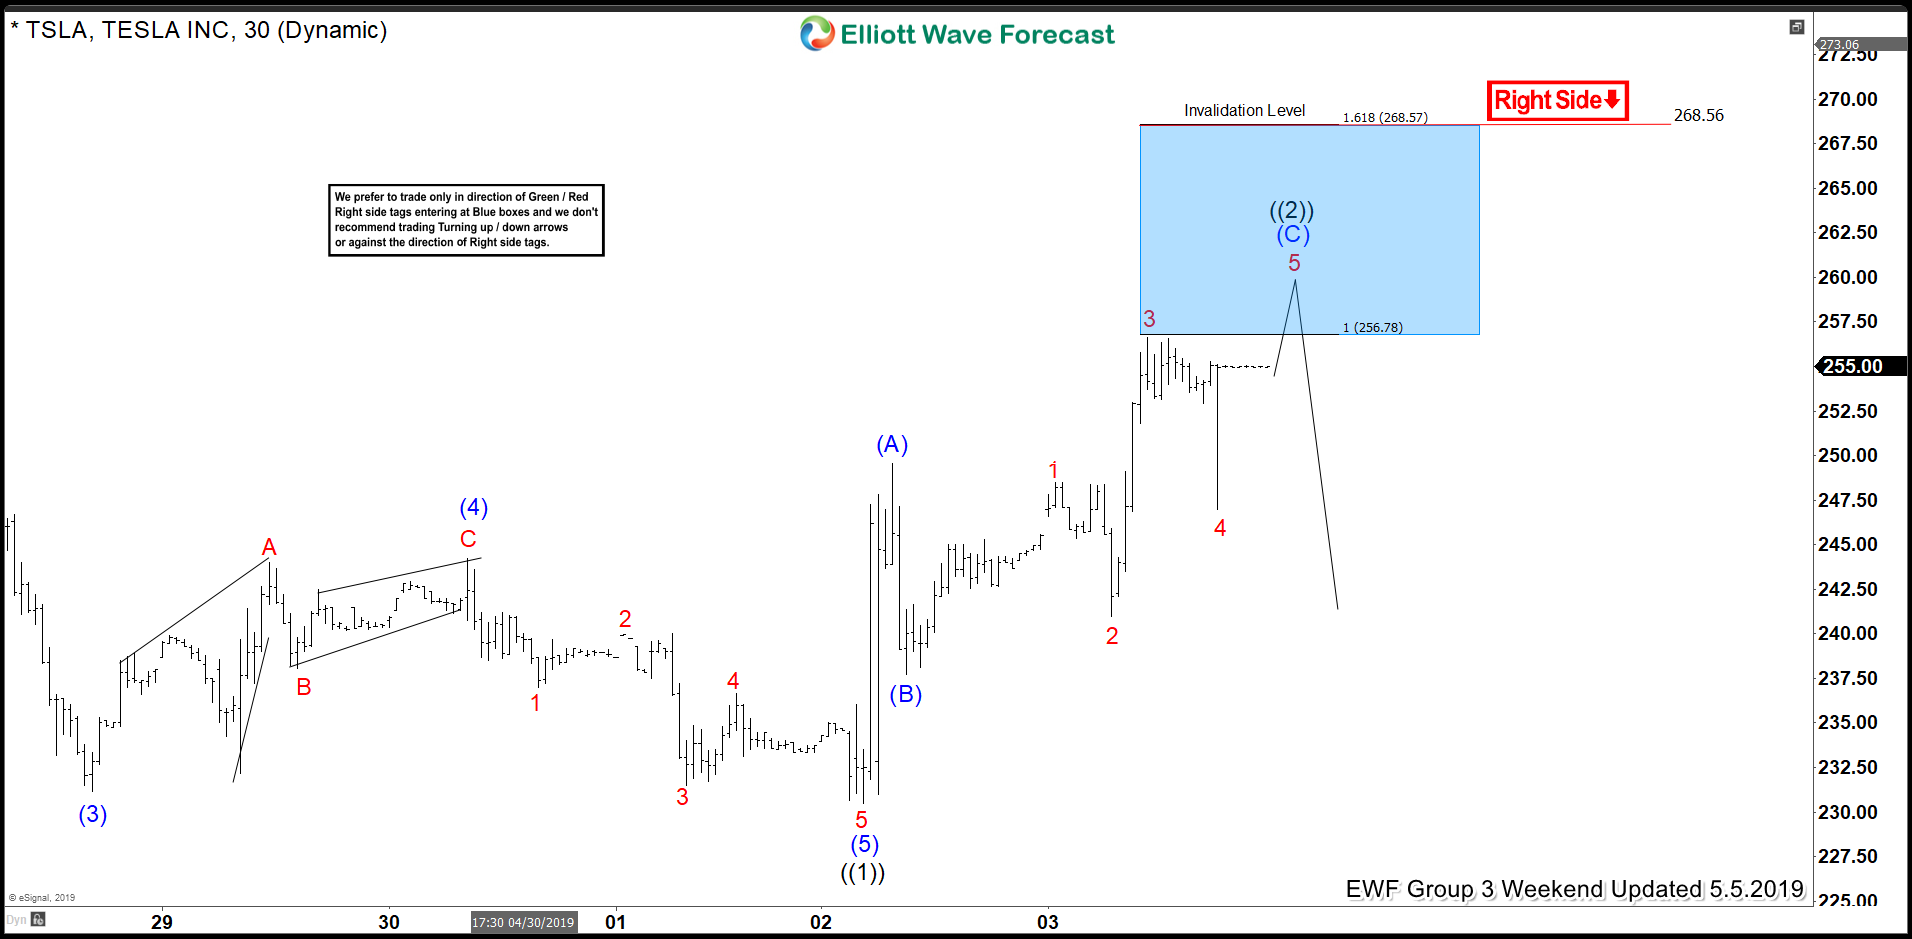
Elliott Wave Analysis: Forecasting the Decline In TESLA
Read MoreIn this blog, I want to share with you some Elliott Wave charts of Tesla which we presented to our members earlier this month. You see the 1-hour updated chart presented to our clients on the 5/5/19. Tesla had a 1-hour right side tag against 268.56 peak suggesting more downside at that time. Tesla ended the cycle from […]
-
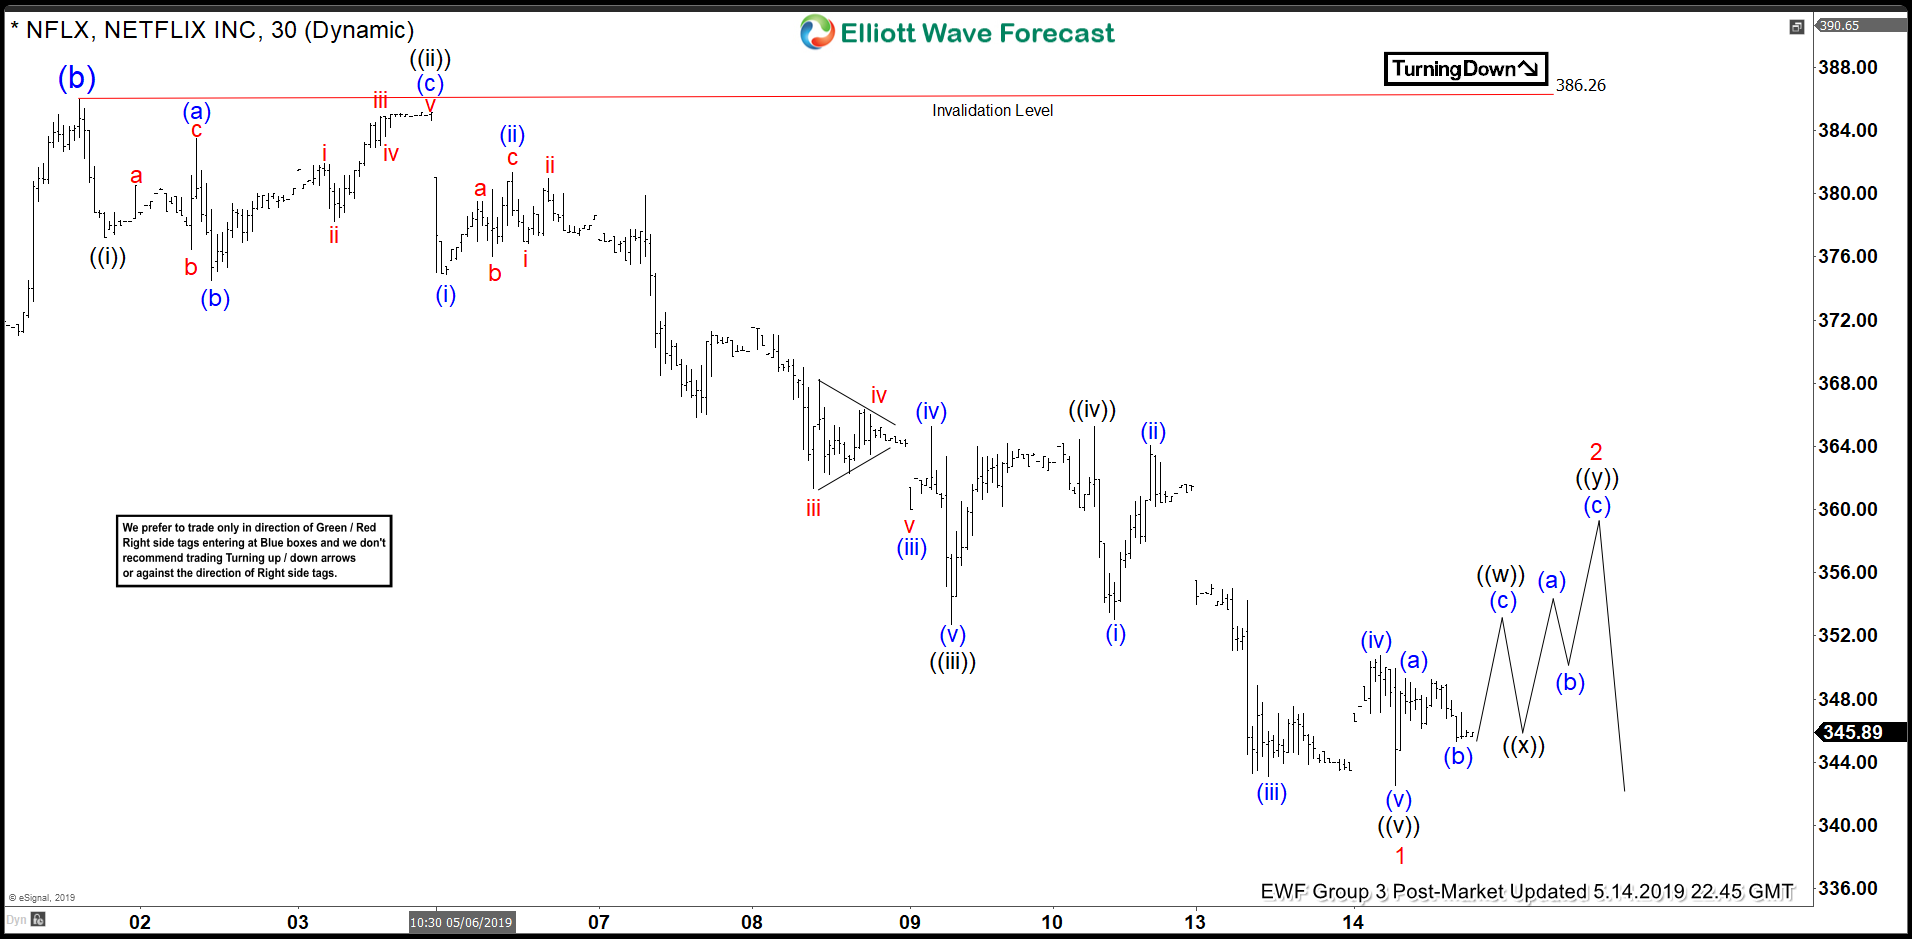
Elliott Wave View: Rally in Netflix Expected to Fail
Read MoreNetflix shows a 5 waves impulse move from May 2, suggesting further downside. This article & video talks about the short term Elliott Wave path.
-
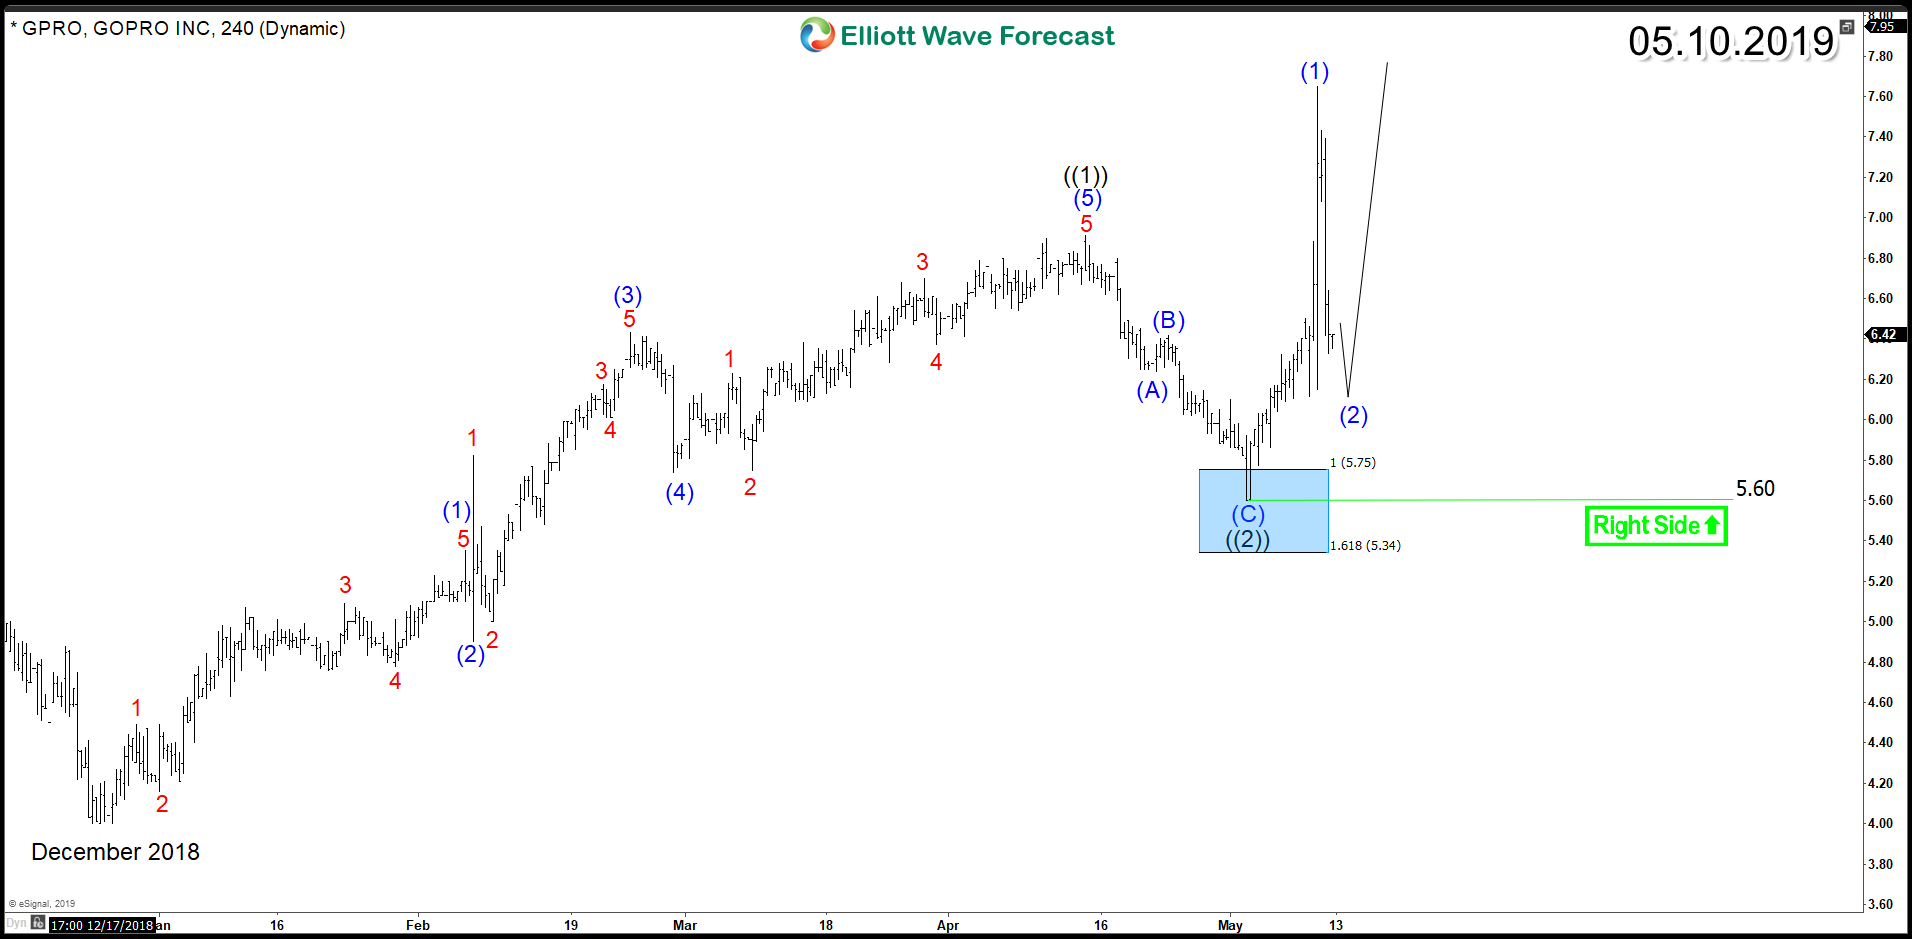
GoPro (NASDAQ: GPRO) Aiming for Technical Recovery
Read MoreGoPro (NASDAQ: GPRO) is an American technology company founded in 2002 and it was listed on the NASDAQ stock exchange on June 25, 2014. It manufactures action cameras and develops its own mobile apps and video-editing software. The company year on year earnings growth rate was negative over the past 5 years and its stock lost […]