

The Power of 3-7-11 and the Grand Super Cycle: How We Saw the Bullish Turn in April 2025 Back on April 9, 2025, while World Indices were dropping sharply and global sentiment had turned overwhelmingly bearish, we published an article that challenged the fear-driven narrative. We explained why selling was not the right approach and […]
-
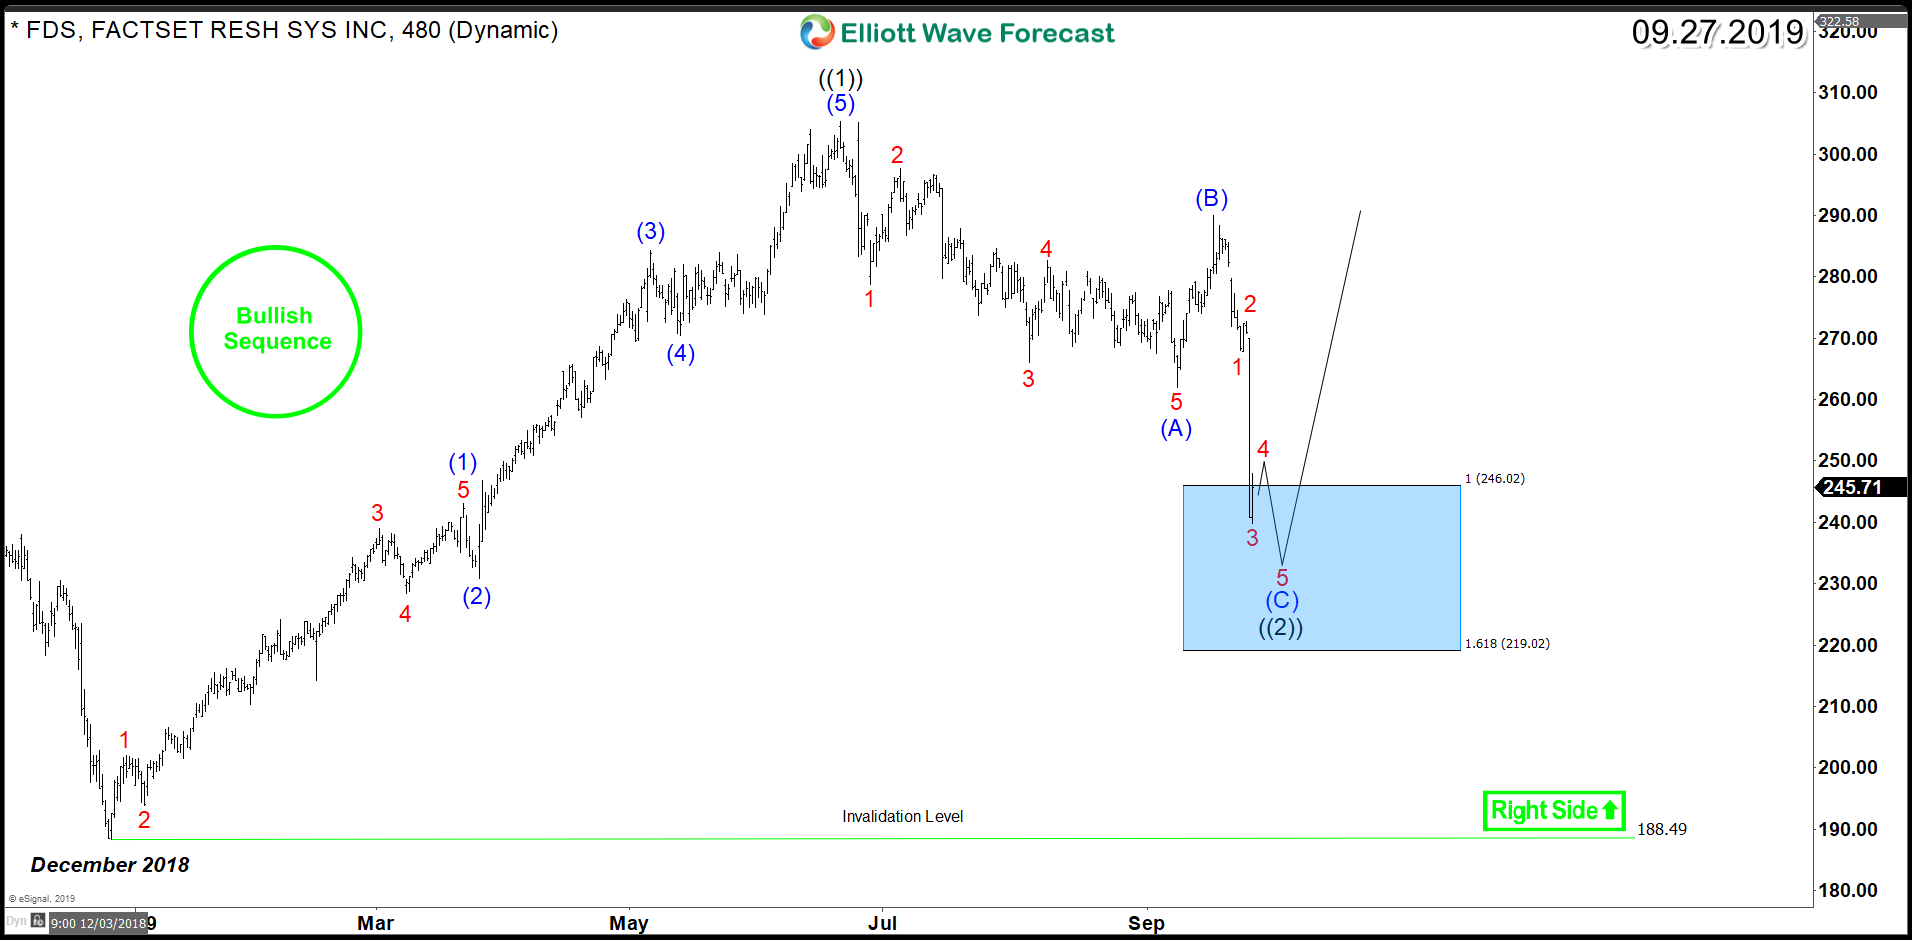
FactSet Research Systems (NYSE: FDS) Technical correction
Read MoreFactSet Research Systems (NYSE: FDS) is a financial data and software company providing financial information and analytic software for investment professionals in the United States, Europe, and the Asia Pacific. Shares of FactSet dropped 11% following the release of fiscal its fourth-quarter financial results despite beating analysts’ forecast. Revenue climbed 5%, lifting adjusted net income by 19% […]
-
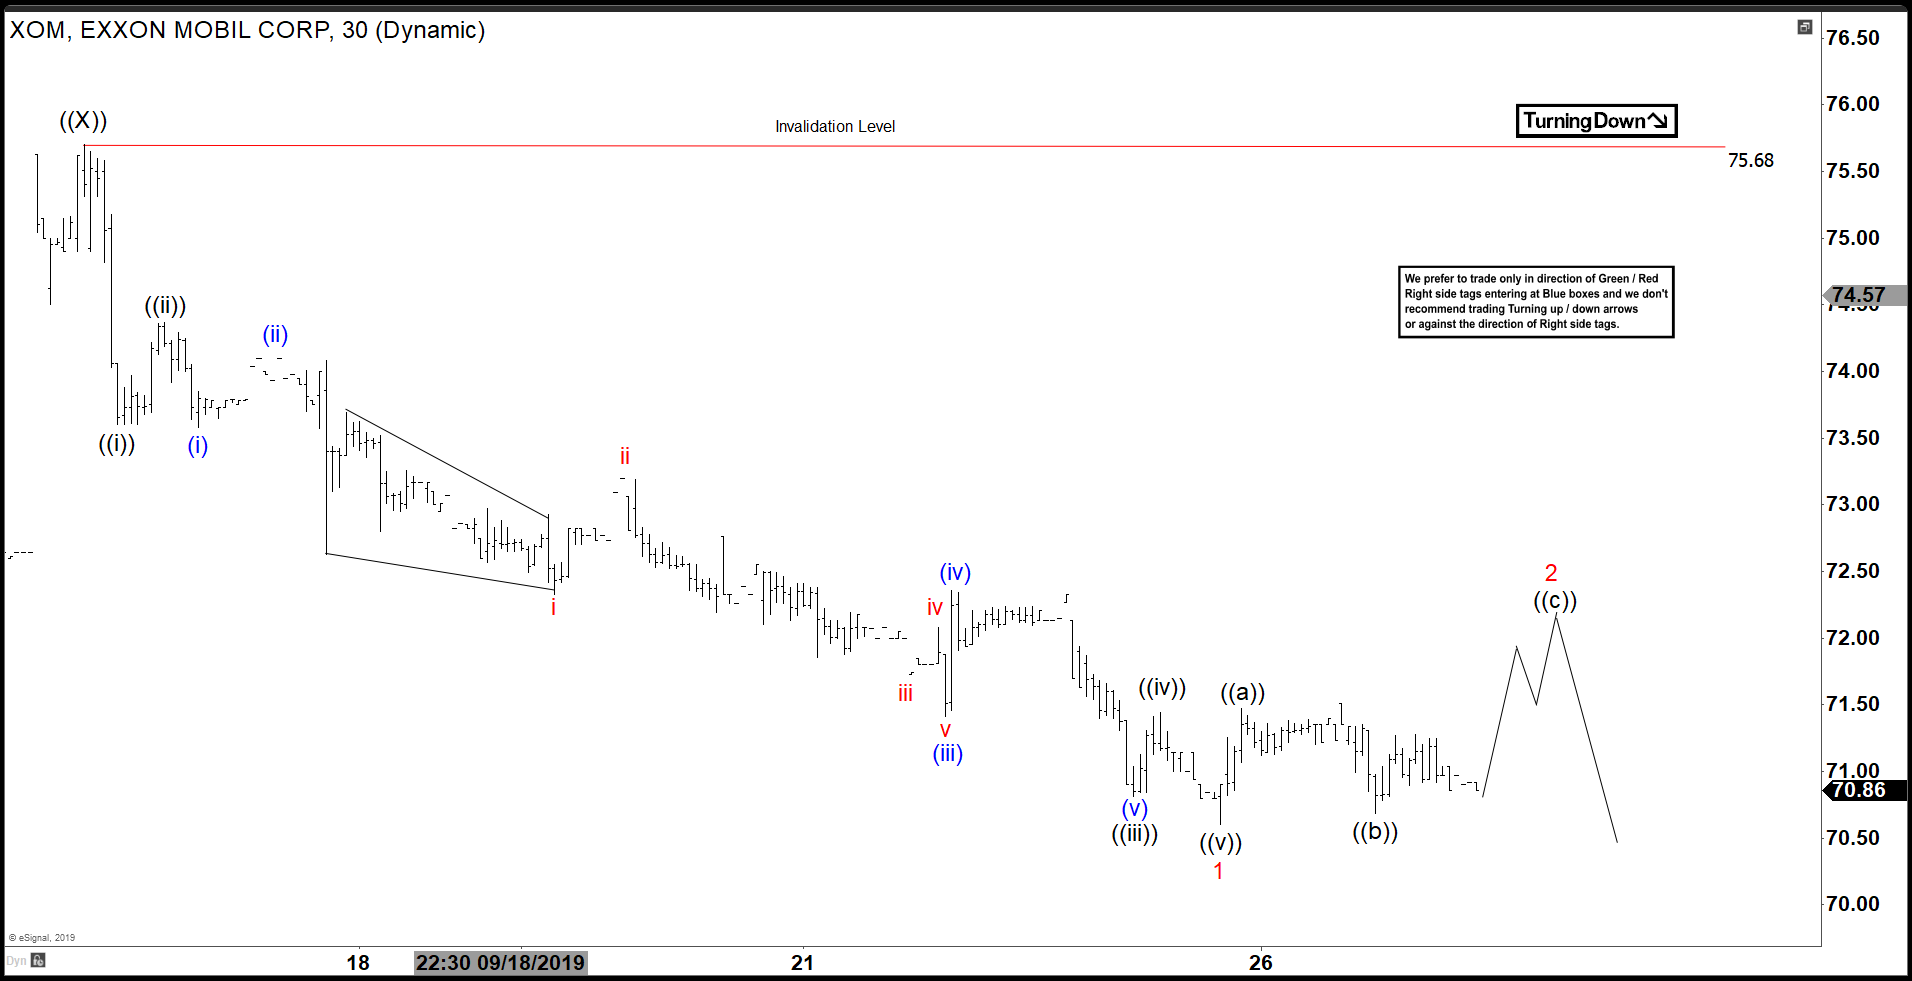
Elliott Wave View: Further Downside in Exxon Mobil (XOM)
Read MoreShort term Elliott Wave view on Exxon Mobil (ticker: XOM) suggests the rally to 75.68 on September 16, 2019 high ended wave ((X)). The stock has turned lower and the structure of the decline unfolded as a 5 waves impulse Elliott Wave structure. Down from 75.68, wave ((i)) ended at 73.6 and bounce to 74.37 ended […]
-
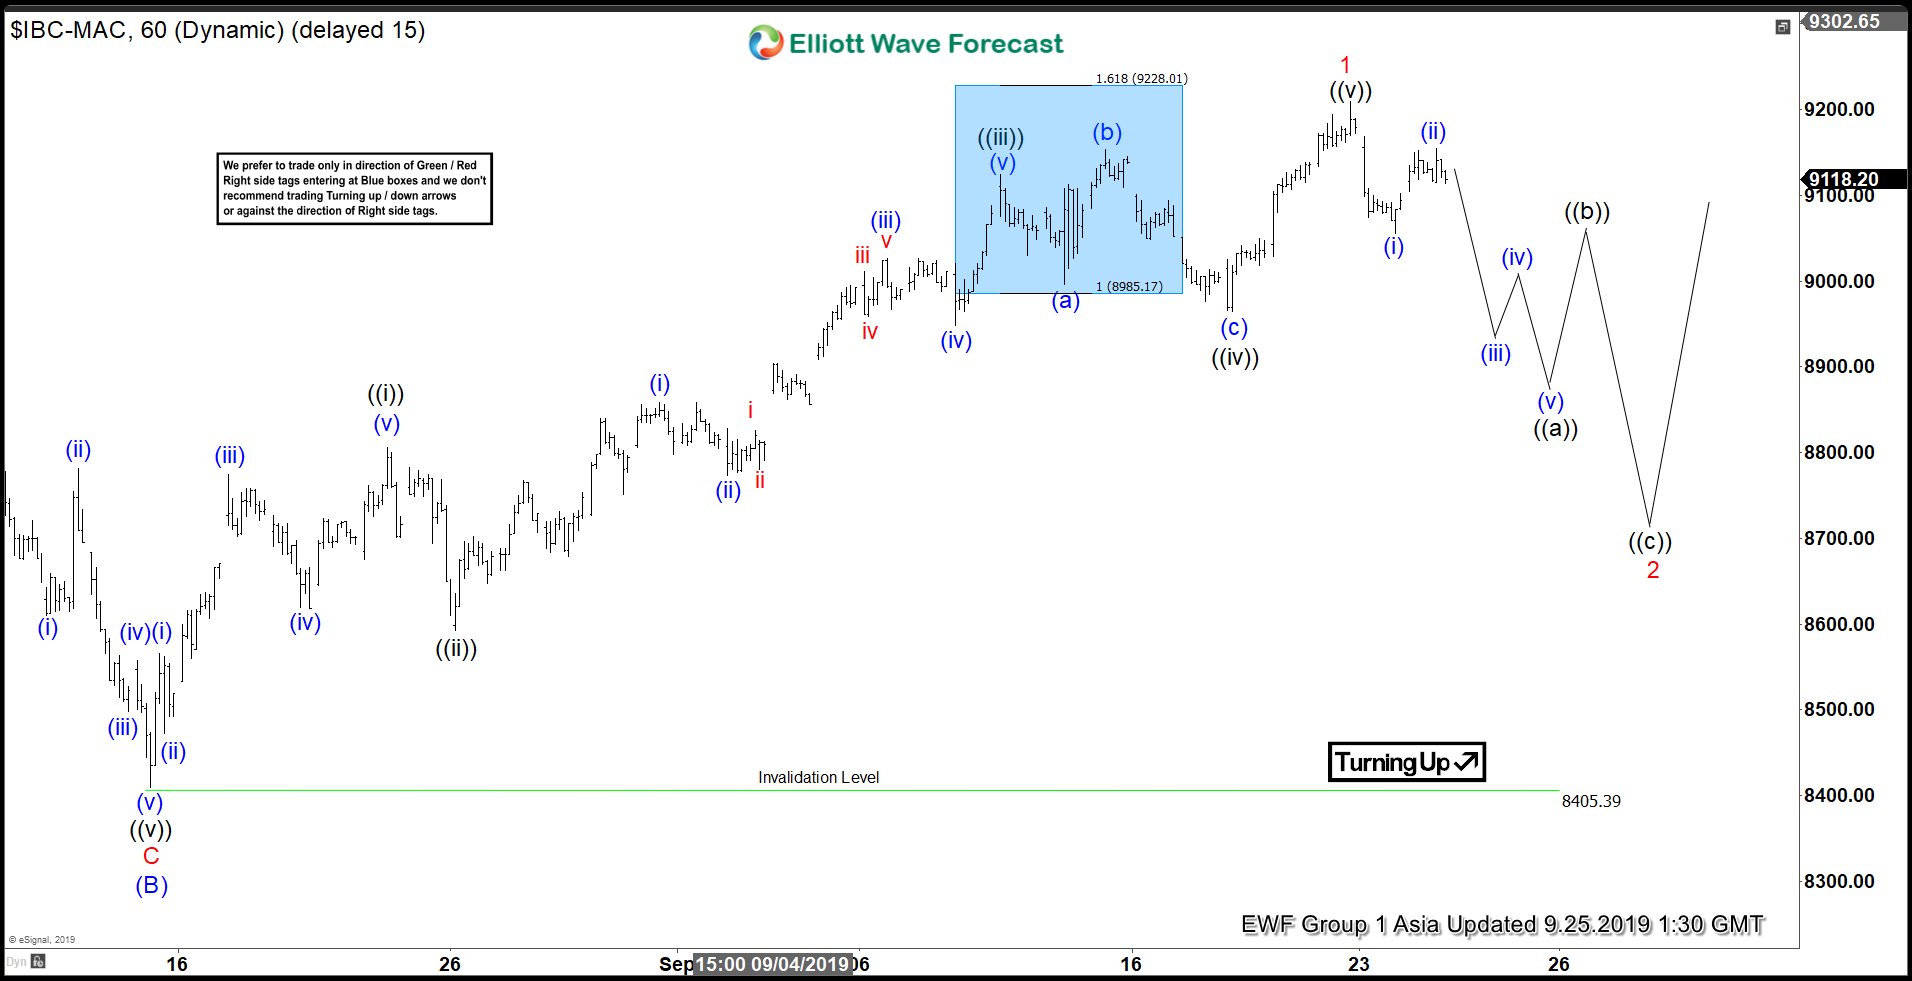
Elliott Wave View: IBEX Ended Impulsive Rally
Read MoreShort term Elliott Wave view on IBEX calls the rally from August 15, 2019 low (8405.39) as a 5 waves impulse Elliott Wave structure. Up from 8405.3, wave ((i)) ended at 8806.4 and wave ((ii)) pullback ended at 8592.70. Index then resumed higher in wave ((iii)) towards 9123.9, wave ((iv)) pullback ended at 8964, and […]
-
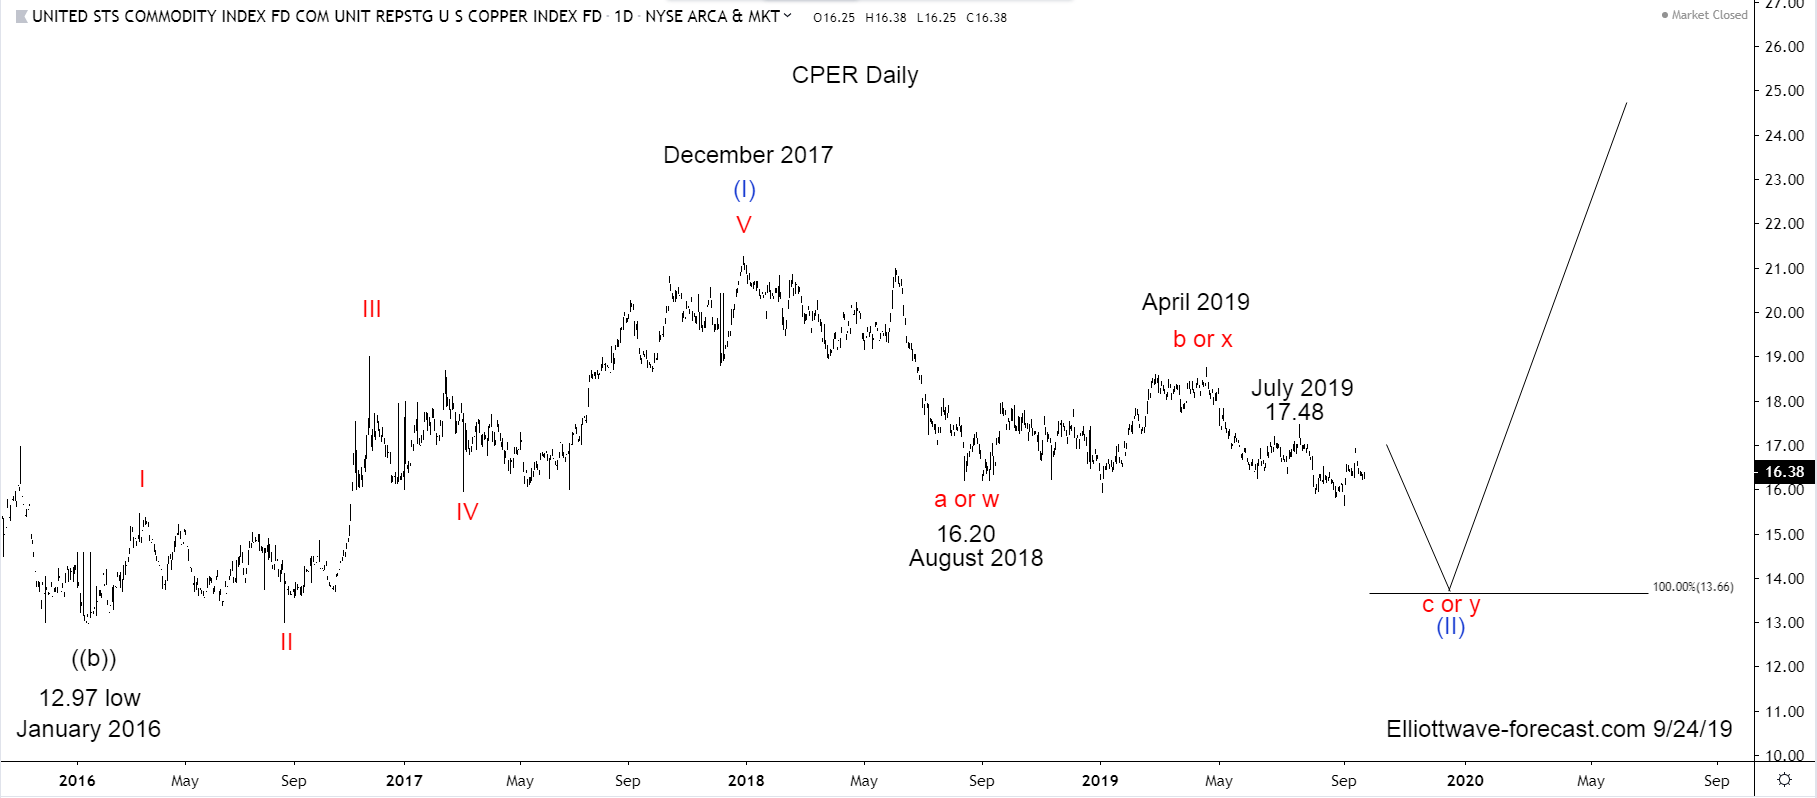
CPER Copper Index Tracker Long Term Cycles & Elliott Wave
Read MoreCPER Copper Index Tracker Long Term Cycles & Elliott Wave Firstly the CPER Copper Index Tracking instrument has an inception date of 11/15/2011. There is data in the HG_F copper futures before this going back many years. That shows copper made an all time high on February 15th, 2011 at 4.649. Translated into this instrument, it is […]
-
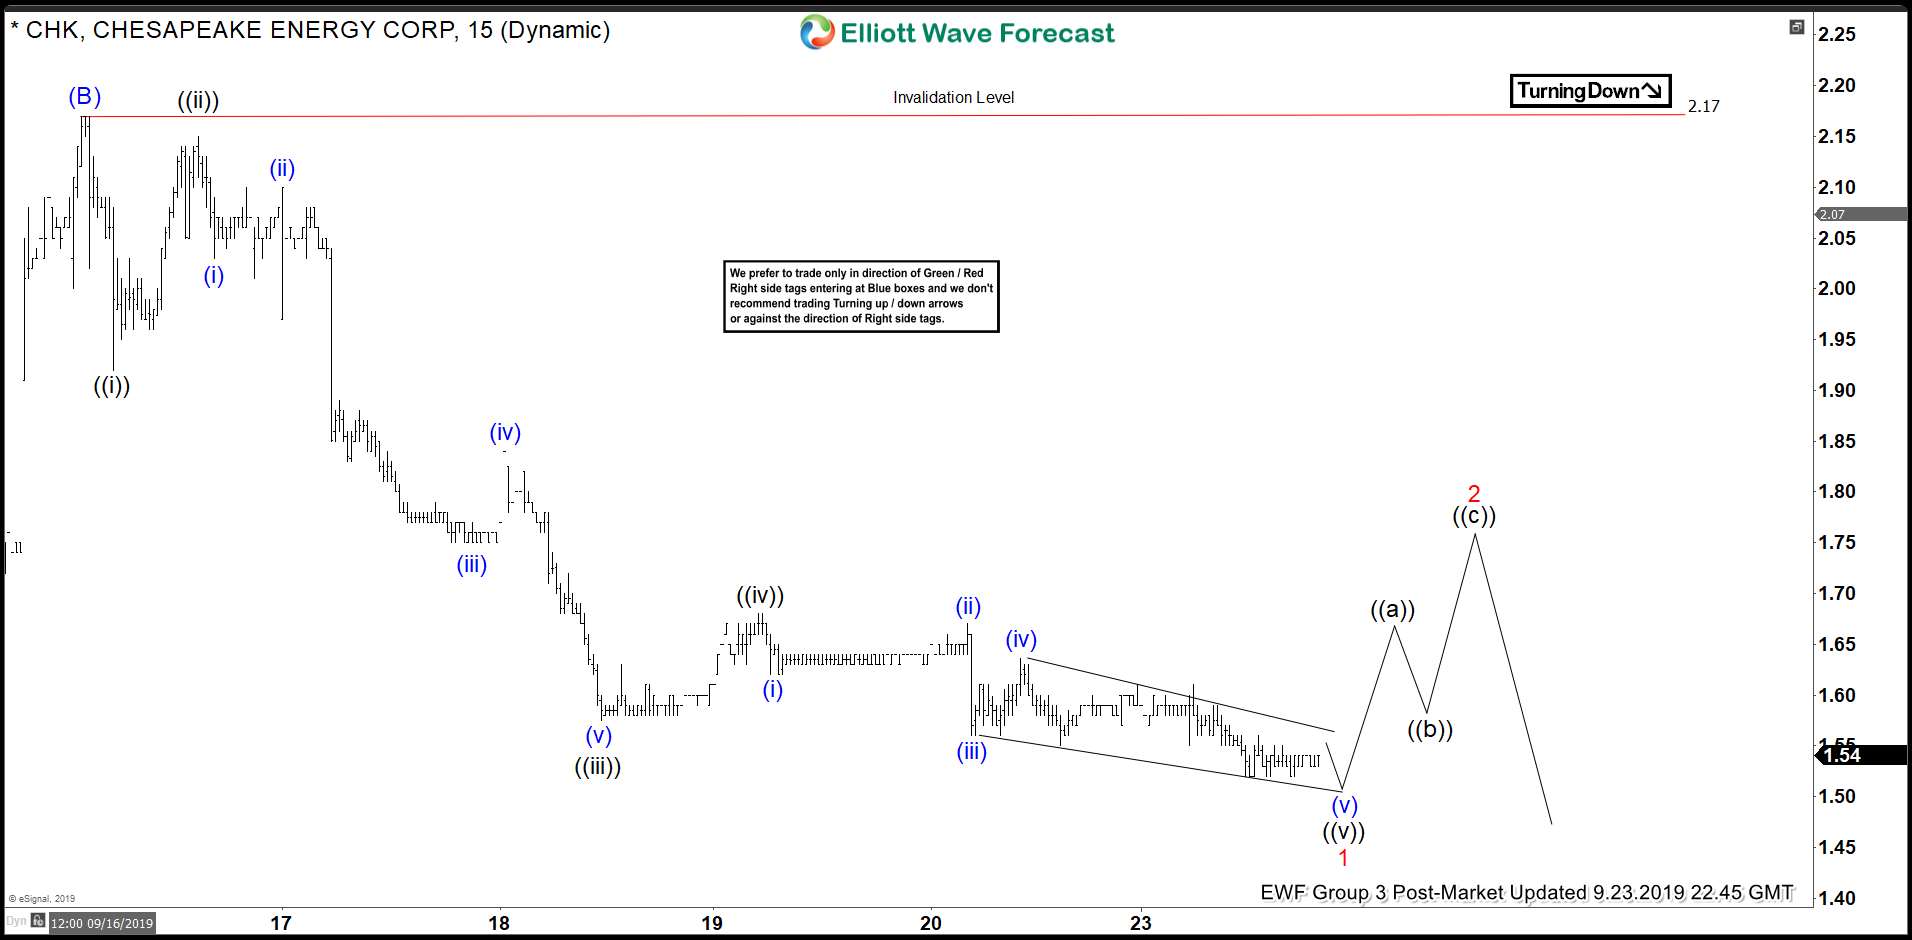
Elliott Wave View: Chesapeake Energy (CHK) Should See More Downside
Read MoreElliott Wave view on Chesapeake Energy Corp (ticker symbol: CHK) suggests the rally to 2.17 ended wave (B). This suggests the stock has turned lower in wave (C) and can break below August 7 low (1.26). The stock however needs to break below 1.26 to confirm the bearish view and avoid a double correction in […]
-

Microsoft Elliott Wave View: Why It Will Be Supported Into $157.78-$172.77 Area
Read MoreMany Instruments across the Market are ending the Super Cycle Degree from their 2009 lows. In this blog we will have a more in-depth view of Microsoft. With the break of last year high earlier this year, the instrument can be counted as a 5 waves advance from its 2009 low. Consequently, it is trading […]