

The Power of 3-7-11 and the Grand Super Cycle: How We Saw the Bullish Turn in April 2025 Back on April 9, 2025, while World Indices were dropping sharply and global sentiment had turned overwhelmingly bearish, we published an article that challenged the fear-driven narrative. We explained why selling was not the right approach and […]
-
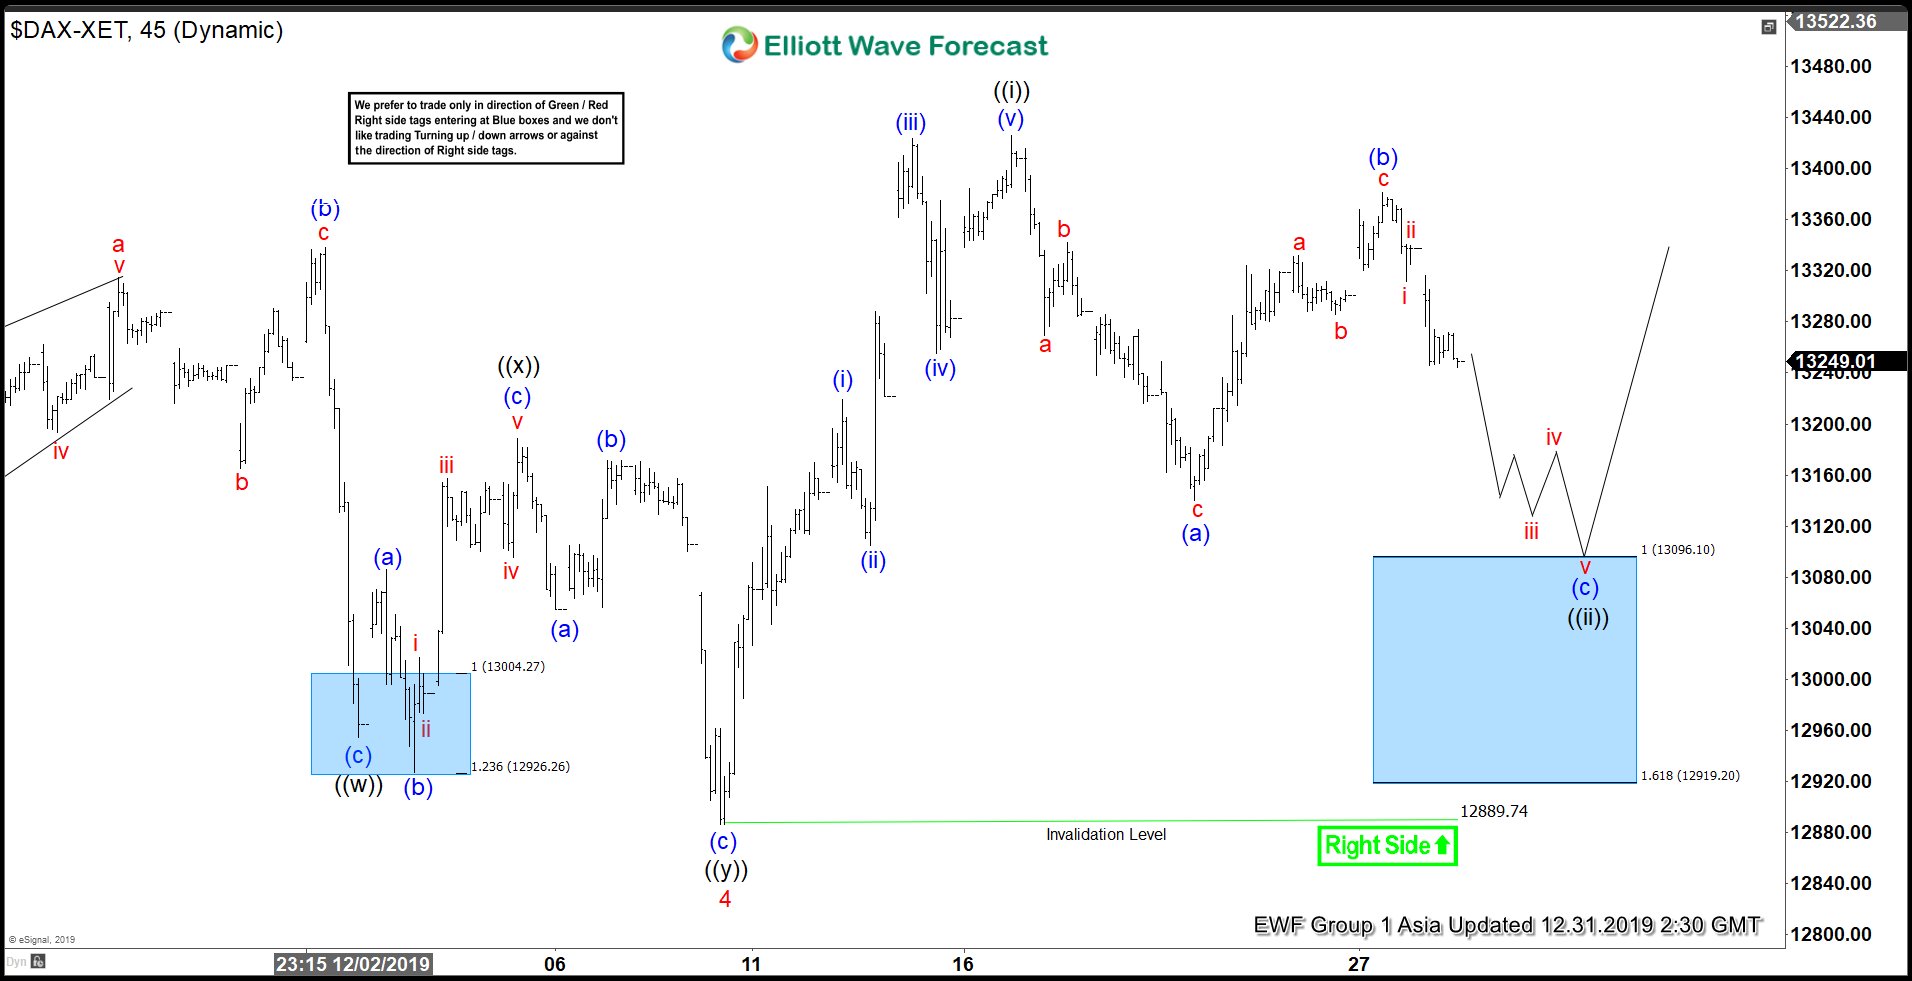
Elliott Wave View: Support Area in $DAX
Read MoreElliott Wave view in $DAX suggests that the cycle from December 27, 2018 low remains incomplete and ideally reaches 13652 – 14217 area. As a result, the Index can still see further upside and dips can continue to find support. Short term Elliott Wave chart below suggests the decline to 12889.7 on December 10, 2019 […]
-
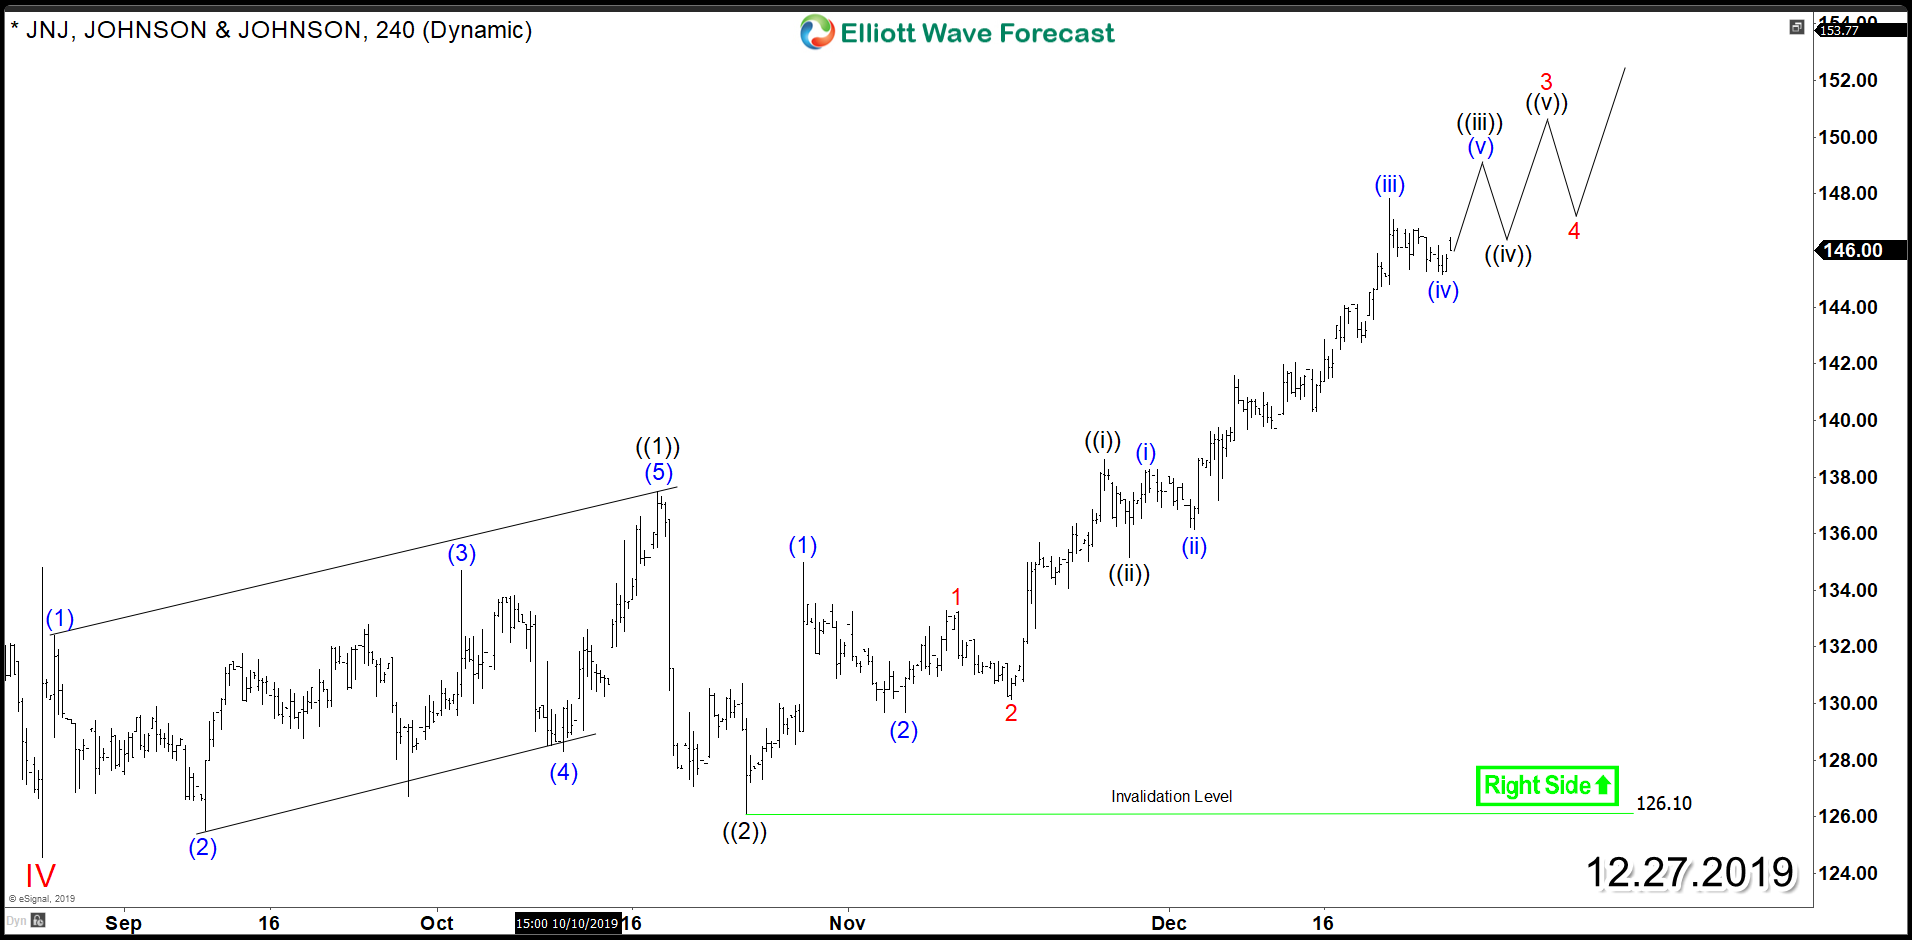
JNJ Bullish Outlook Suggests Further Upside for Next Year
Read MoreJohnson & Johnson (NYSE: JNJ) released its third-quarter earnings and revenue in mid October 2019 which beat Wall Street’s expectations. Despite facing a sell-off during that week, the stock managed to establish a major low in October and it has been rallying higher since then looking to challenge 2018 peak. Let’s take a look at the […]
-
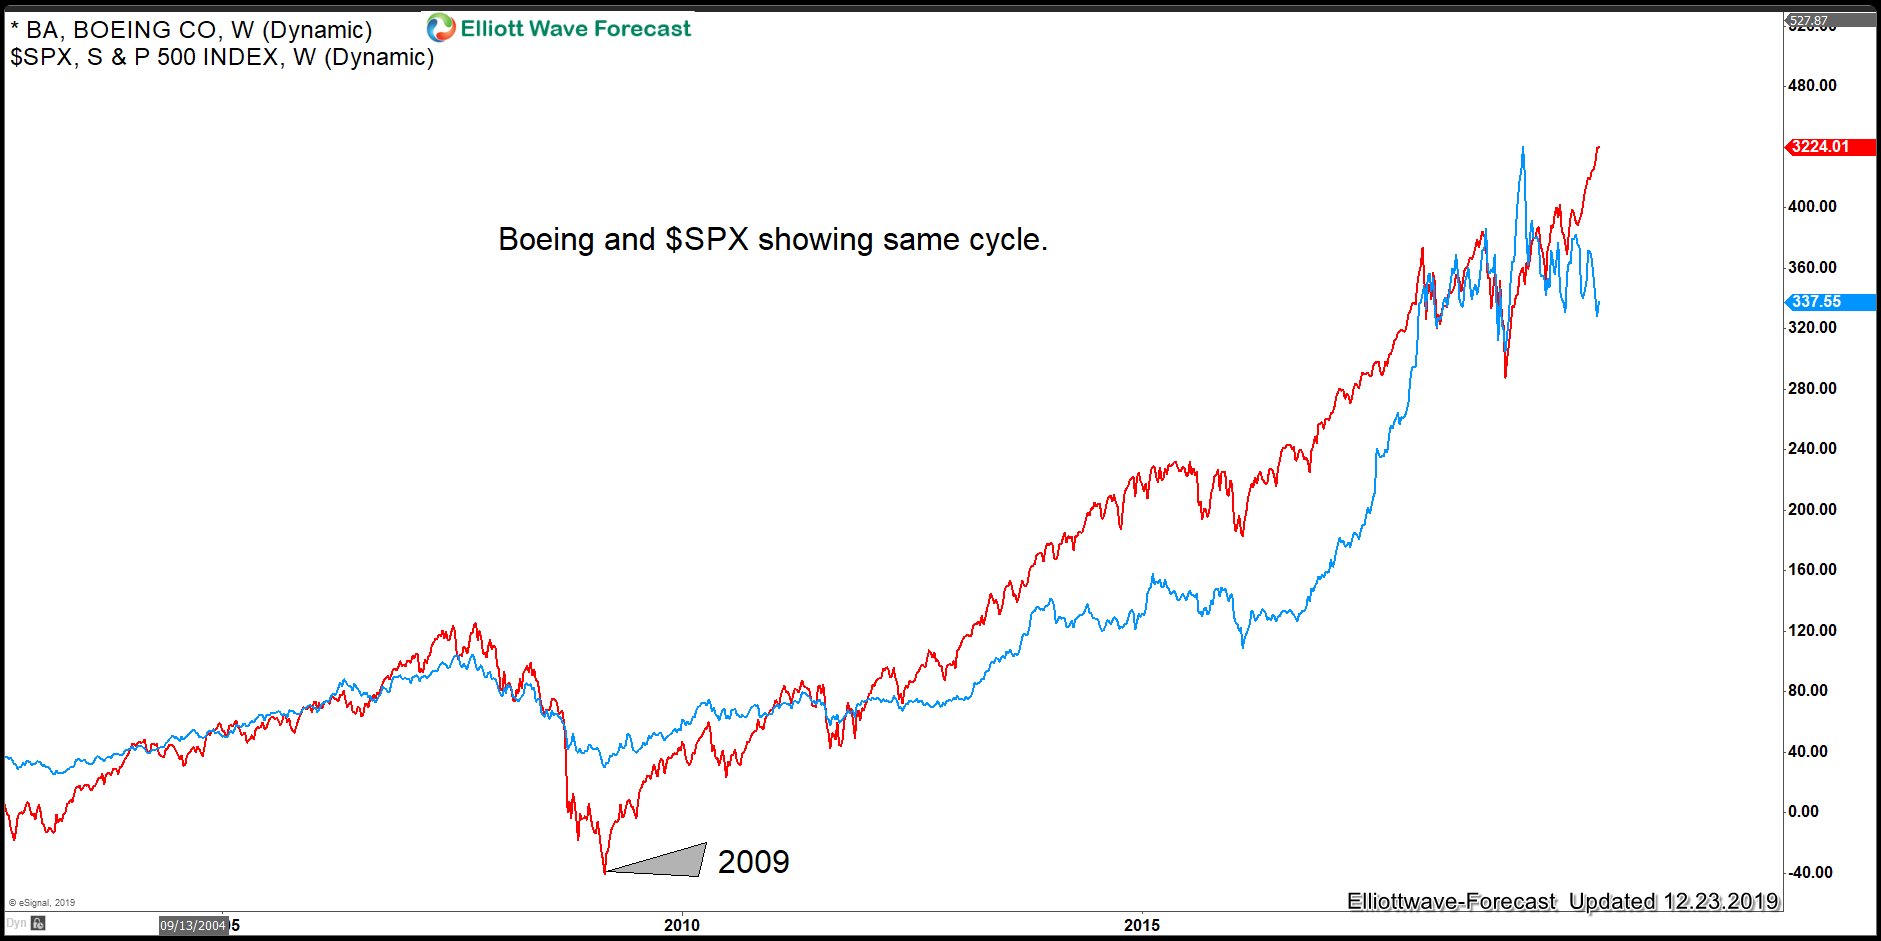
Boeing ($BA): Path Remains Clear, Even With C.E.O. Fired
Read MoreThe Boeing is trading within a very technical area and it is showing a very clear 5 waves advance Elliott wave structure from its 2003 lows.
-
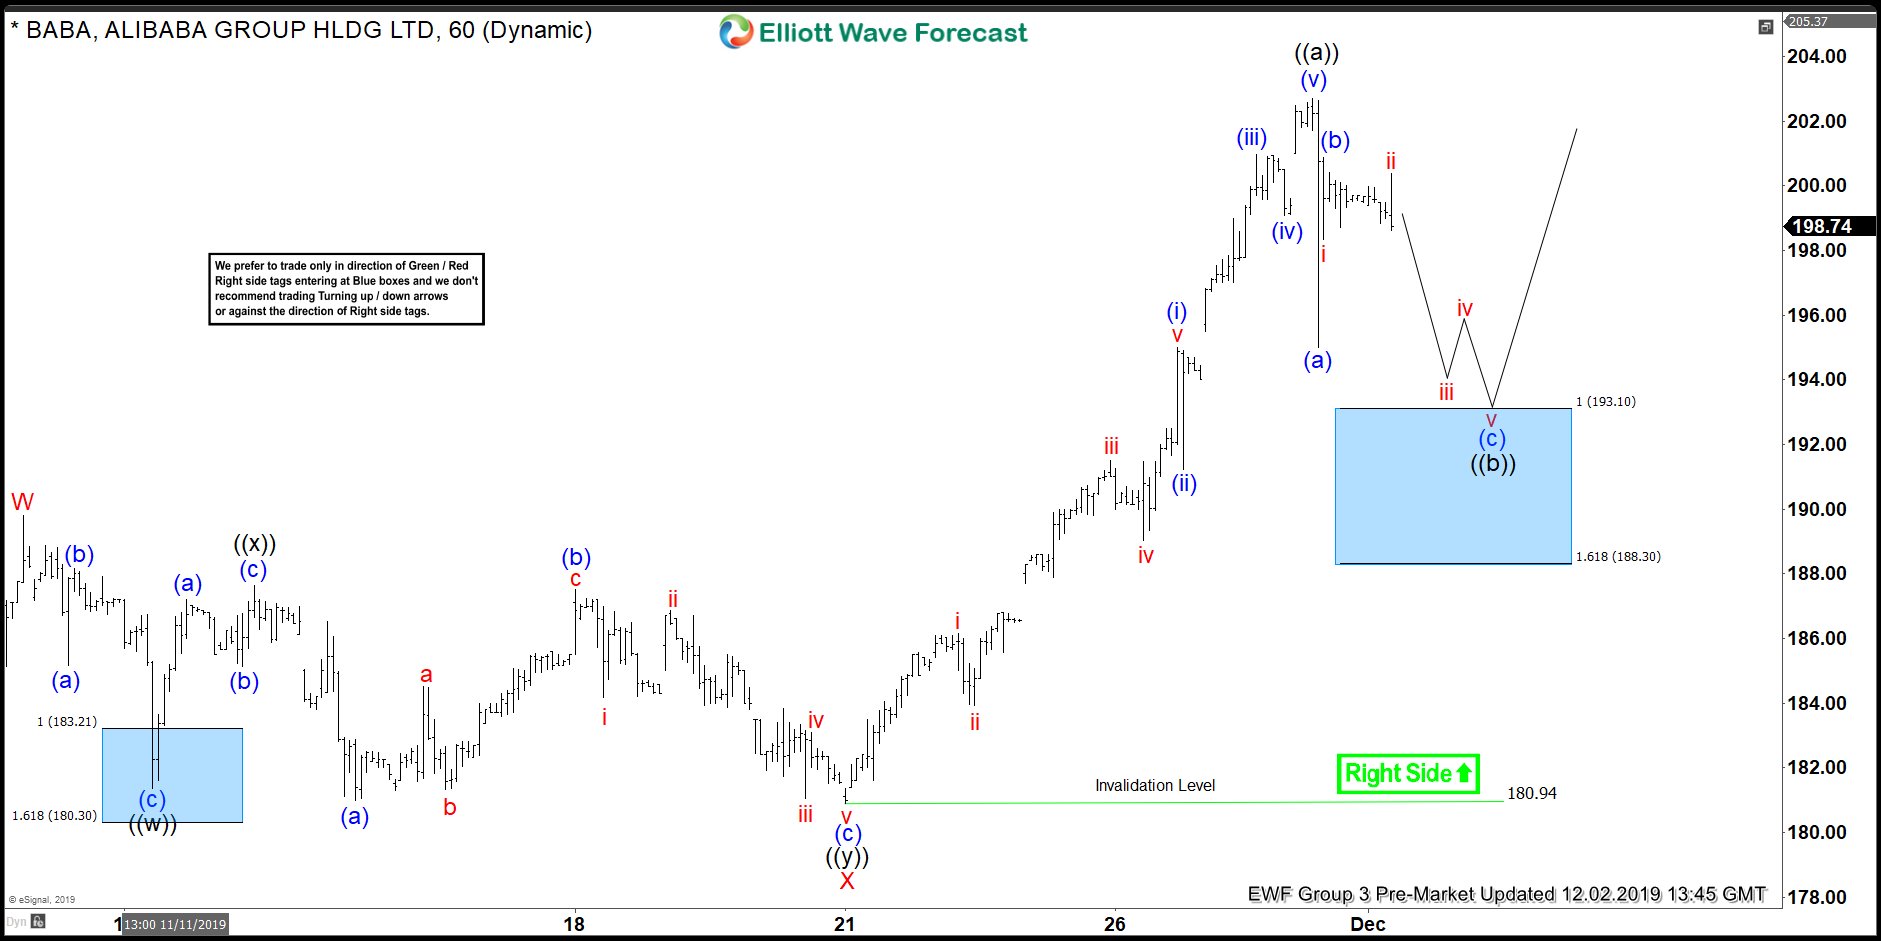
BABA Forecasting The Rally From The Blue Box
Read MoreHello fellow traders. In this technical blog we’re going to take a quick look at the Elliott Wave charts of BABA Stock published in members area of the Elliottwave-Forecast . As our members know, BABA is showing incomplete sequences in the cycle from the December 2018 low (129.61). Break above 3rd May peak made higher […]
-
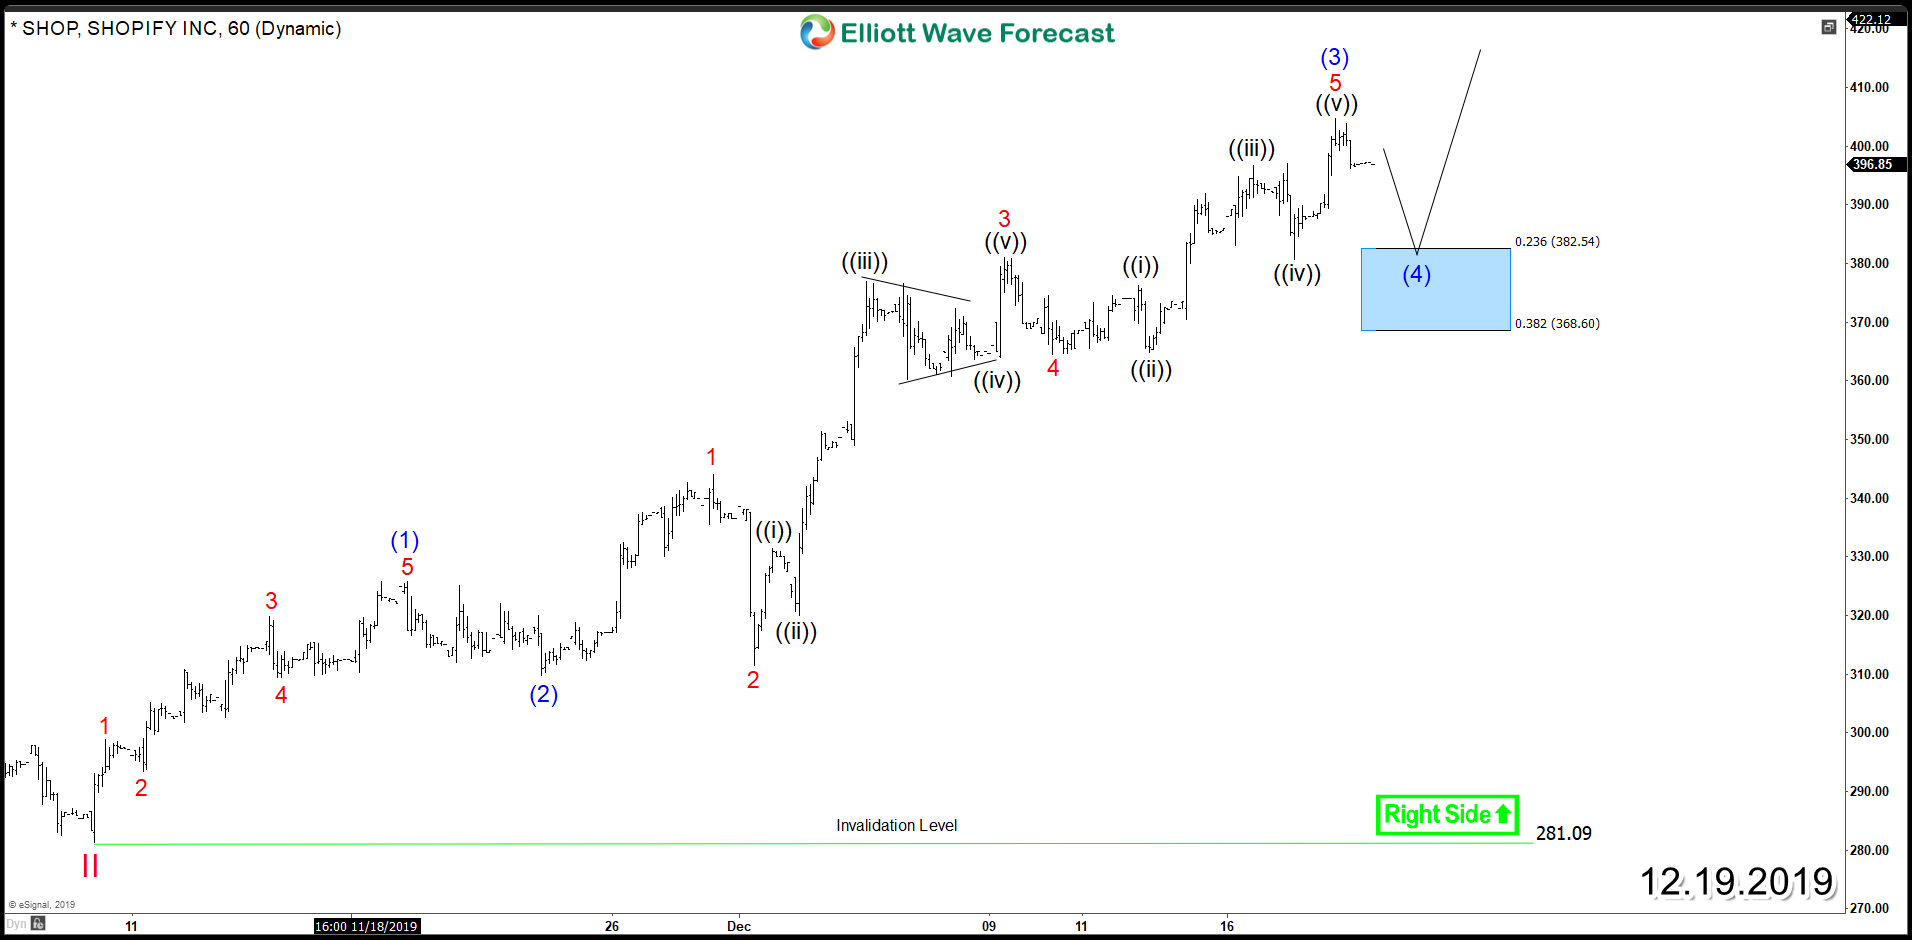
Shopify (NYSE: SHOP) New All time Highs on the Horizon
Read MoreShopify (NYSE: SHOP) surged higher this year after a strong Breakout of a Bullish Flag which allowed the stock to rally almost 200%. Despite the 40% correction that took place since August, SHOP managed to recover and it’s currently retesting the previous peak aiming for a break to new all time-highs. The short term cycle taking […]
-
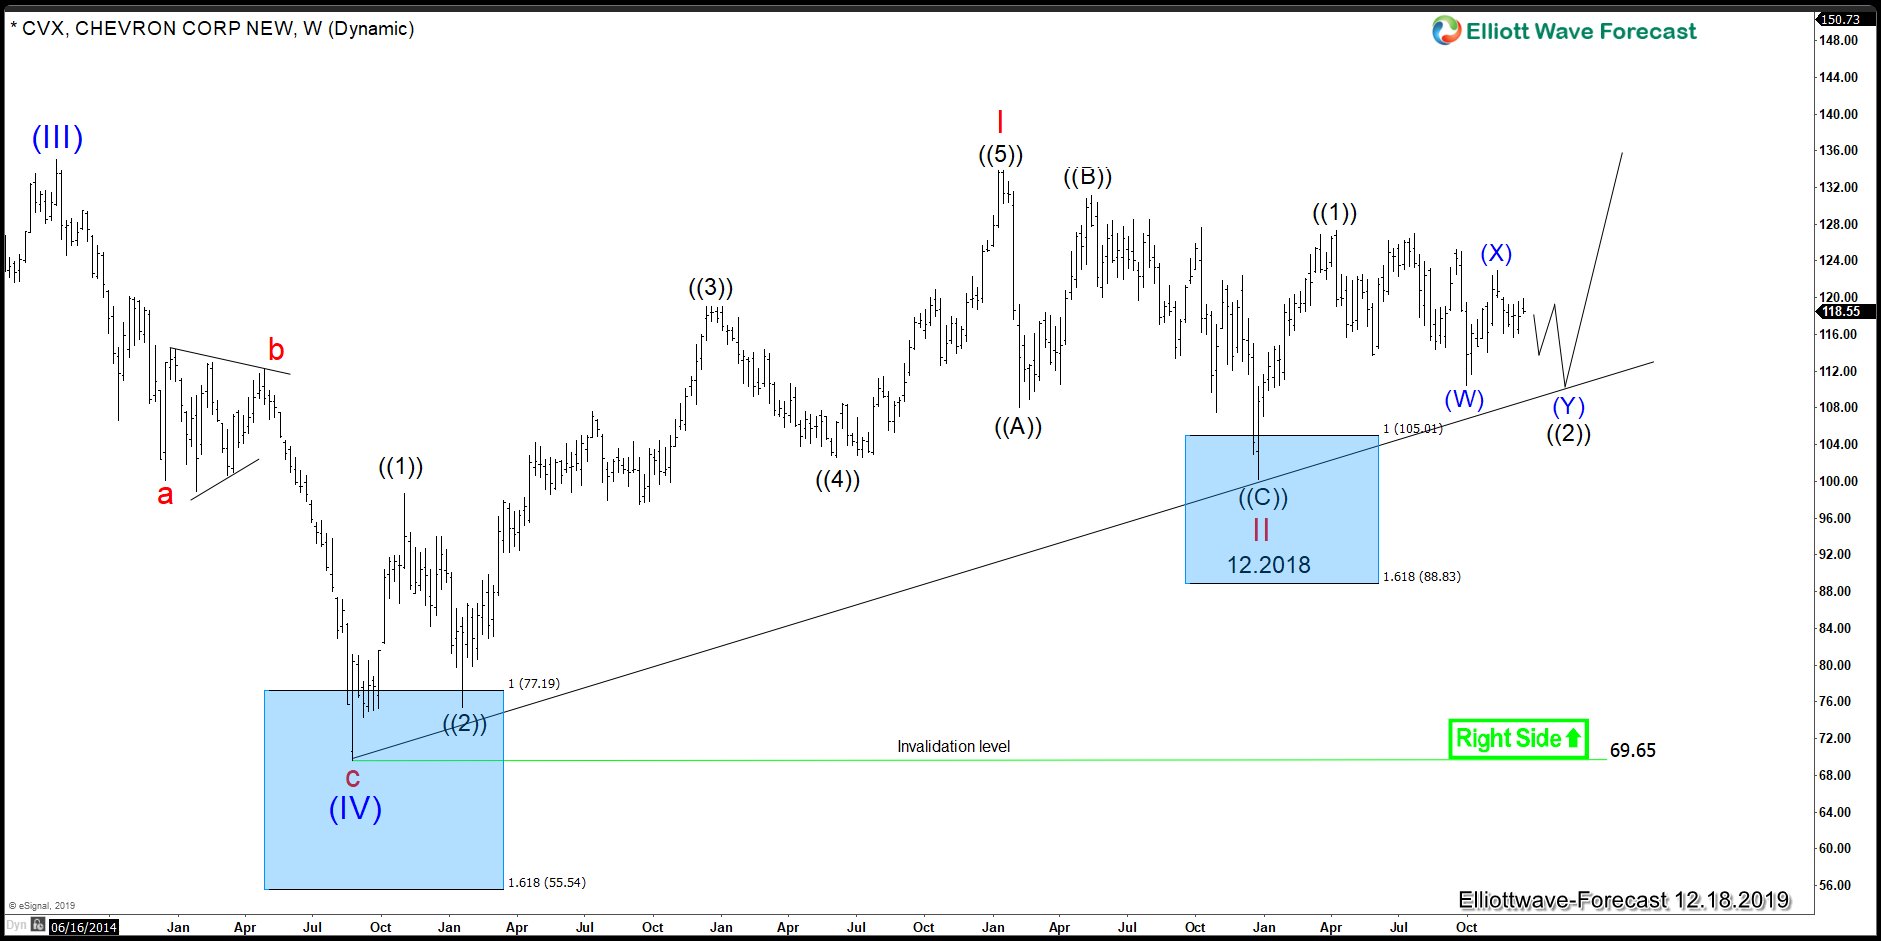
CVX (Chevron) Getting Ready for a Rally
Read MoreSimilar to most instrument within the energy sector, Chevron (ticker: $CVX) is trading sideways to lower since the peak on 04.08.2019. $CVX is showing a five waves advance since the lows at $69.65, which happened on 08.24.2015. This low is also the same low in Crude Oil, which we believe ended the Grand Super cycle […]