

The Power of 3-7-11 and the Grand Super Cycle: How We Saw the Bullish Turn in April 2025 Back on April 9, 2025, while World Indices were dropping sharply and global sentiment had turned overwhelmingly bearish, we published an article that challenged the fear-driven narrative. We explained why selling was not the right approach and […]
-
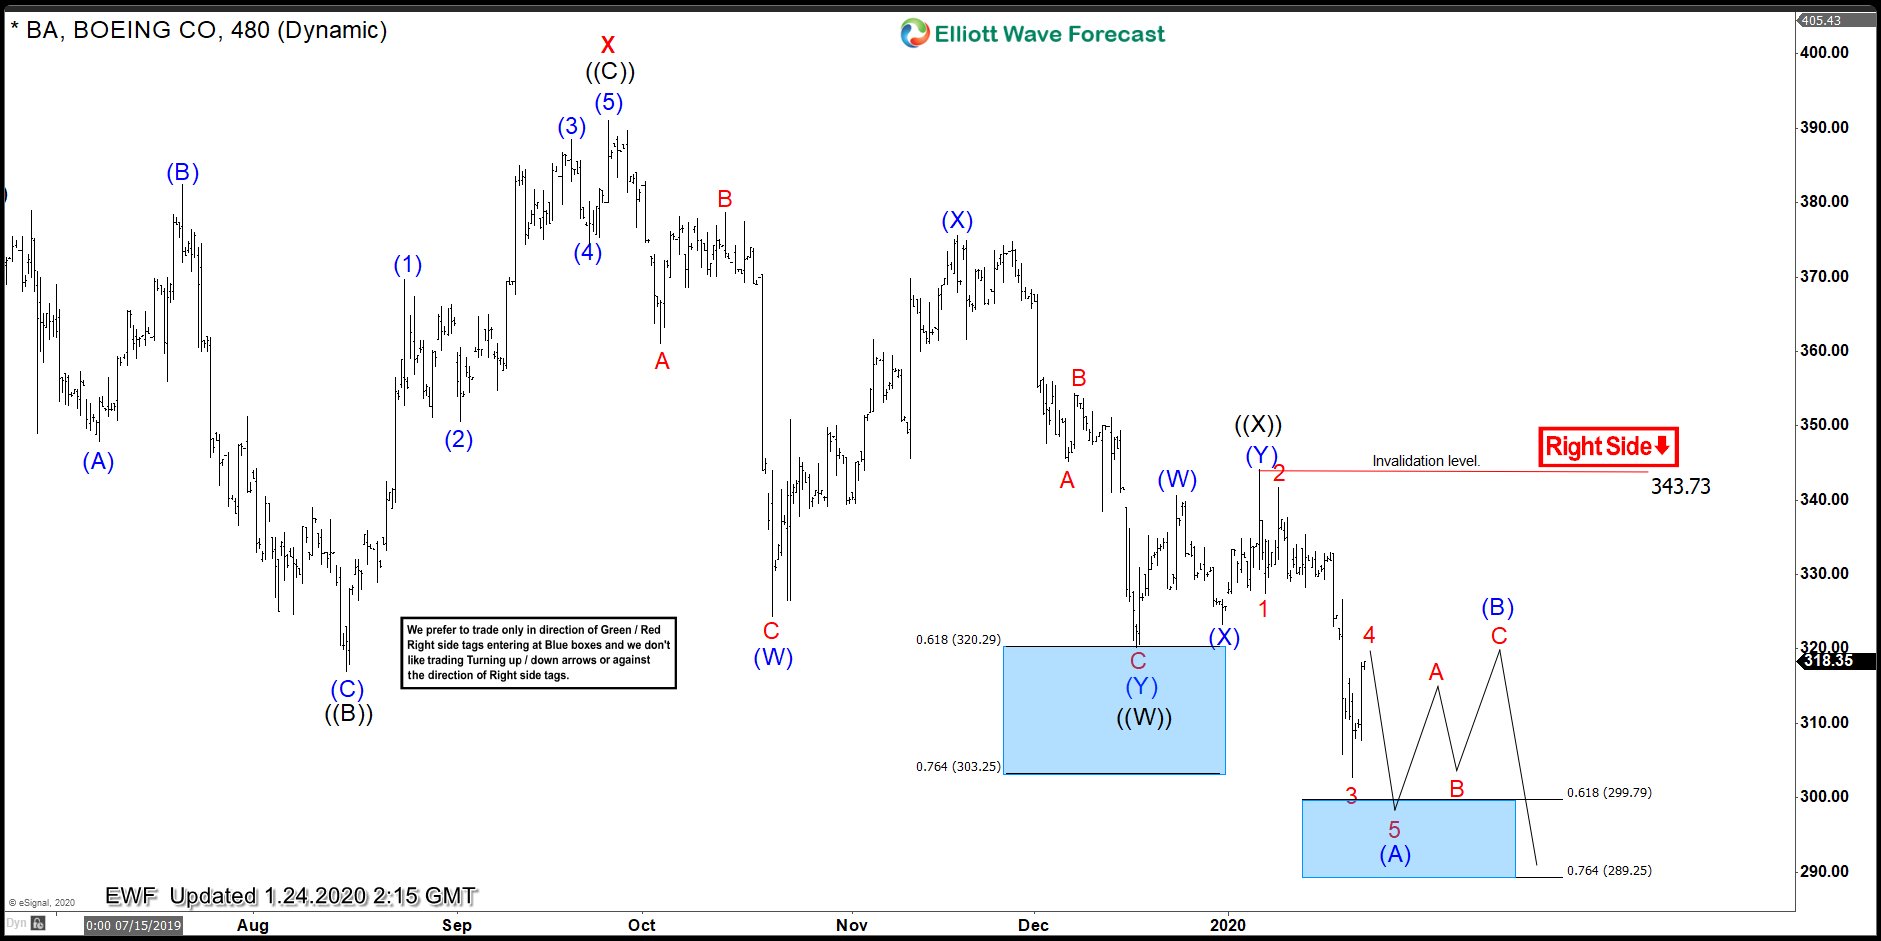
Boeing Elliott Wave View: Biggest Pullback Taking Place
Read MoreBoeing is showing an incomplete sequence from March 1, 2019 peak favoring more downside in the stock. This article & video looks at the Elliott Wave path.
-
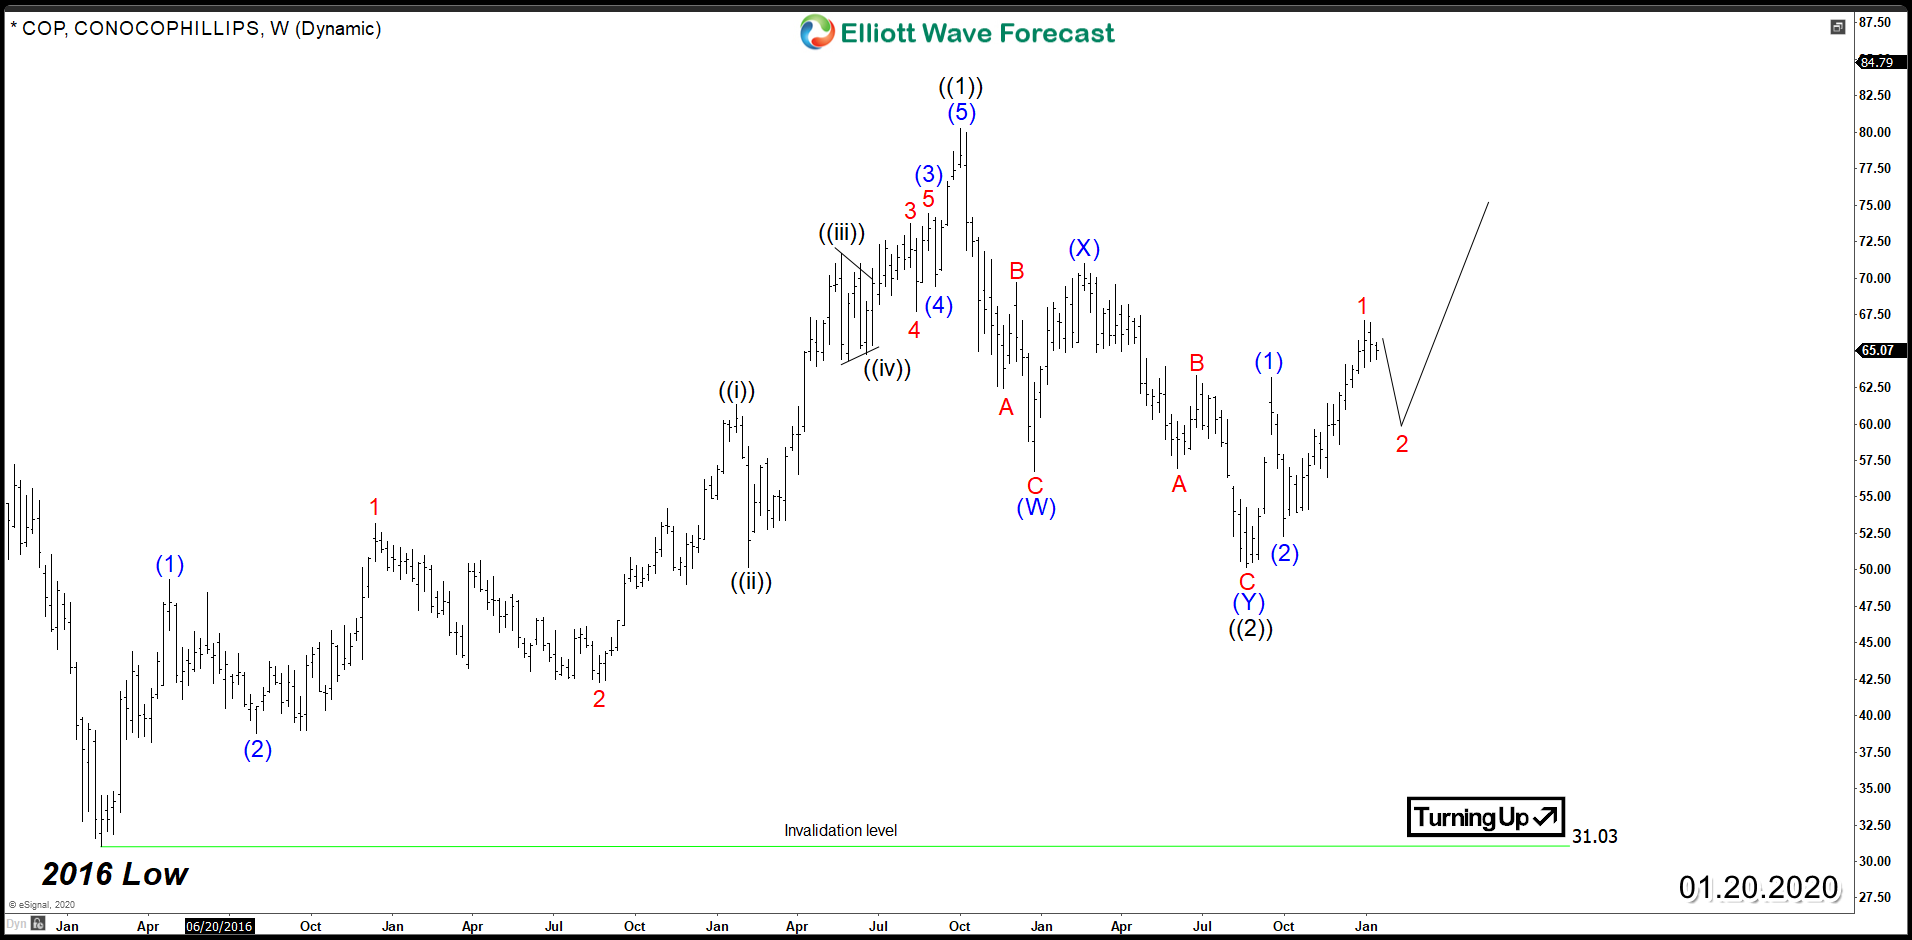
ConocoPhillips (NYSE: COP) Getting Ready for Next Rally
Read MoreConocoPhillips (NYSE: COP) is an American multinational energy corporation that was created through the merger of American oil companies Conoco and Phillips Petroleum Company on August 30, 2002. Since February 2016, COP rallied higher within an impulsive 5 waves advance for almost 3 years before ending that cycle in October 2018. Then the stock turned lower into a […]
-
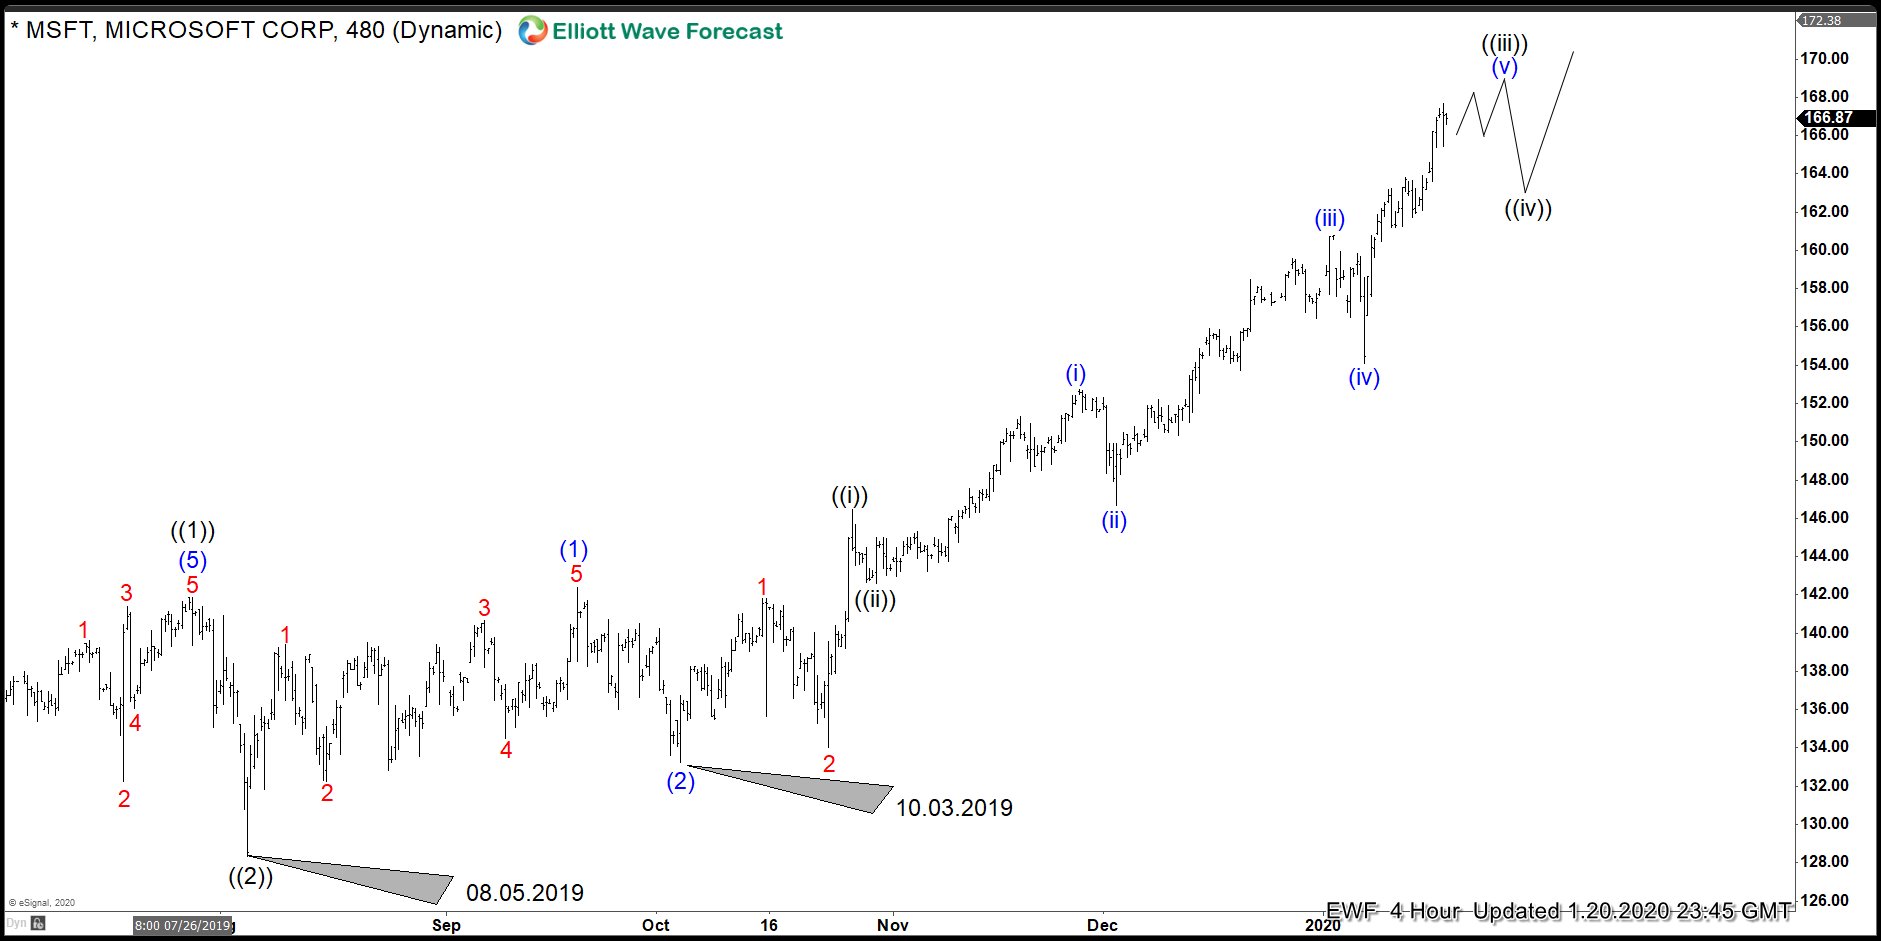
Microsoft ($MSFT): Even When In Wave V, More Upside Still To Come
Read MoreA few months ago, we were expecting Microsoft to trade into the $157.00-$172.00 area. We observed a very technical impulse from all-time lows where wave (III) is ending. We explained the whole idea in the following blog Microsoft Elliott Wave View: Why It Will Be Supported Into $157.78-$172.77 Area. The area has now been reached, but […]
-
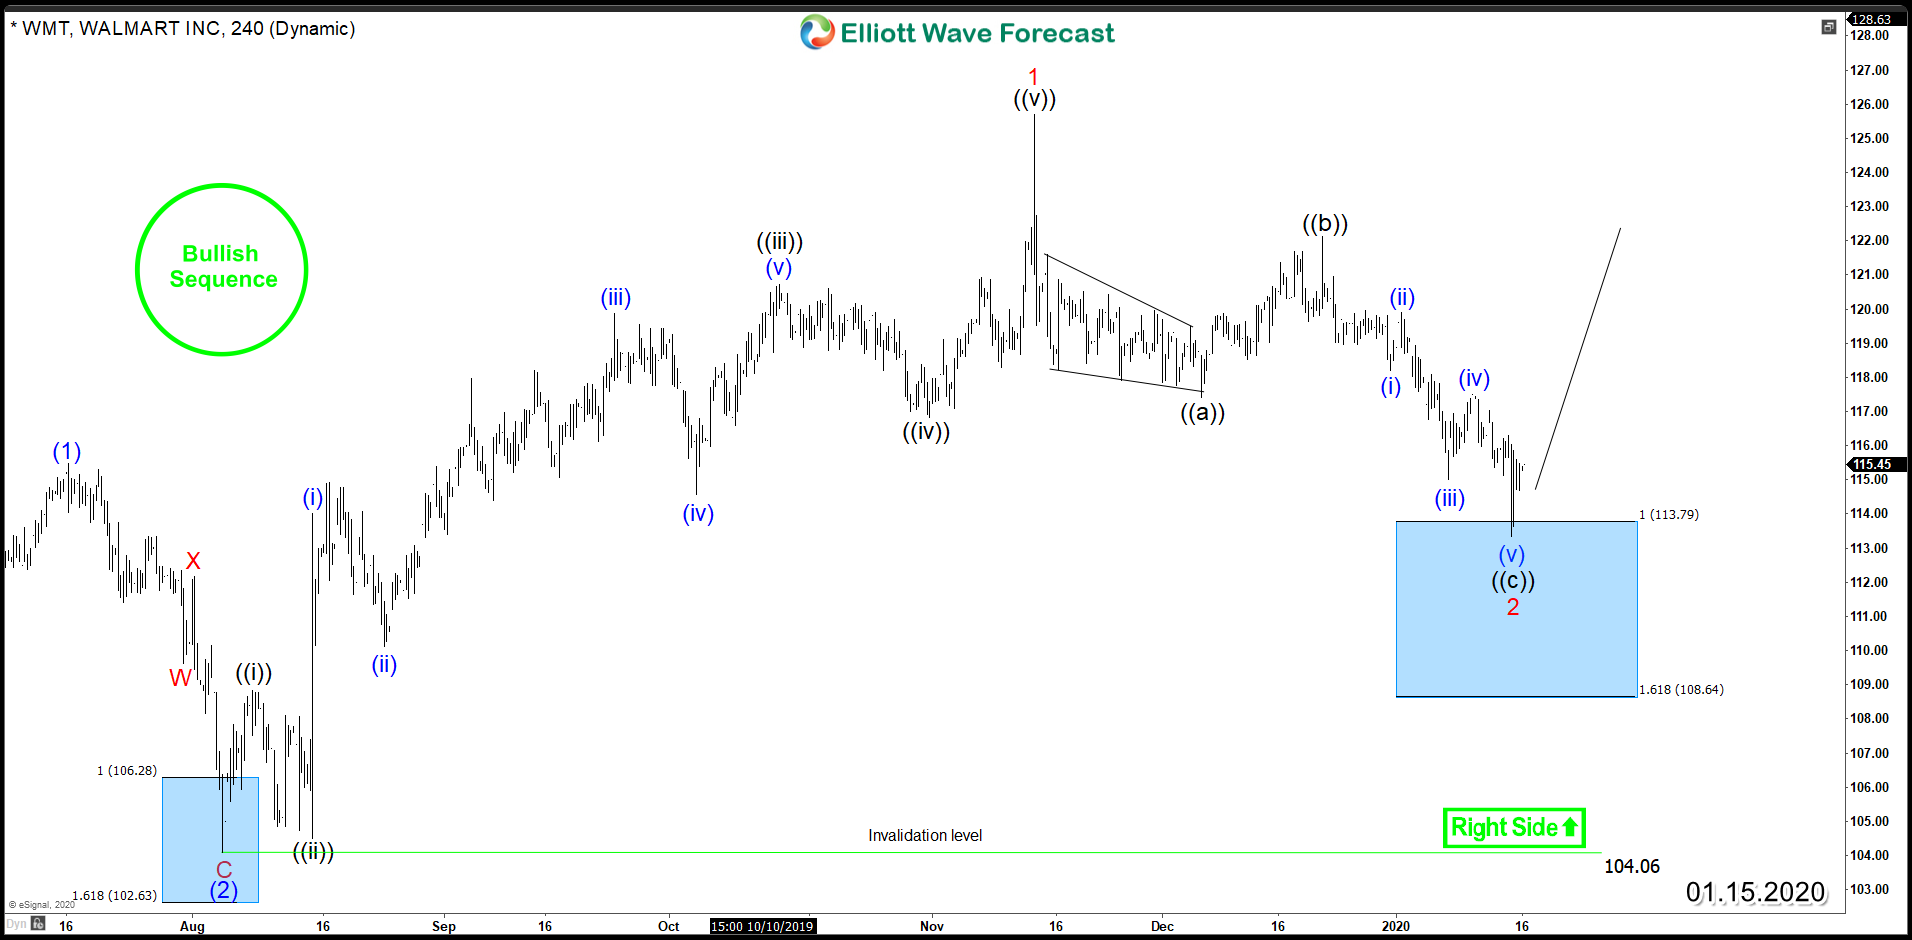
Walmart (NYSE: WMT) Looking to Find Buyers During Pullbacks
Read MoreIn today’s article, we’ll be taking a look at the current Elliott Wave Structure for the world’s largest retailer Walmart (NYSE: WMT). Since August 2019, WMT rallied within an impulsive 5 waves advance which took the stock to new all time highs before the cycle ends on November at $125.69. Down from there, it started a […]
-
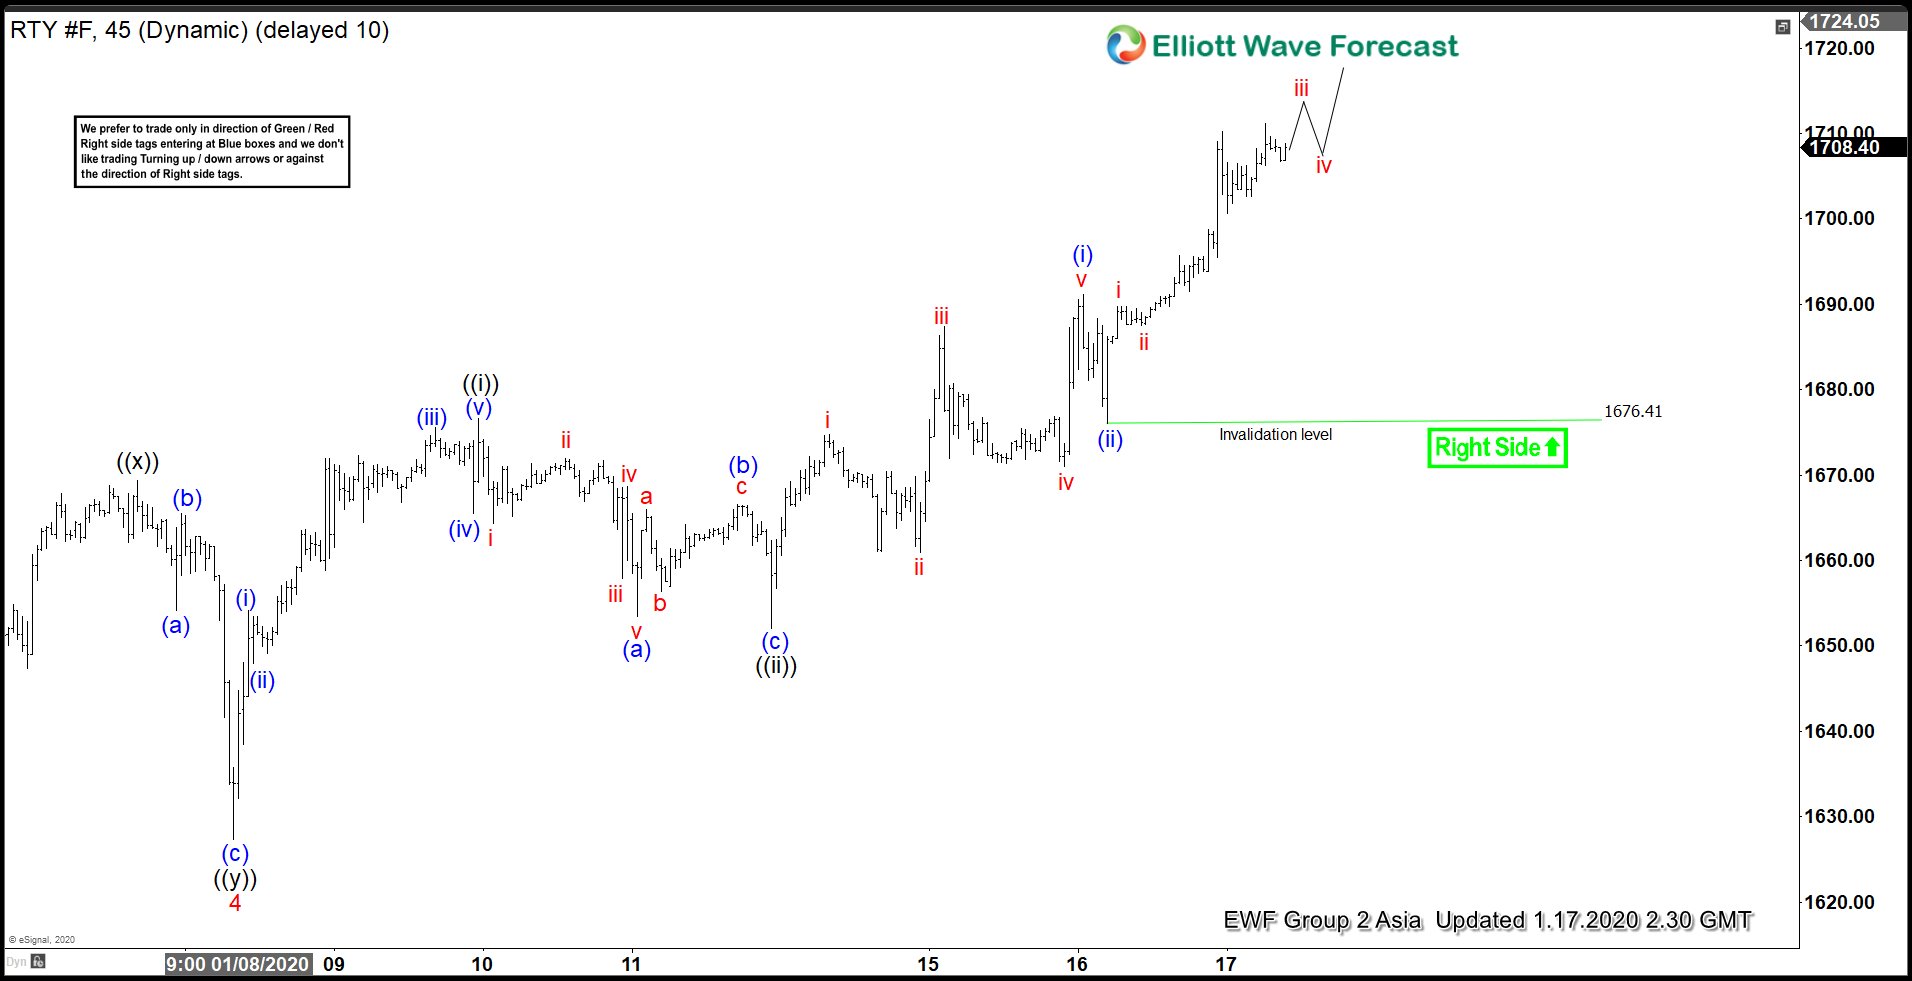
Elliott Wave View: Russell Impulsive Rally In Progress
Read MoreRussell 2000 (RTY_F) shows a 5 waves impulse Elliott Wave structure from August 26, 2019 low. In the 45 minutes chart below, we can see wave (4) of the impulse structure ended at 1627.3. The Index has resumed higher in wave 5 with subdivision of another 5 waves in lesser degree. Up from 1627.3, wave ((i)) […]
-
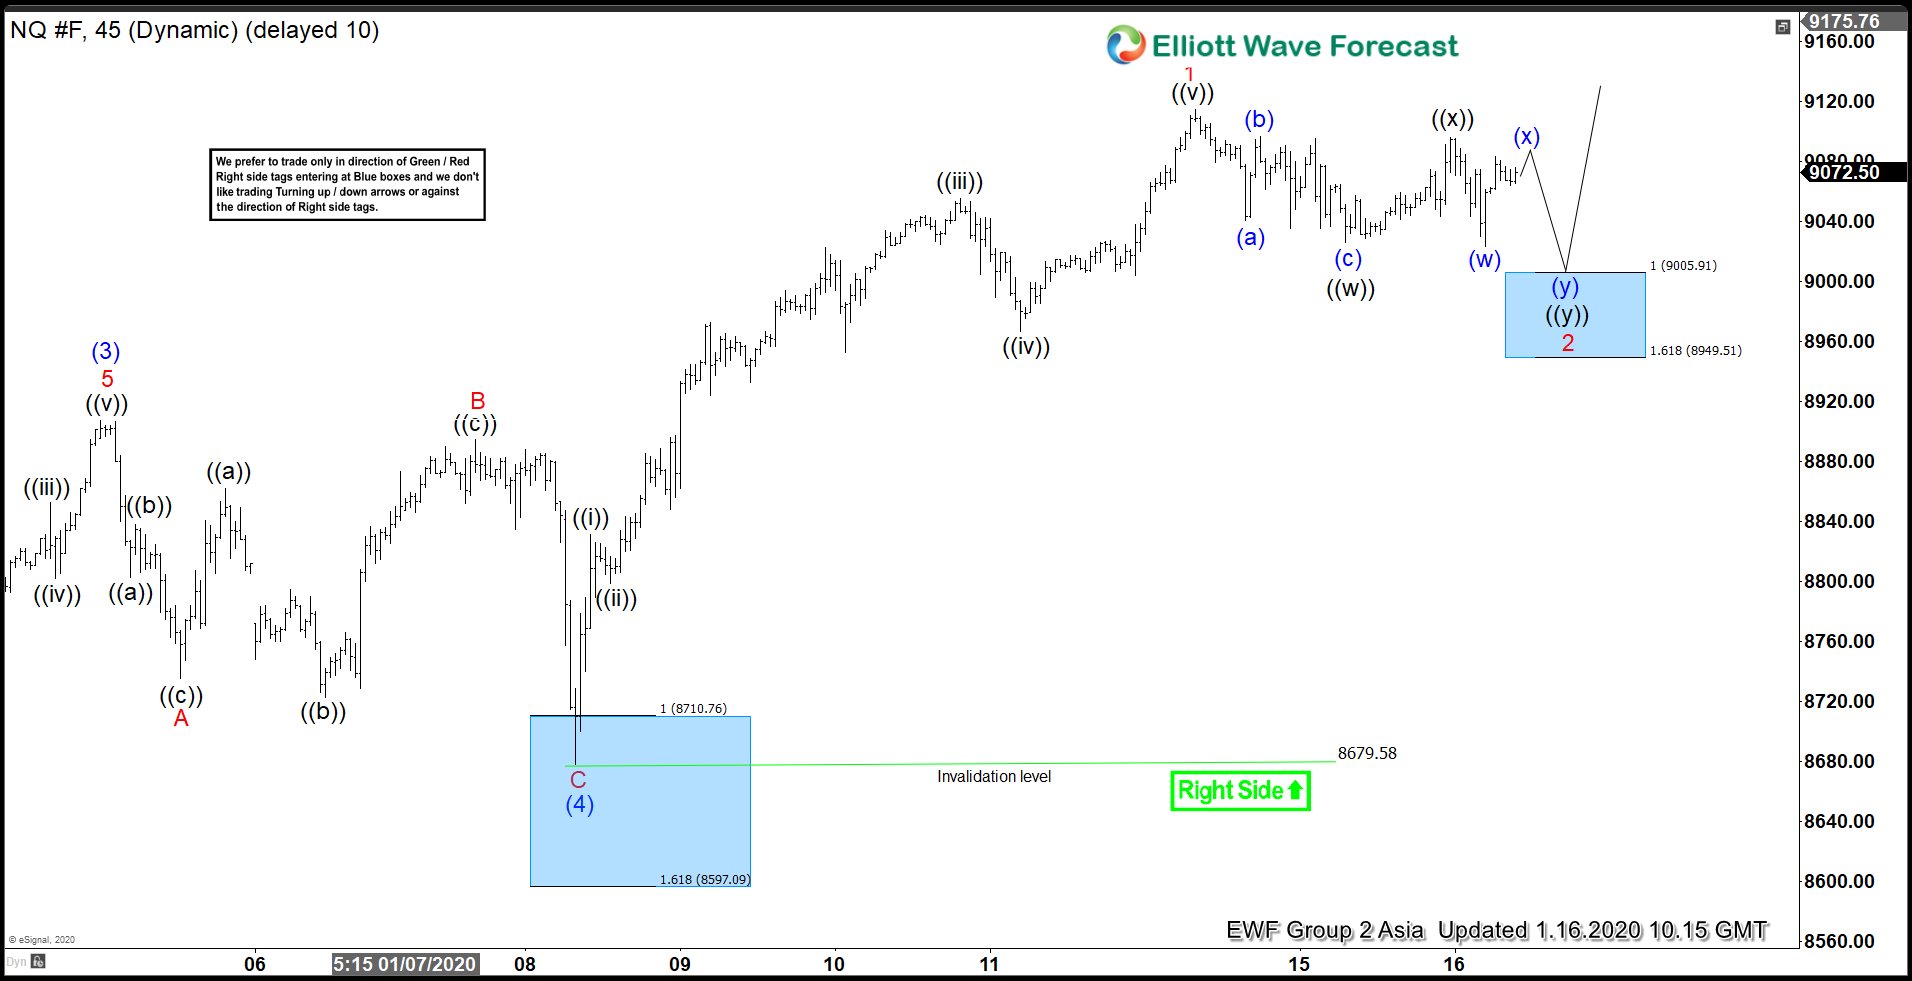
Elliott Wave View: Nasdaq Short Term Support
Read MoreNasdaq shows a 5 waves rally from Jan 8 low. As long as the pullback stays above there, Index can see more upside. This article looks at Elliott Wave path.