

The Power of 3-7-11 and the Grand Super Cycle: How We Saw the Bullish Turn in April 2025 Back on April 9, 2025, while World Indices were dropping sharply and global sentiment had turned overwhelmingly bearish, we published an article that challenged the fear-driven narrative. We explained why selling was not the right approach and […]
-
CVR Energy (NYSE:CVI) – Recovery on the Horizon
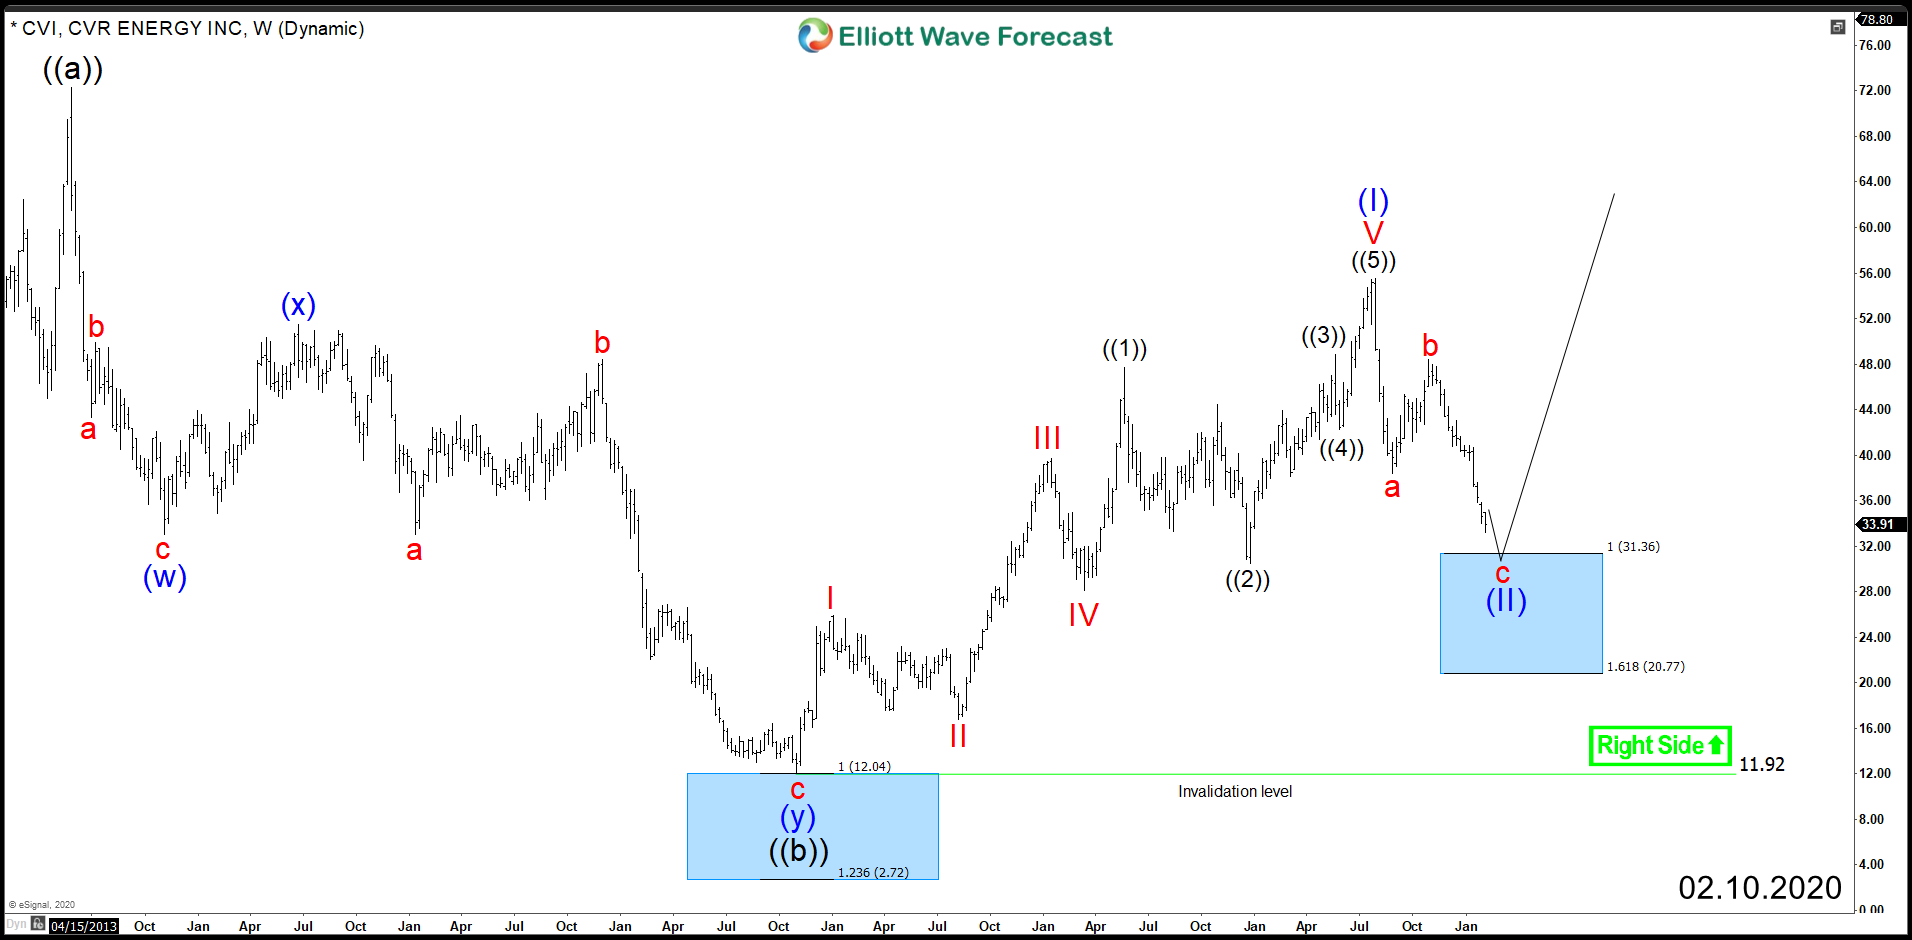
Read MoreCVR Energy (NYSE:CVI) lost almost 40% of it’s value since July of last year, as the stock started correcting the impulsive 5 waves advance from 2016 low. The correction taking place is unfolding as 3 waves Zigzag structure which can ideally find support at equal legs area $31.36 – $20.77 from where a reaction higher […]
-
Elliott Wave View: Further Upside Expected in Amazon
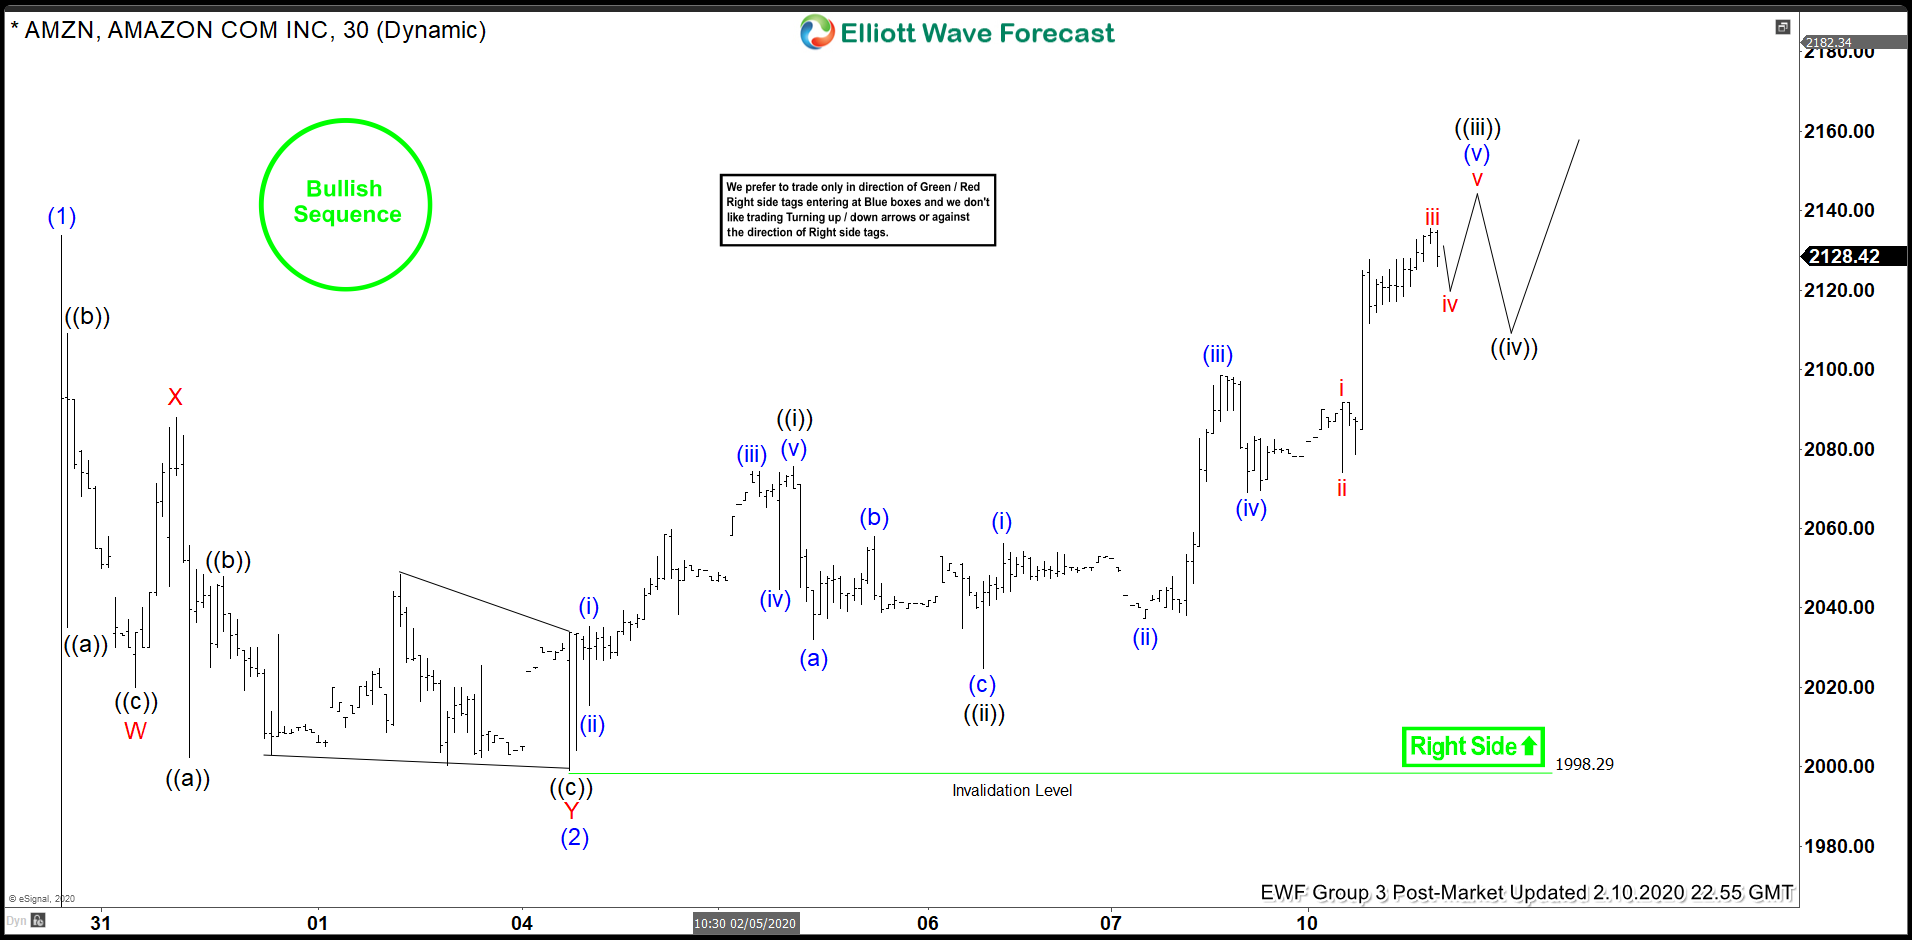
Read MoreAmazon (ticker symbol: AMZN) broke above July 11, 2019 high (2035.8) a few weeks ago after reporting strong earnings. The stock now shows an incomplete bullish sequence from December 24, 2018 low favoring further upside. In the short term chart below, the rally to 2133.74 ended wave (1) and the pullback to 1998.29 ended wave […]
-
Elliott Wave View: Pullback in Russell Should See Support
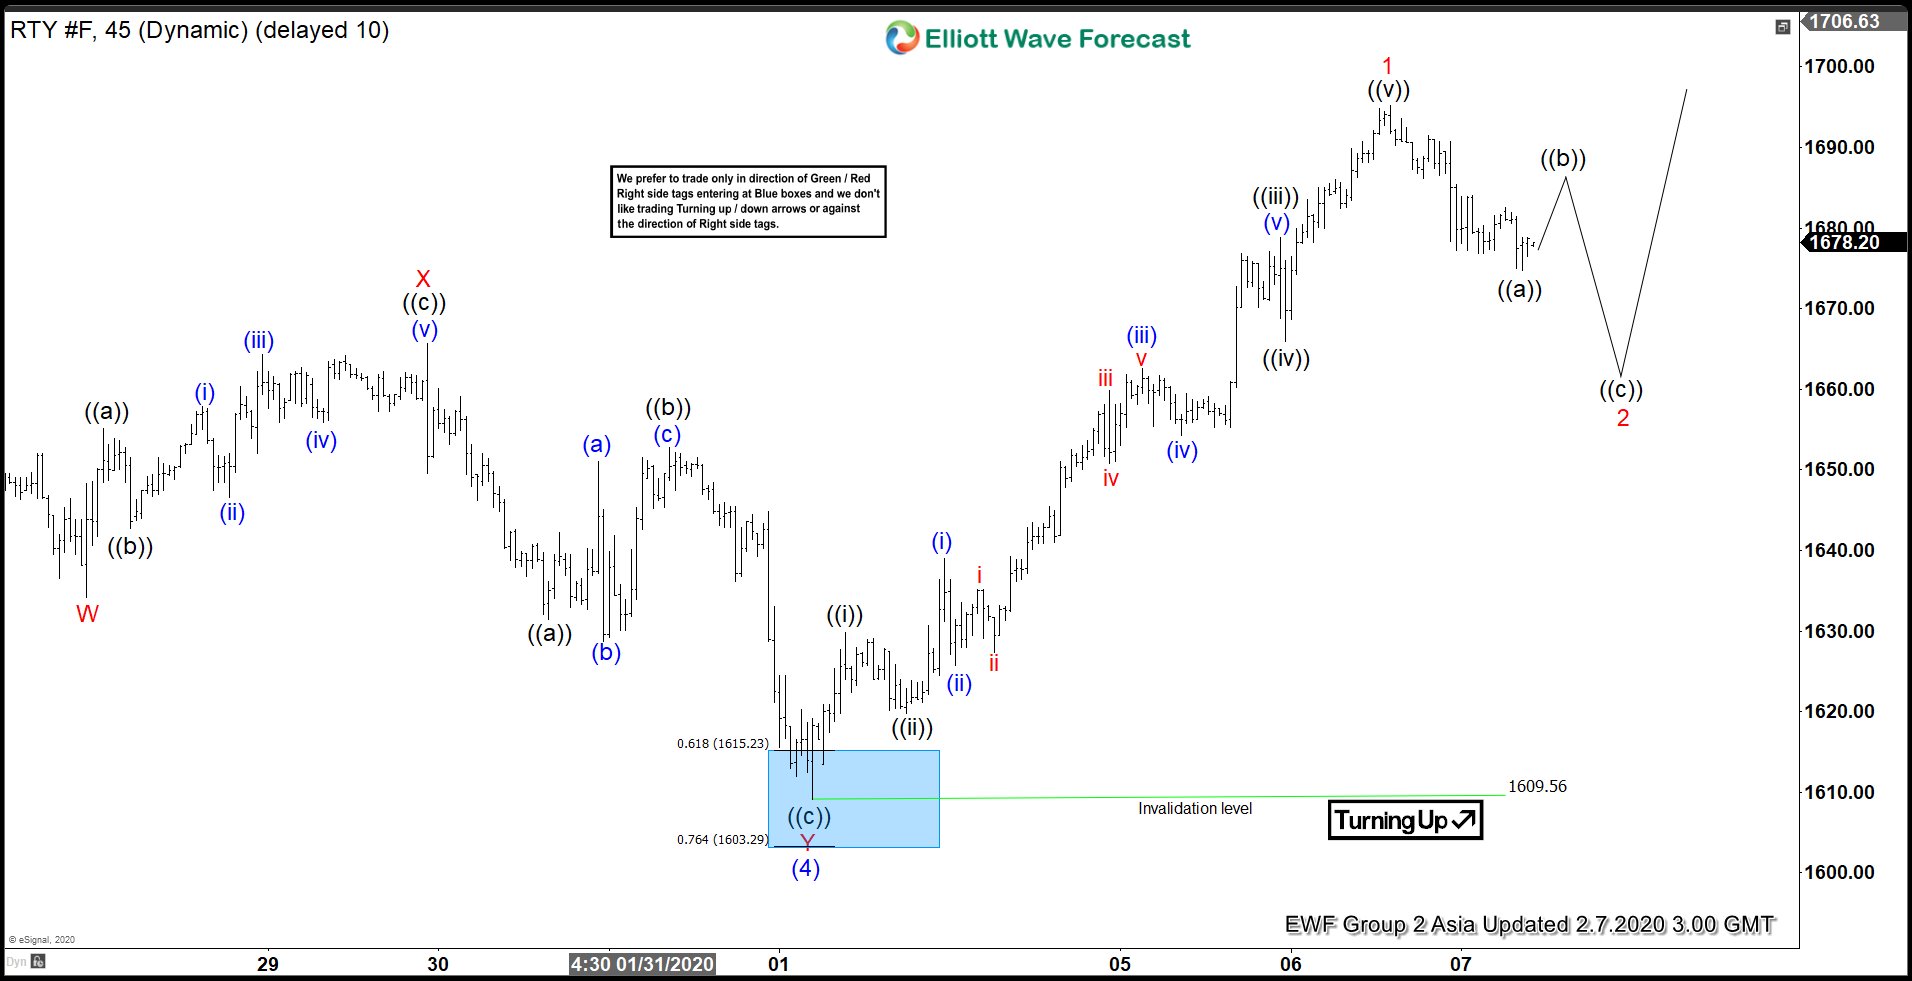
Read MoreRussell 2000 rally from Feb 1 low is impulsive and should see further upside while pullback stays above there. This article looks at the Elliottwave path.
-
Amazon Soared After Q4 Earnings Beat
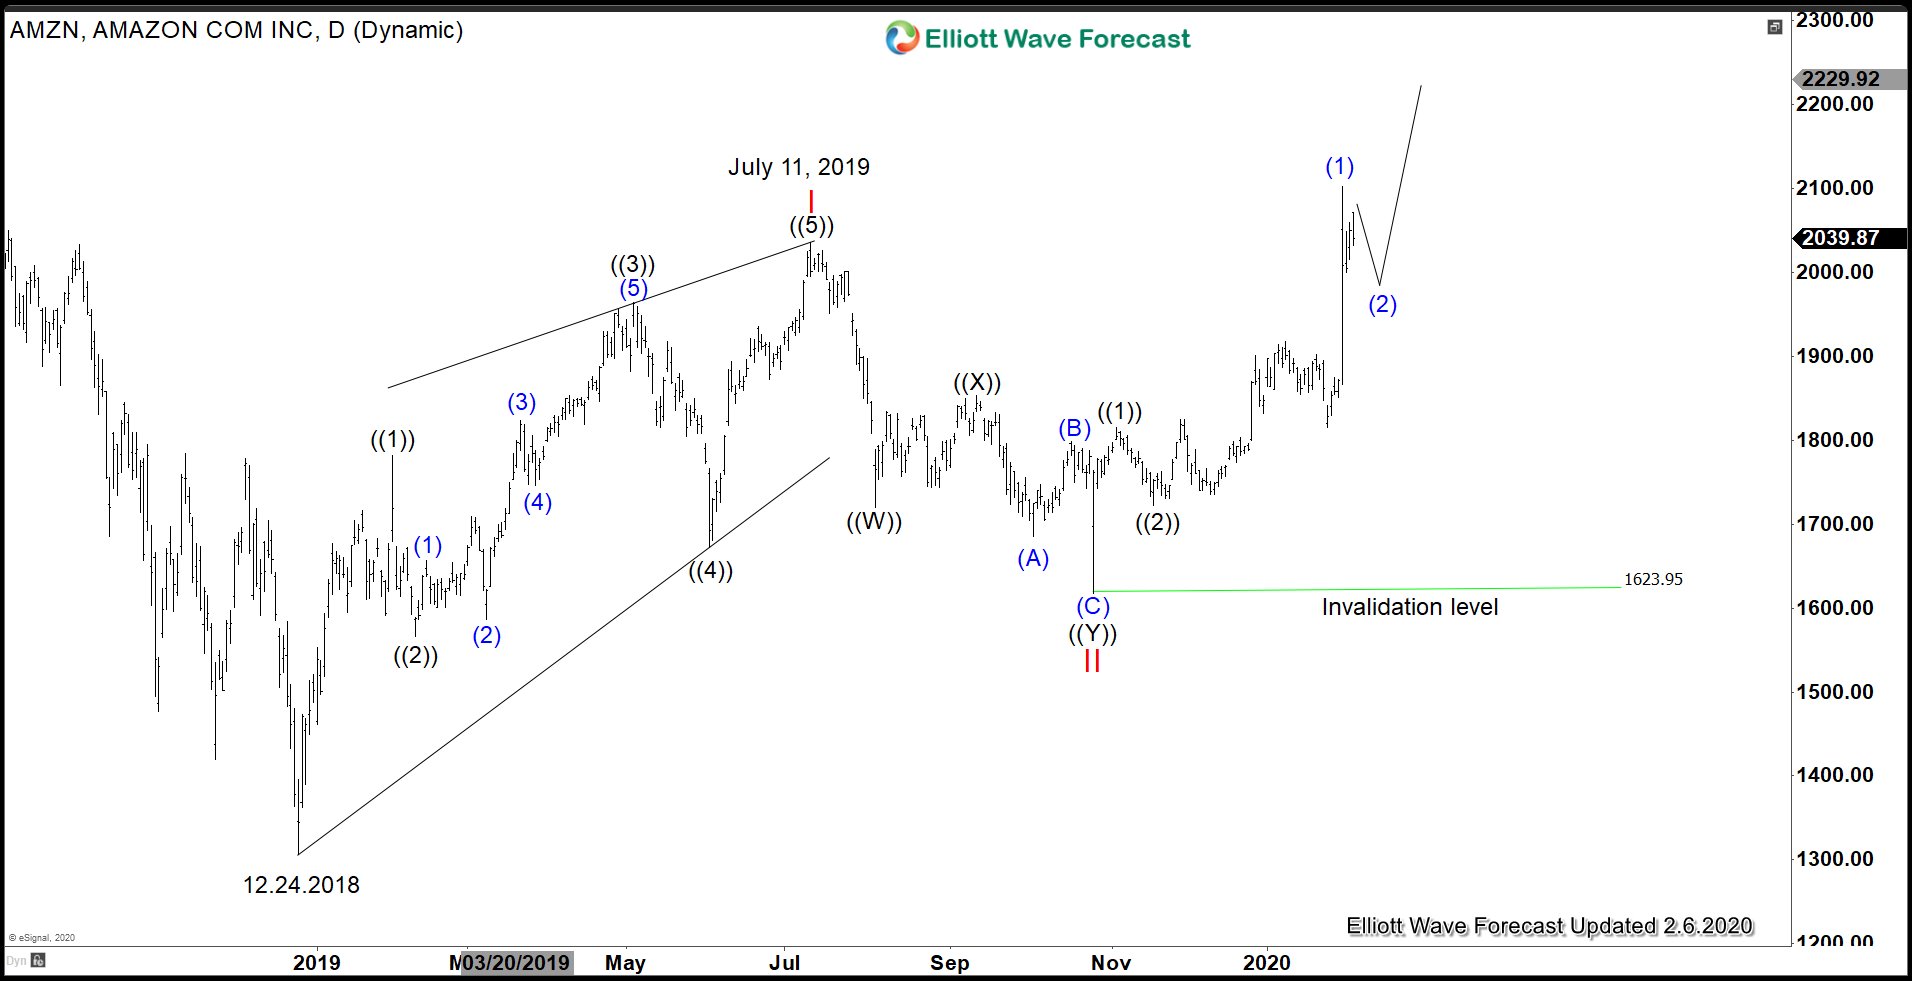
Read MoreAmazon (ticker: AMZN) recently reported Q4 2019 earnings. The result of $45.7 billion online sales surpassed the Q4 2018 number of $39.8 billion. The company also announced they currently have over 150 million Prime subscribers globally. In April 2018, the global Prime subscriber base was around 100 million. Thus, in less than 2 years, Amazon […]
-
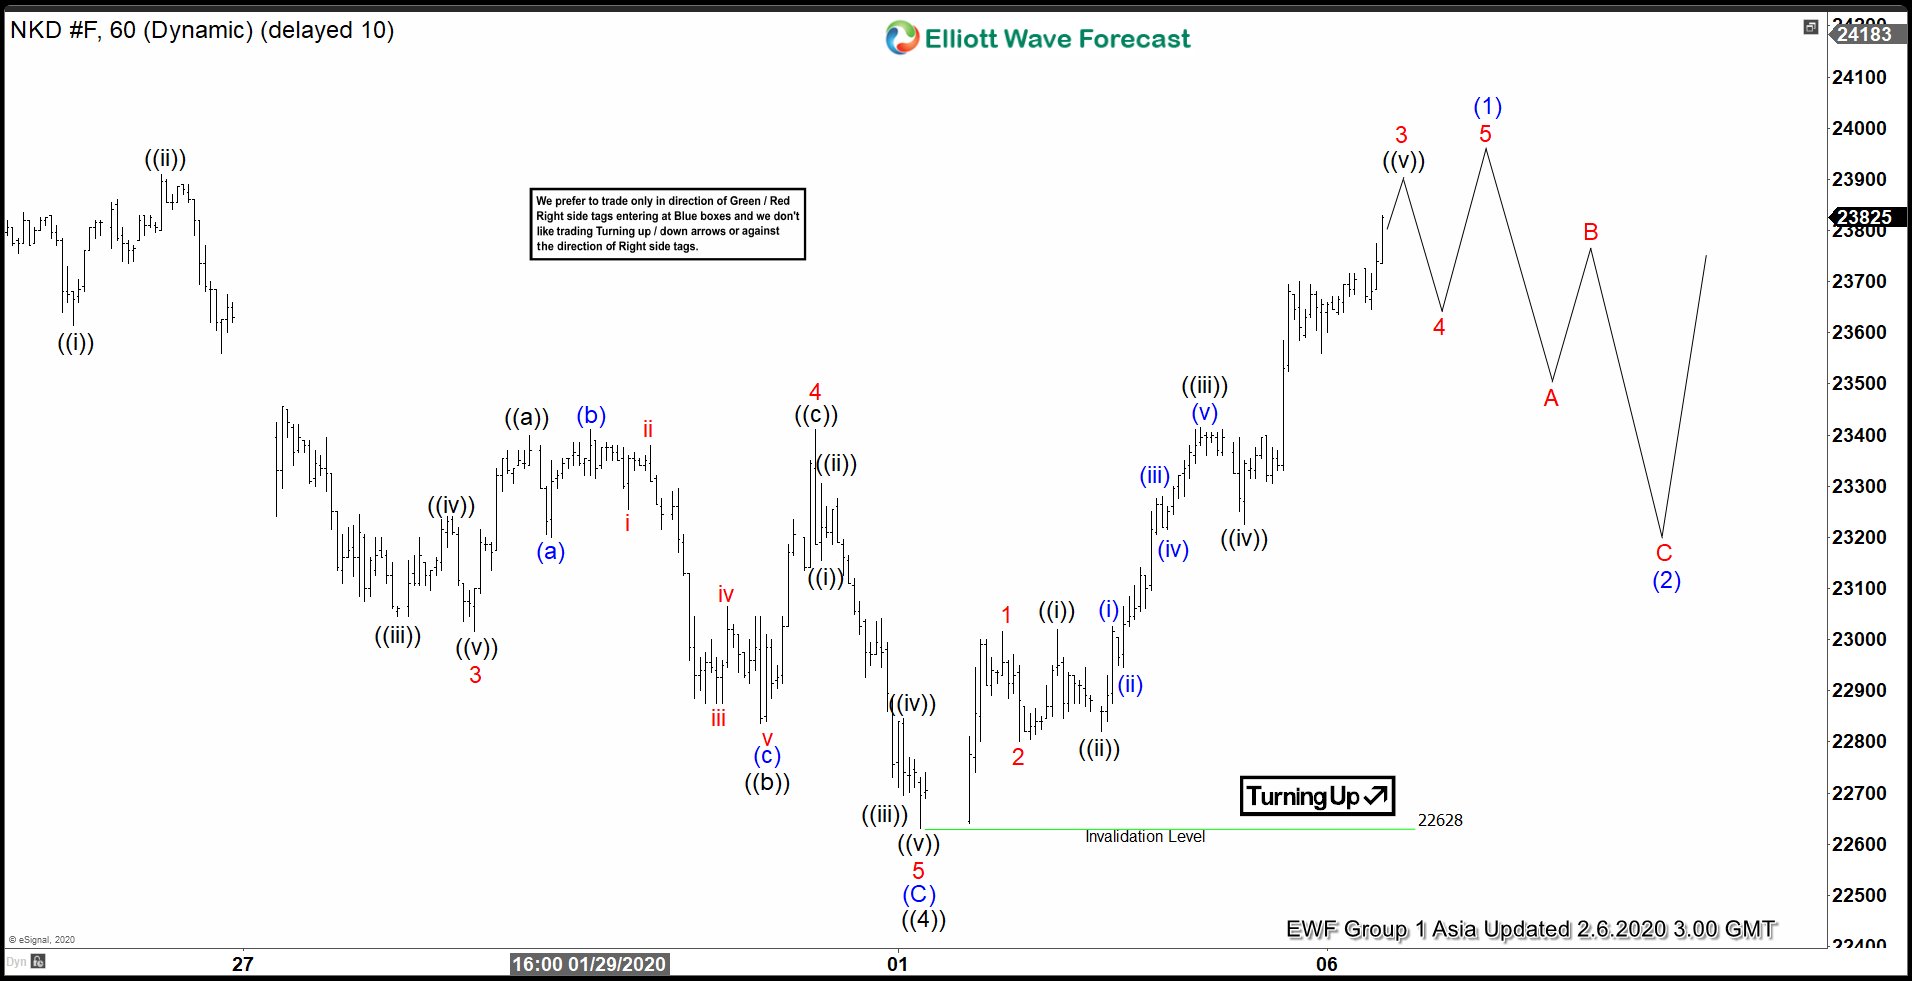
Elliott Wave View: Nikkei Has Resumed Higher
Read MoreNikkei found support after 3 waves pullback and likely has resumed higher as an impulse. This article and video look at the Elliott Wave path.
-
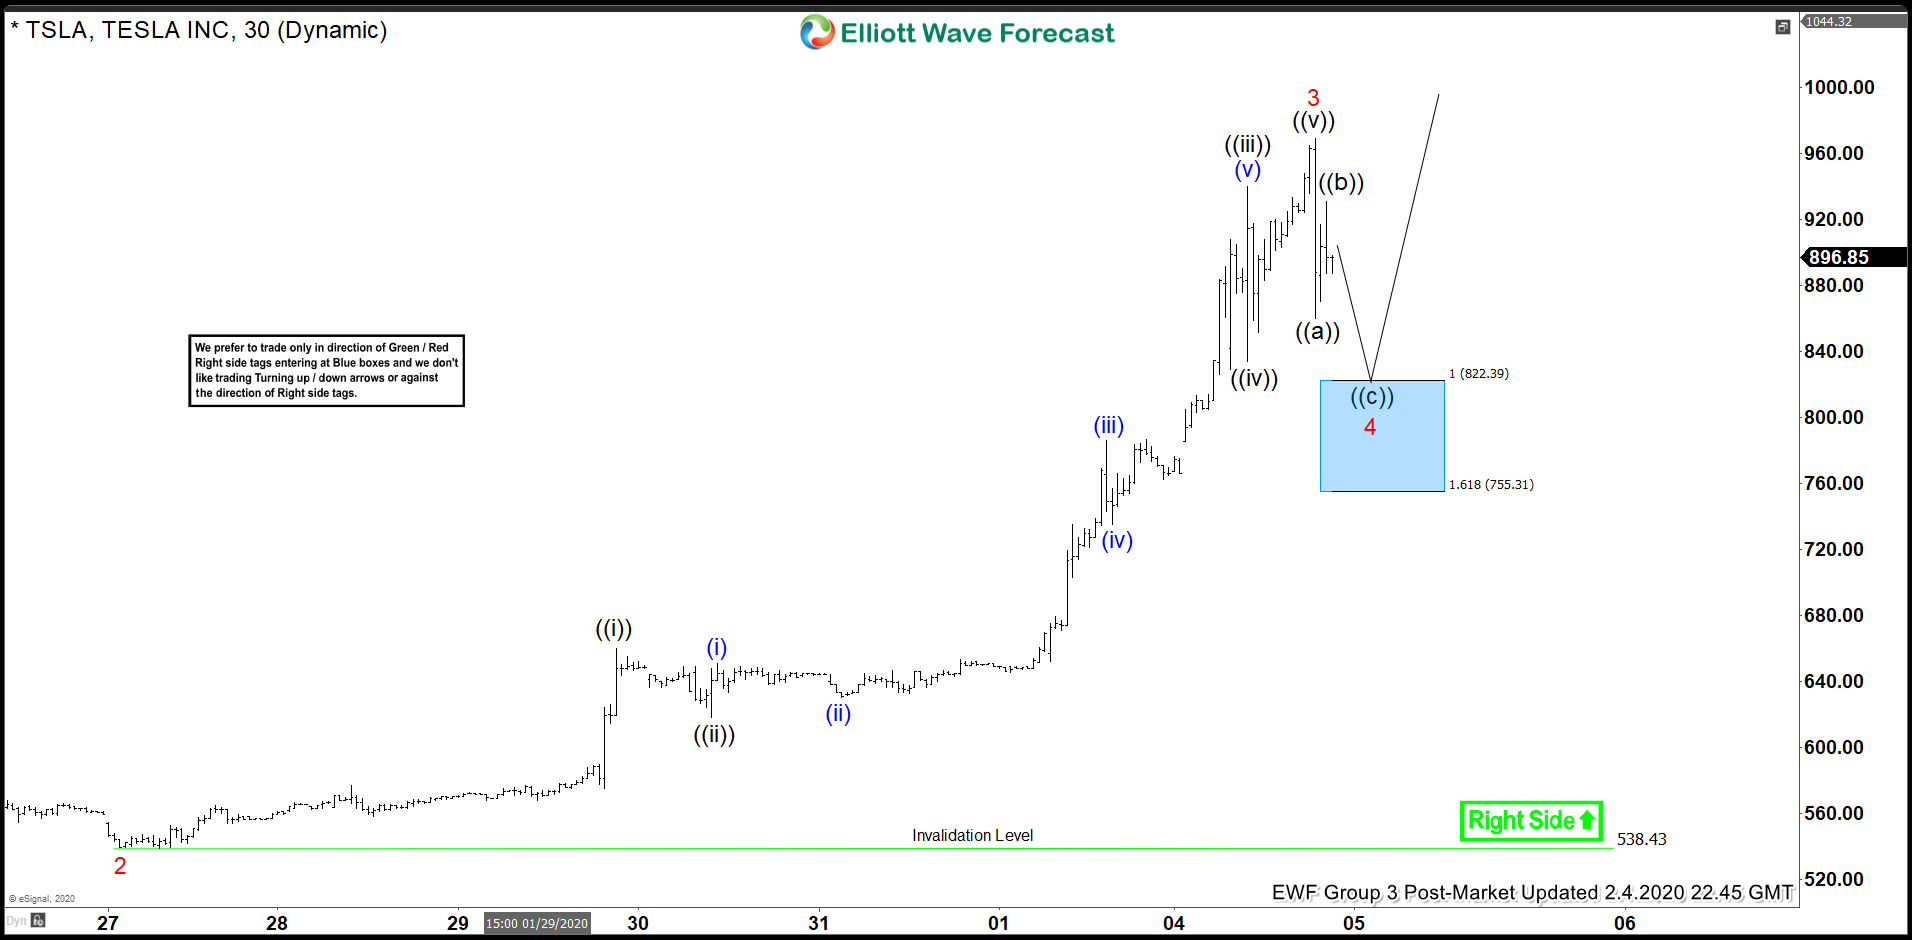
Elliott Wave View: Short Term Support Area for Tesla
Read MoreTesla remains favored higher as it rallies strongly as an impulse. The article looks at the short term support area from where it can extend higher again.