

The Power of 3-7-11 and the Grand Super Cycle: How We Saw the Bullish Turn in April 2025 Back on April 9, 2025, while World Indices were dropping sharply and global sentiment had turned overwhelmingly bearish, we published an article that challenged the fear-driven narrative. We explained why selling was not the right approach and […]
-
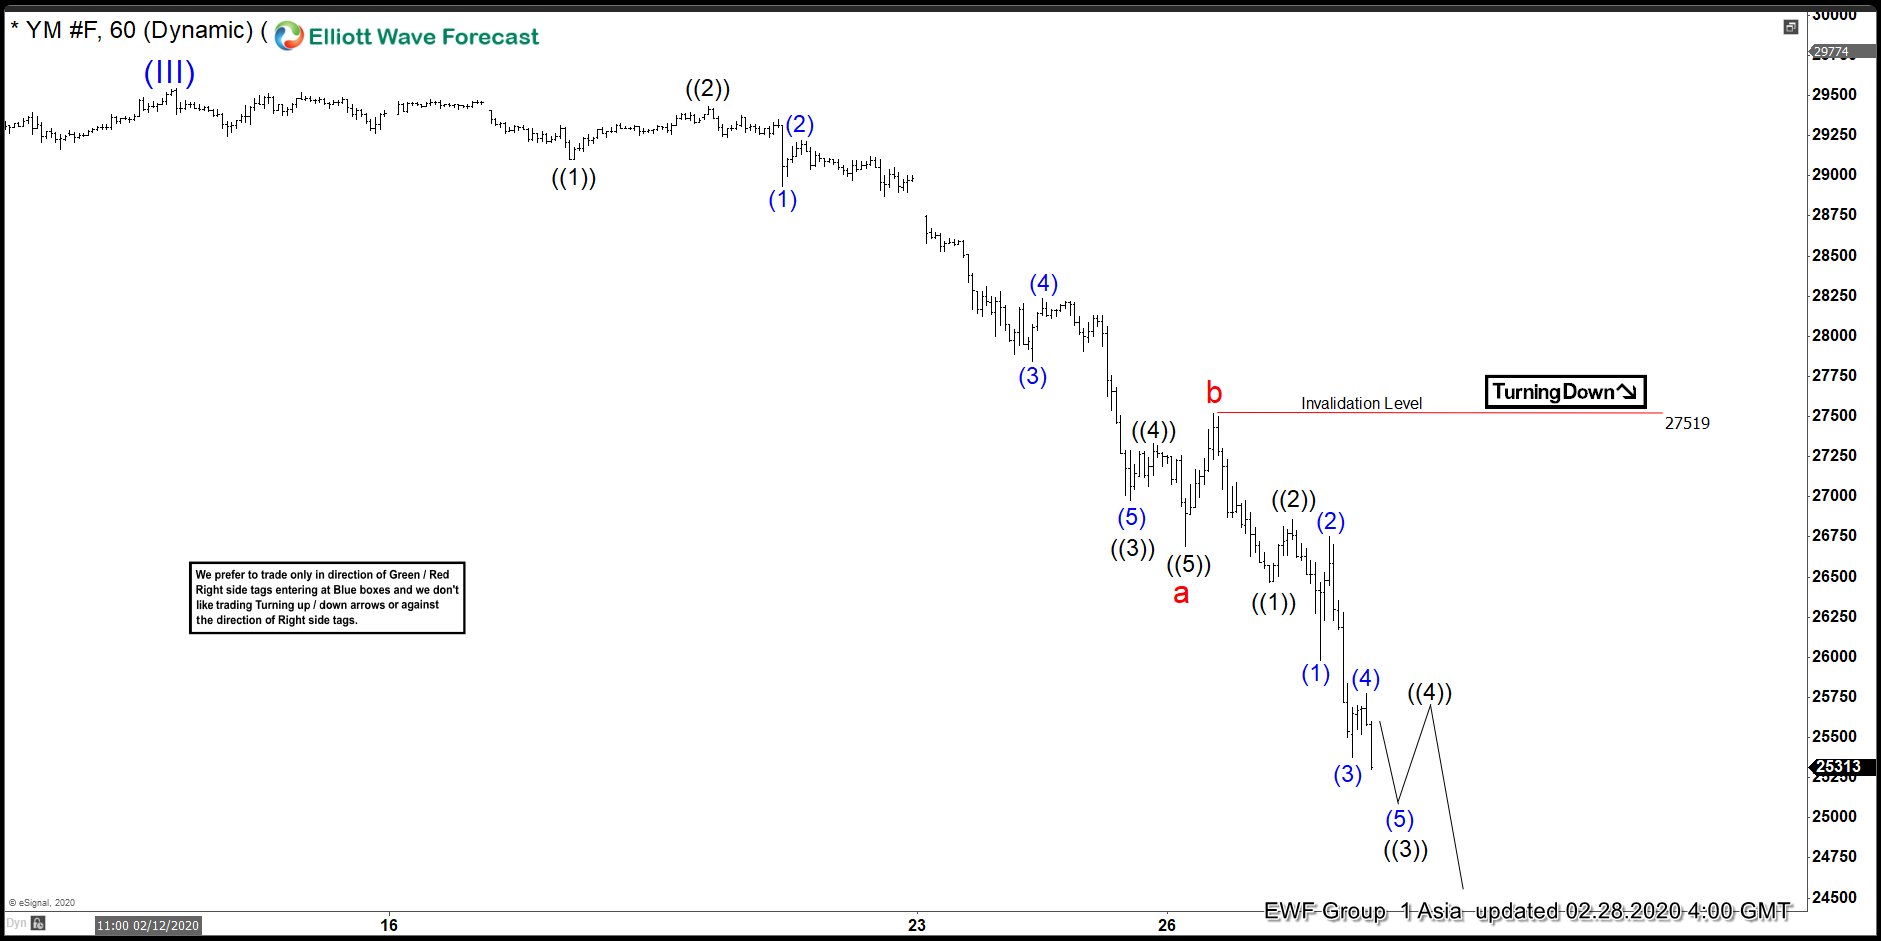
Elliott Wave View: Dow Jones Futures (YM_F) Target Lower
Read MoreThis article and video look at the short term Elliott Wave path for Dow Jones Futures (YM_F) and the downside target of the recent selloff.
-
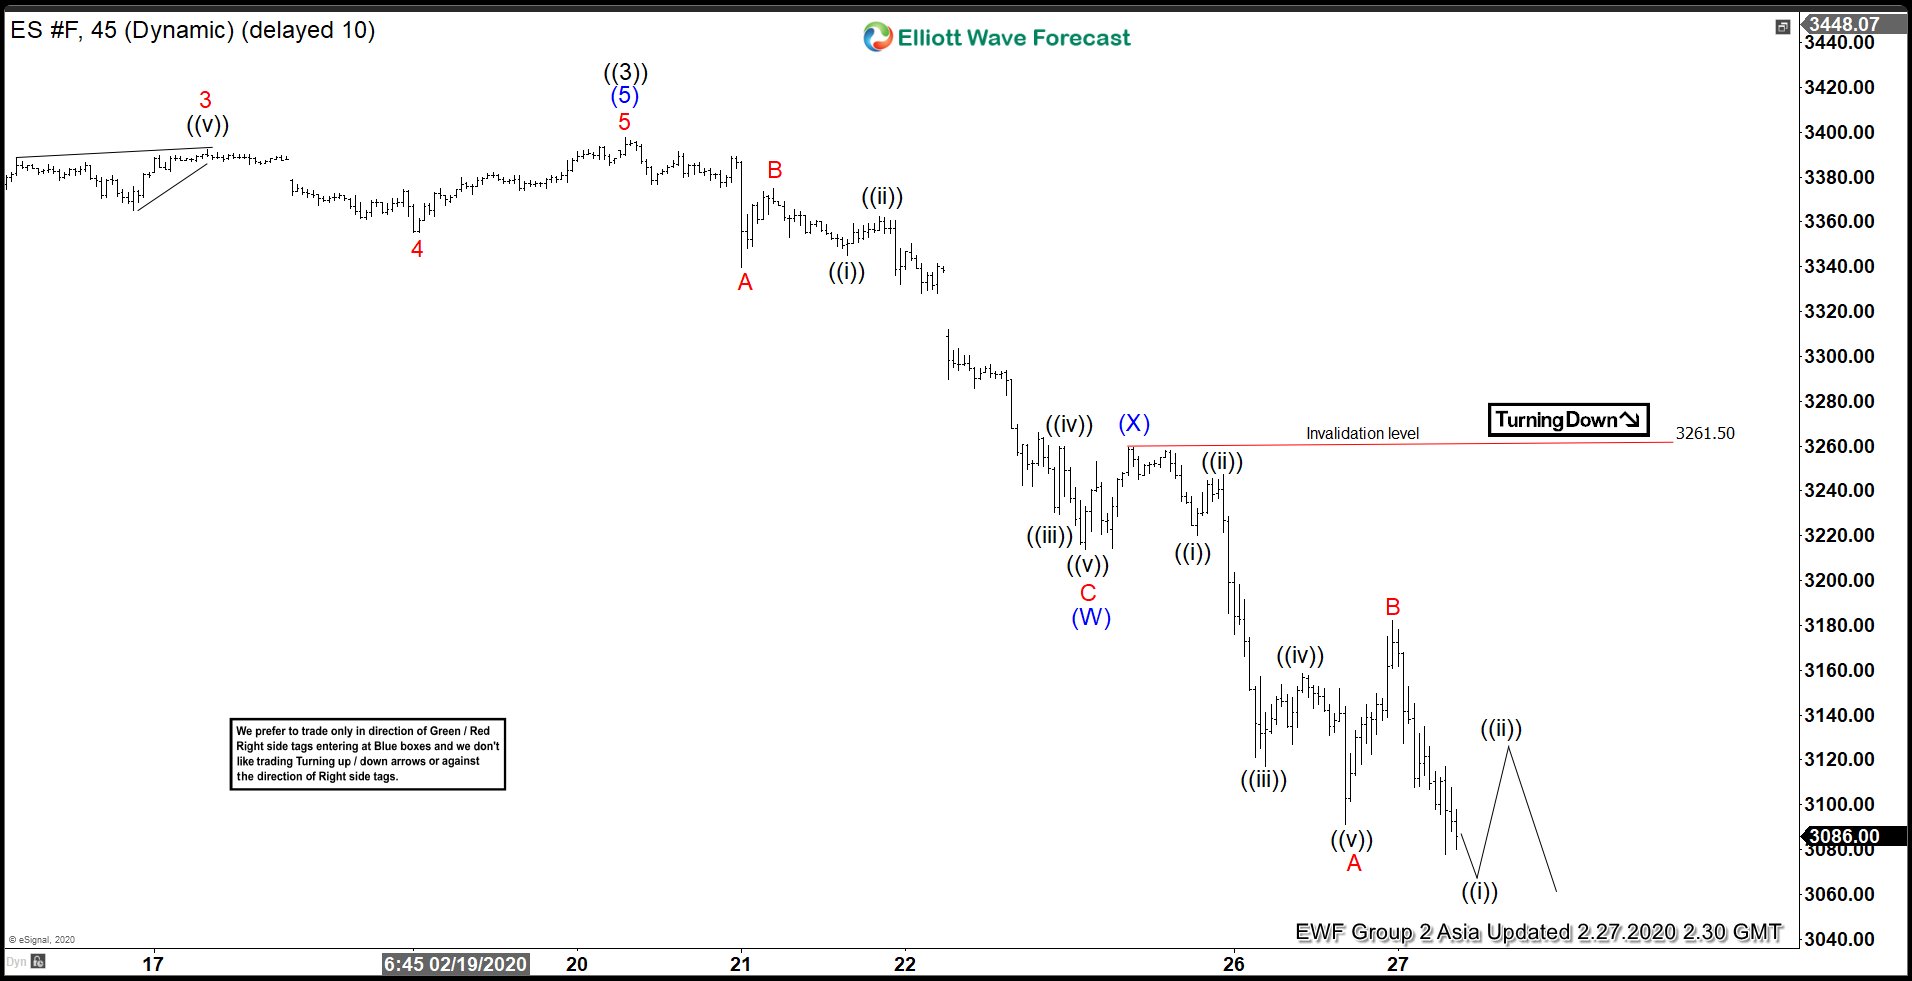
Elliott Wave View: S&P Futures ($ES_F) Downside Target
Read MoreIn this article & video, we look at S&P Futures ($ES_F) target to the downside as well as longer time frame using Elliott Wave.
-
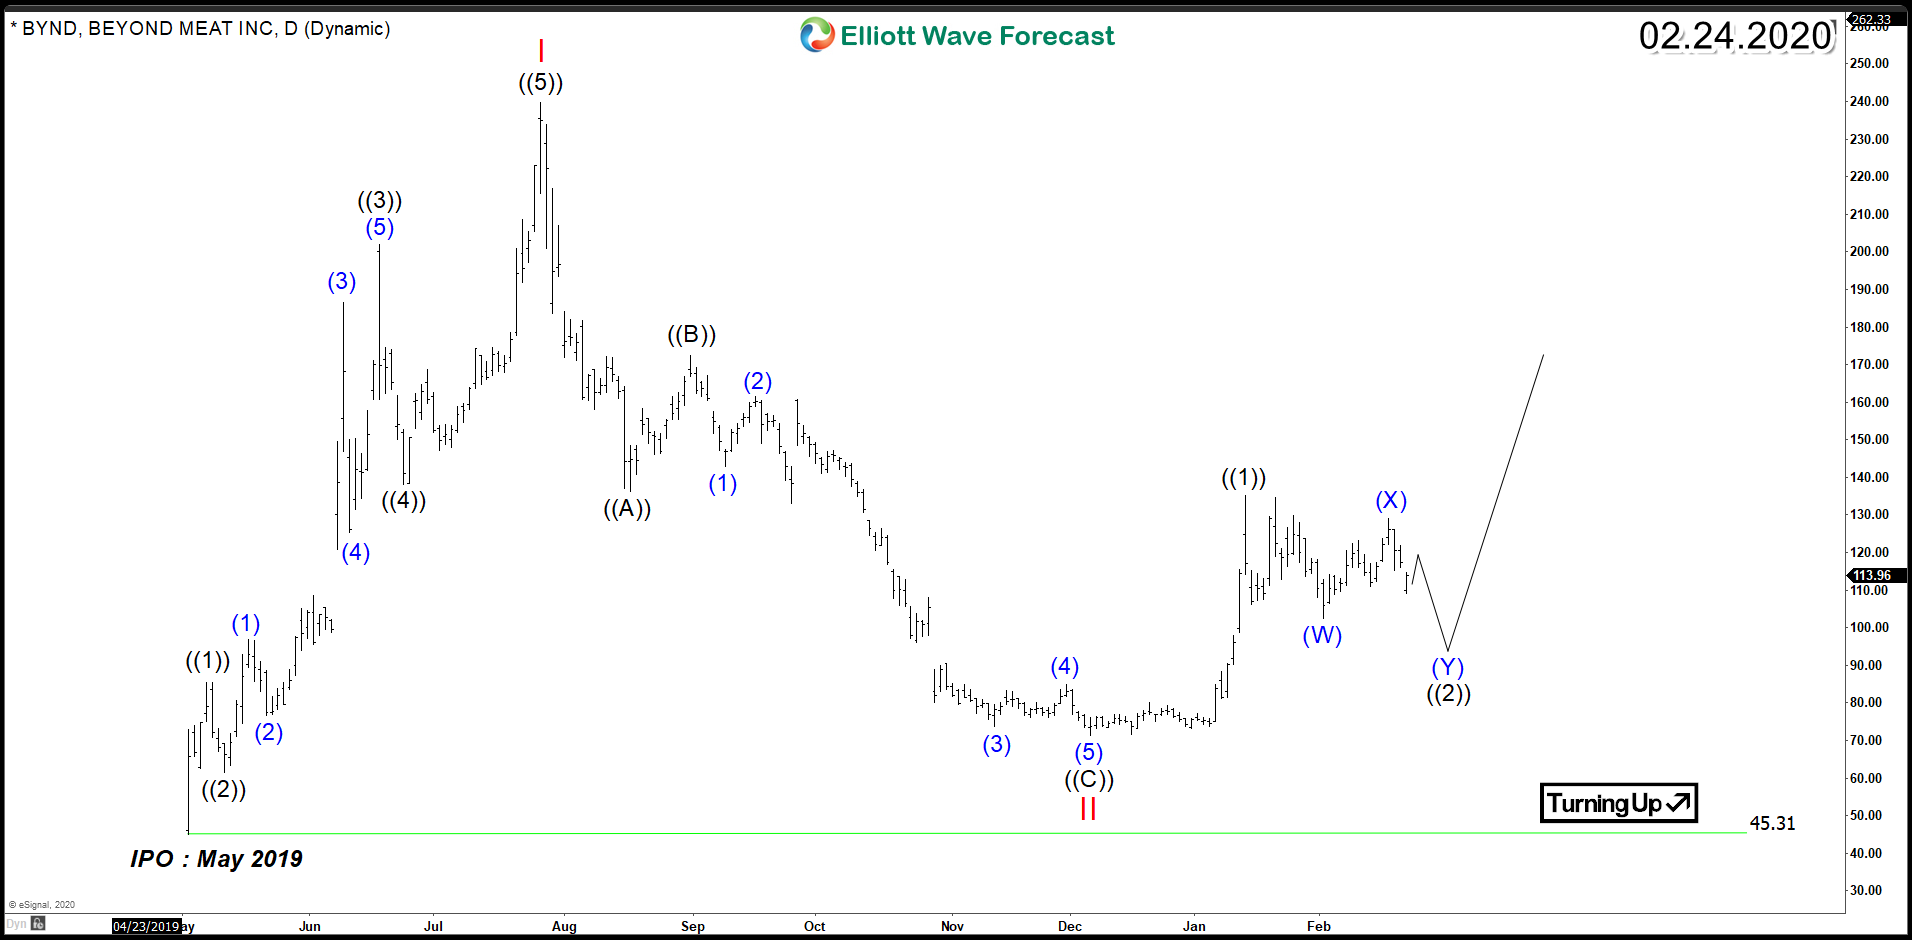
Beyond Meat Inc (NASDAQ: BYND) – Starting an Impulsive Cycle
Read MoreBeyond Meat Inc (NASDAQ: BYND) is a producer of plant-based meat substitutes including products designed to simulate chicken, beef, and pork sausage. After IPO, BYND surged 250% for 3 months then it came down erasing all gains and settling around 15% on December 2019. Last month, the stock soared 46% looking to start a new cycle similar to last year. So let’s […]
-
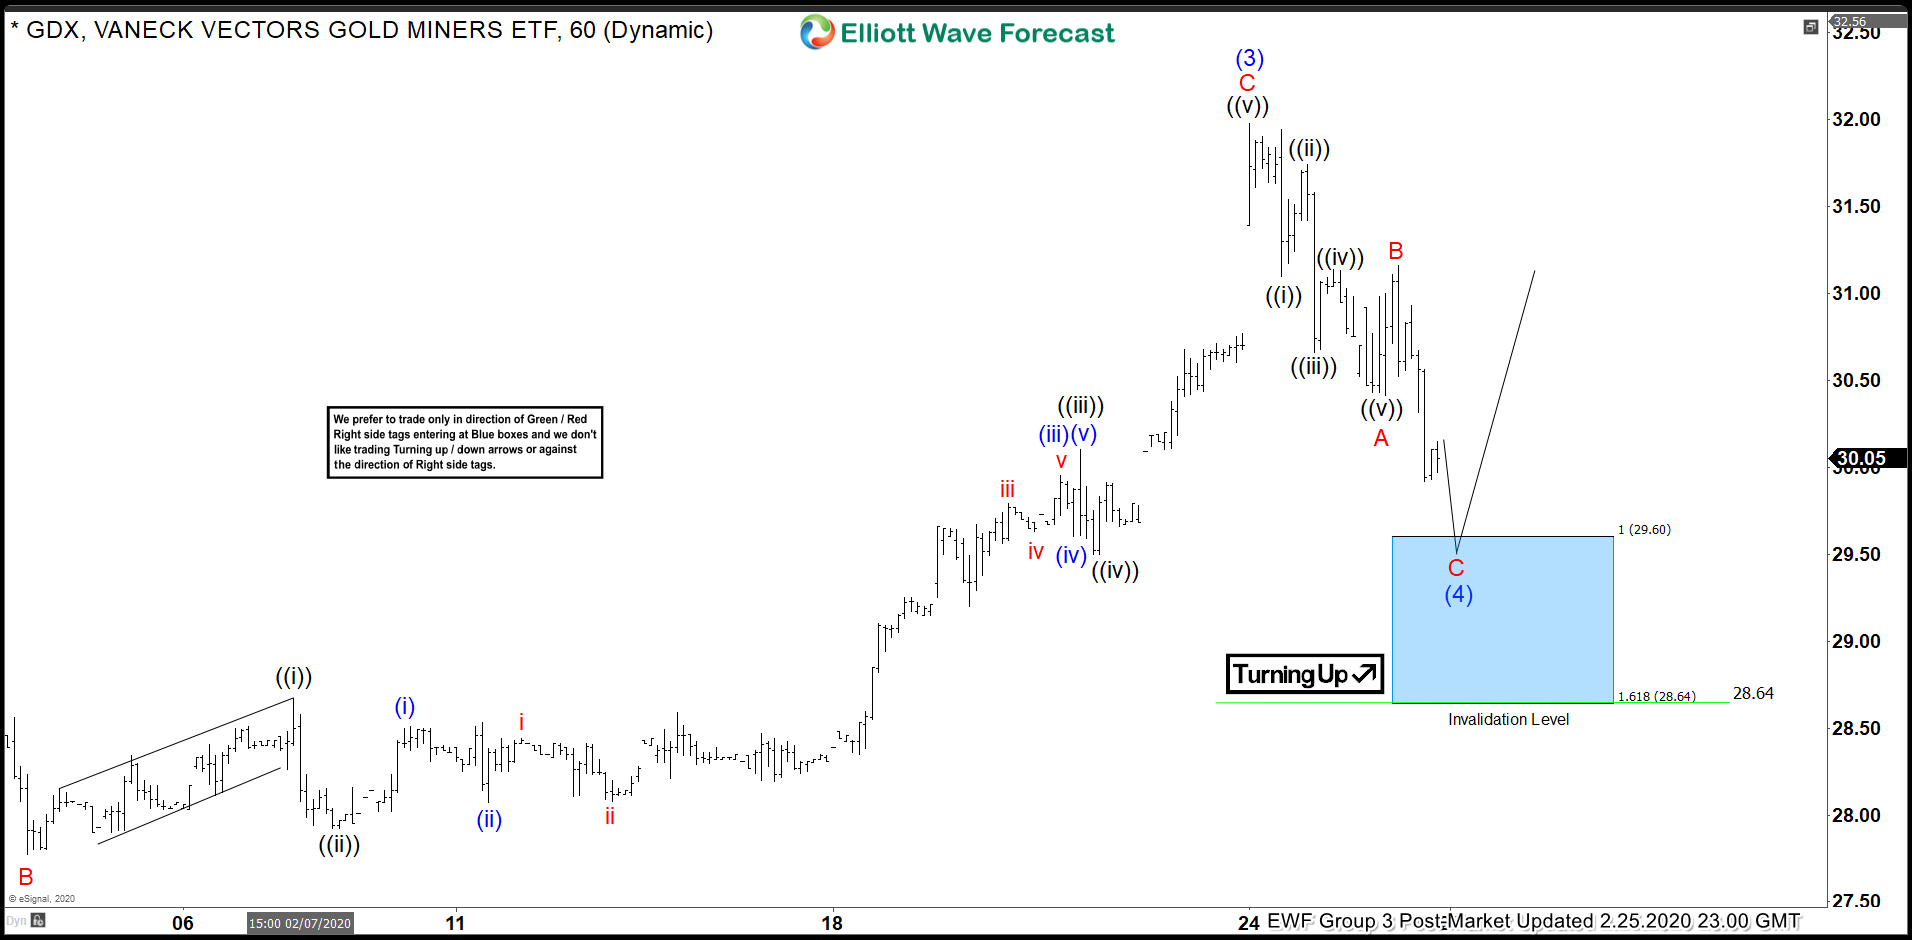
Elliott Wave View : GDX Looking to Extend Higher
Read MoreGDX rally from Nov 2019 low is unfolding as 5 waves and the ETF still can see 1 more push higher at least.This article looks at the Elliott Wave path.
-
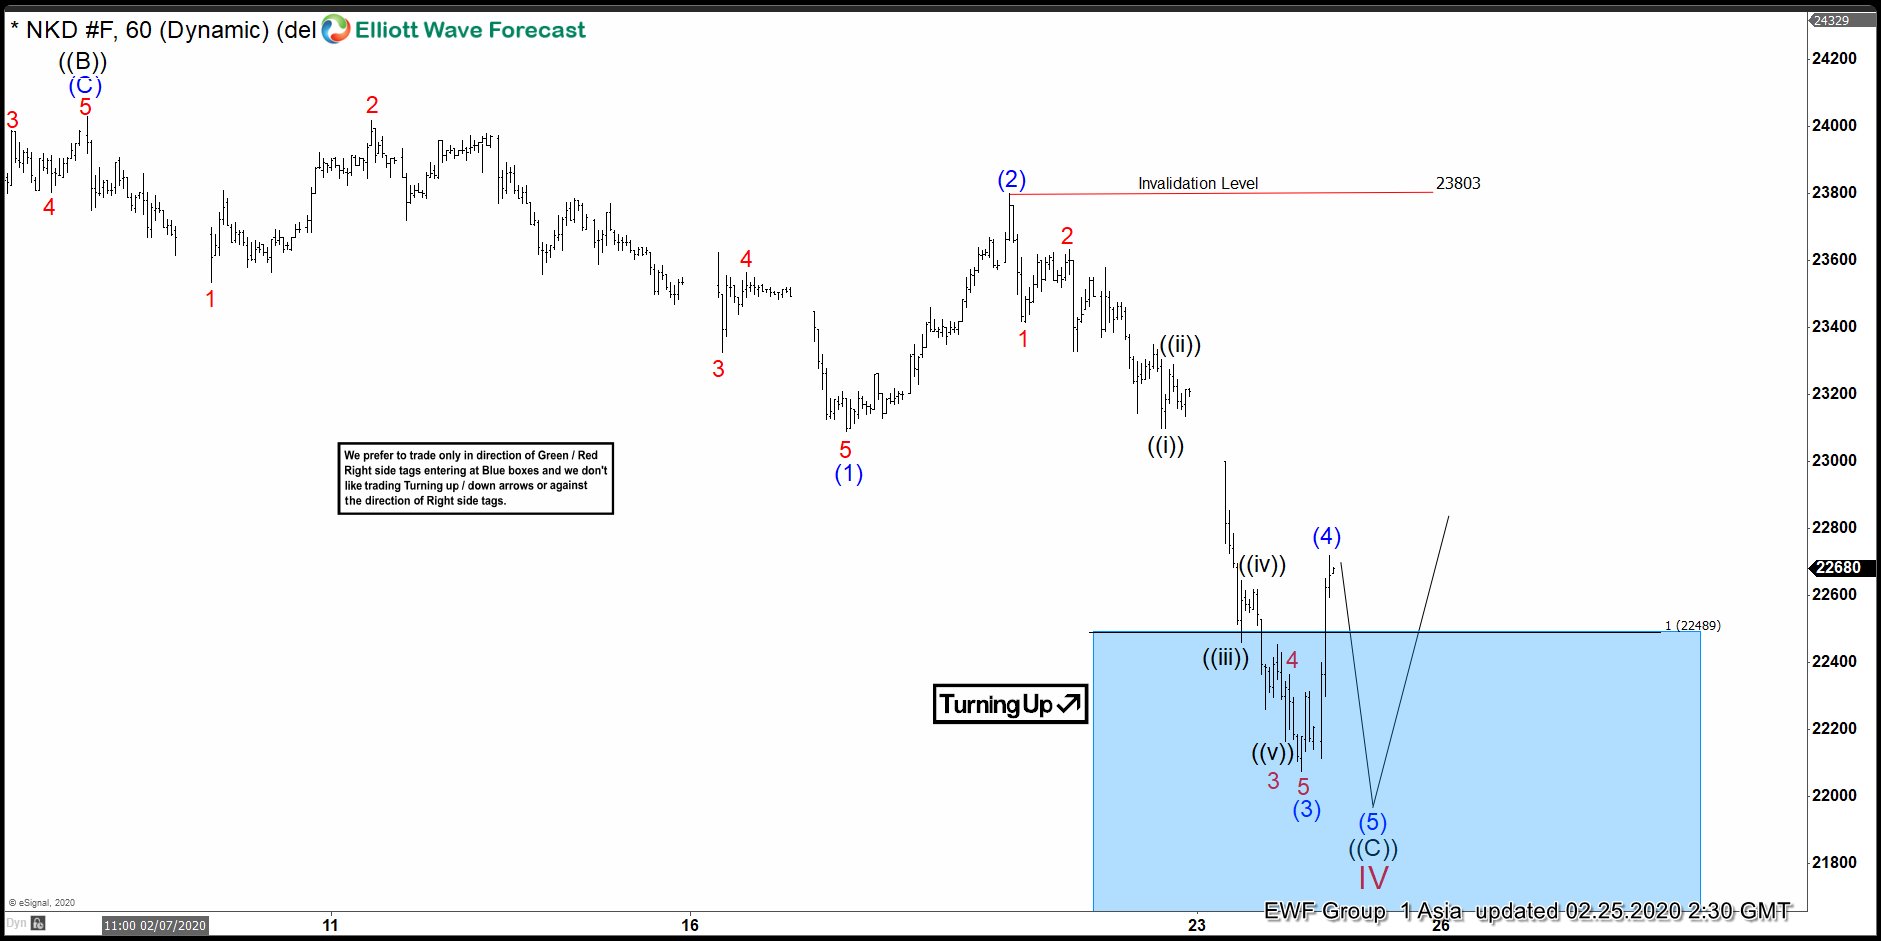
Elliott Wave View: Nikkei (NKD_F) Reaching Support Area
Read MoreNikkei has reached 100% extreme area from December 2019 high and may see support and larger bounce soon.This article looks at the Elliott Wave path.
-
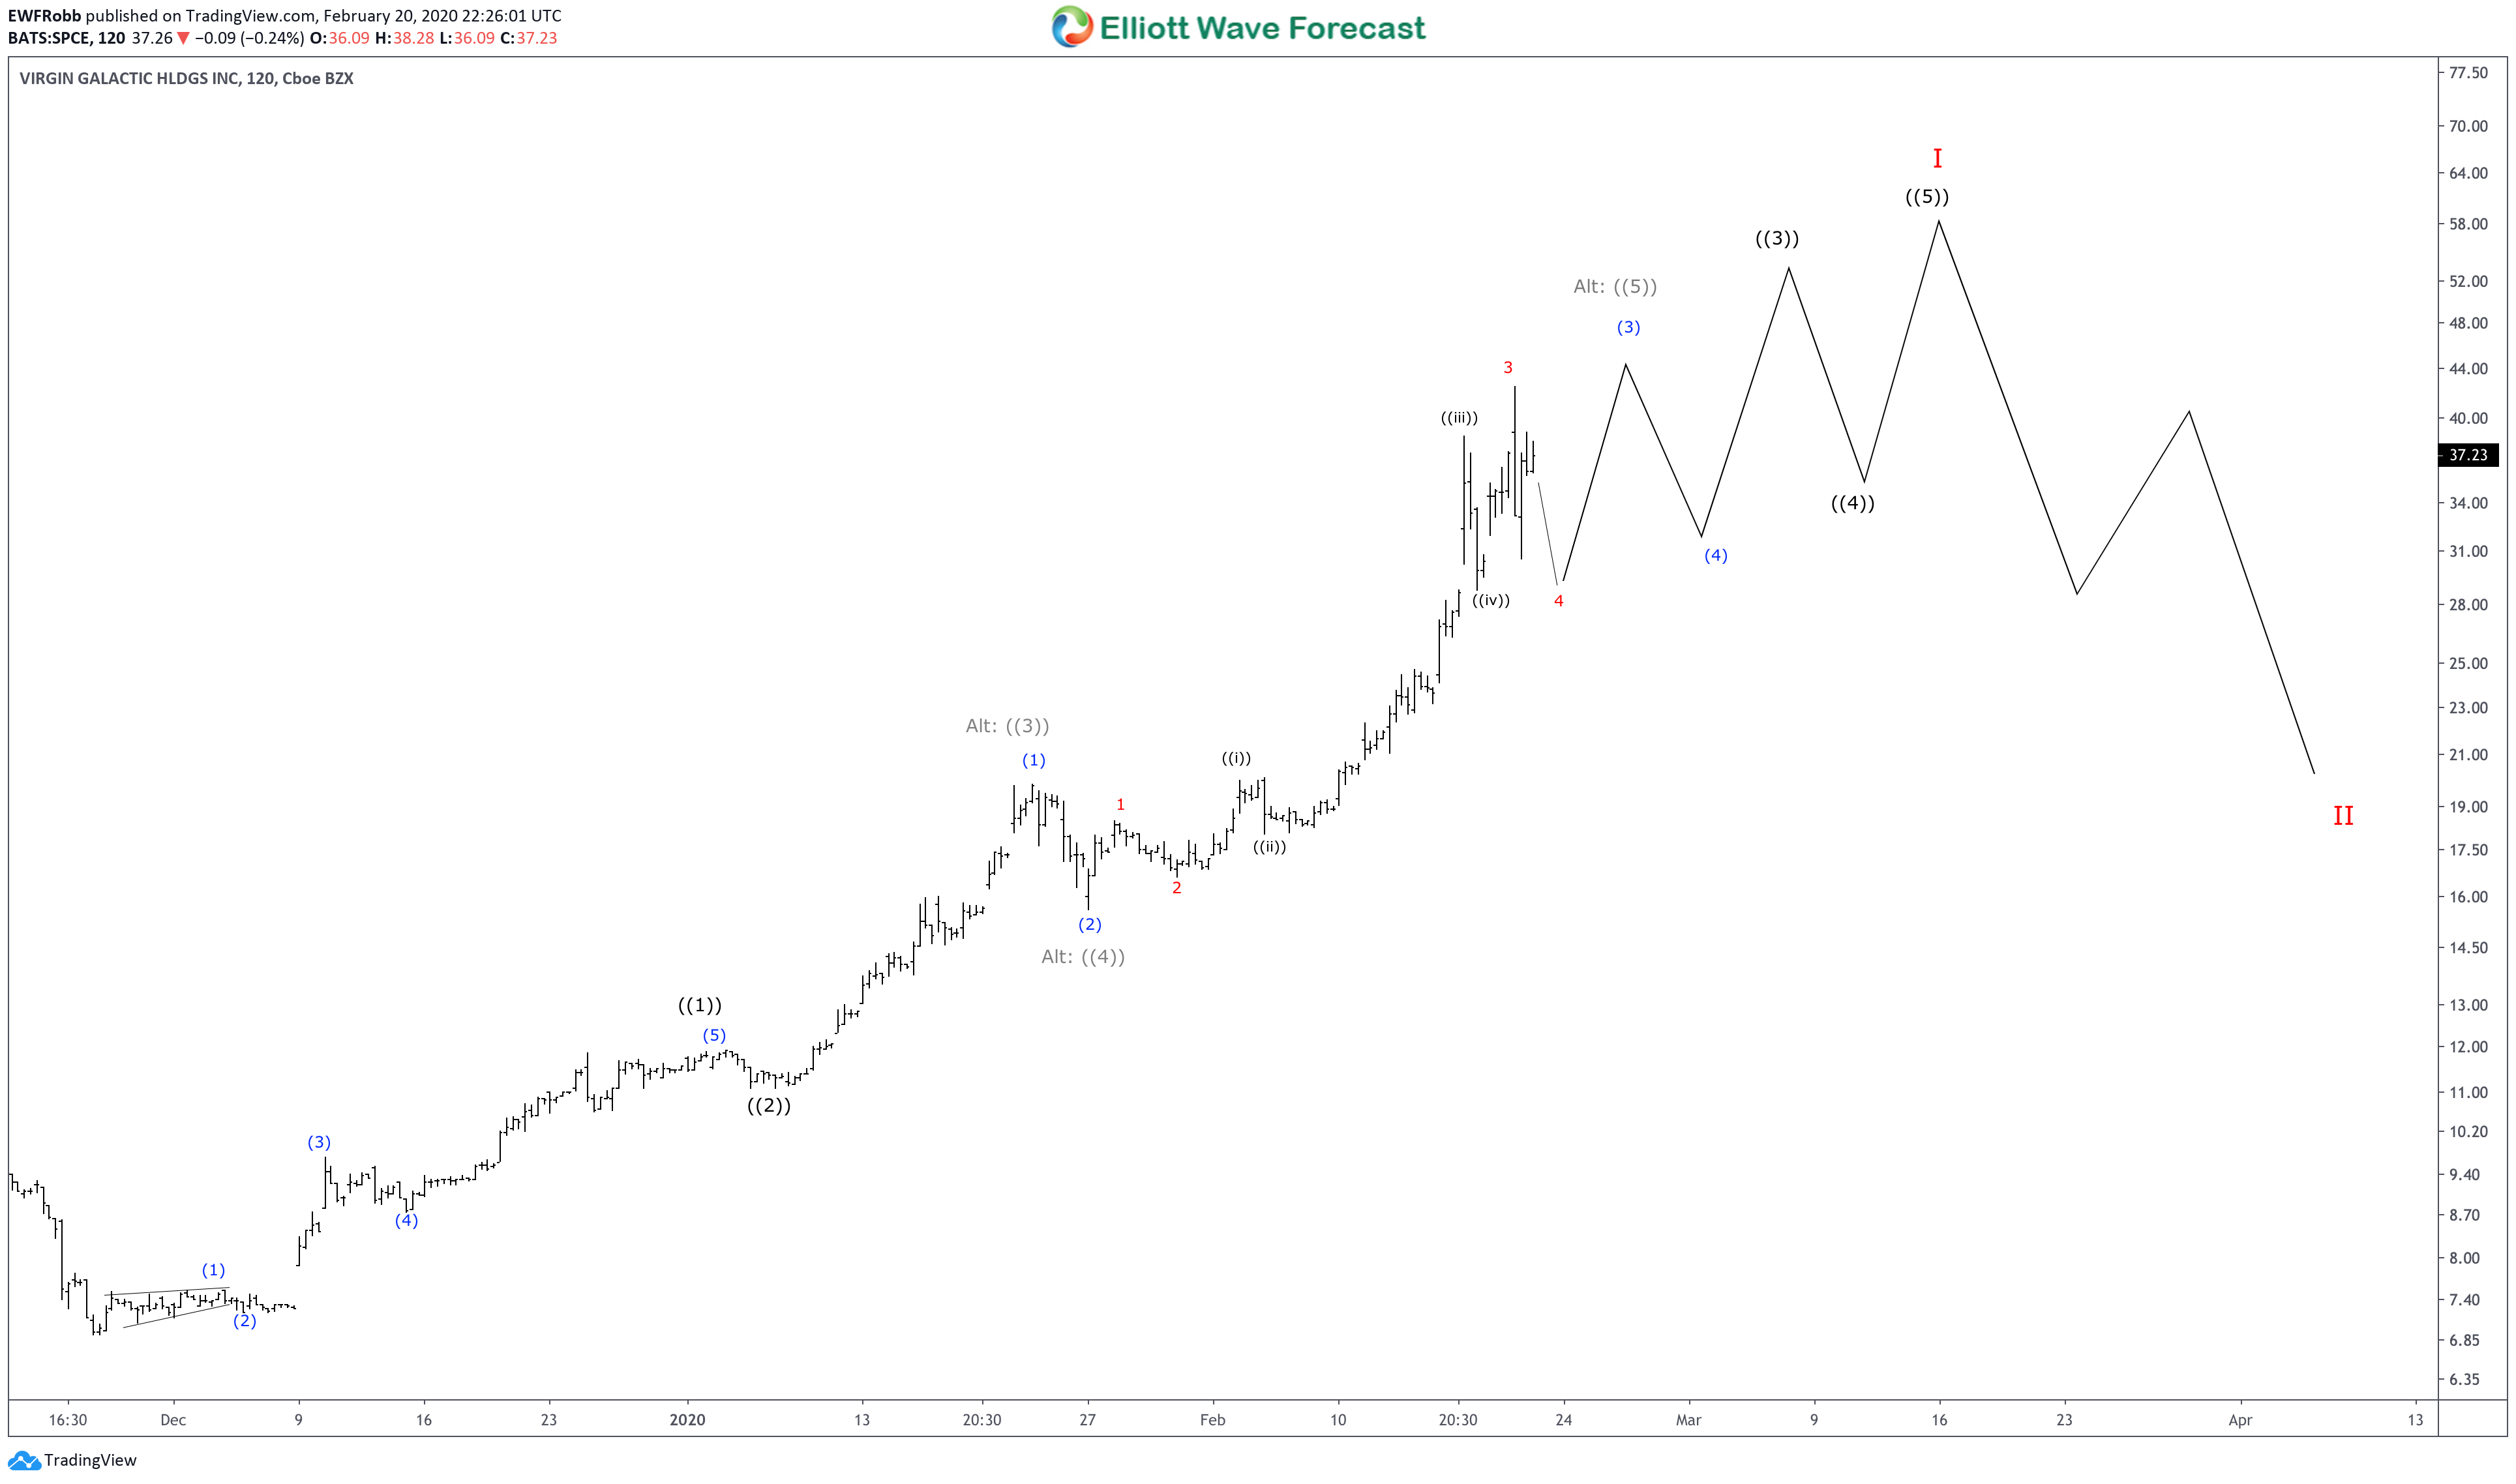
Elliott Wave View: Virgin Galactic ($SPCE) Extending The Impulse
Read MoreVirgin Galactic ($SPCE) has had an impressive rally after setting all time lows after its IPO in the fall of 2019 and continues to impress as it extends the rally in a wave ((3)) impulse. Up from the 11/25/19 lows at 6.90, $SPCE ended a 5 waves cycle on 1/3/20 at 11.90 in wave ((1)) […]