

The Power of 3-7-11 and the Grand Super Cycle: How We Saw the Bullish Turn in April 2025 Back on April 9, 2025, while World Indices were dropping sharply and global sentiment had turned overwhelmingly bearish, we published an article that challenged the fear-driven narrative. We explained why selling was not the right approach and […]
-
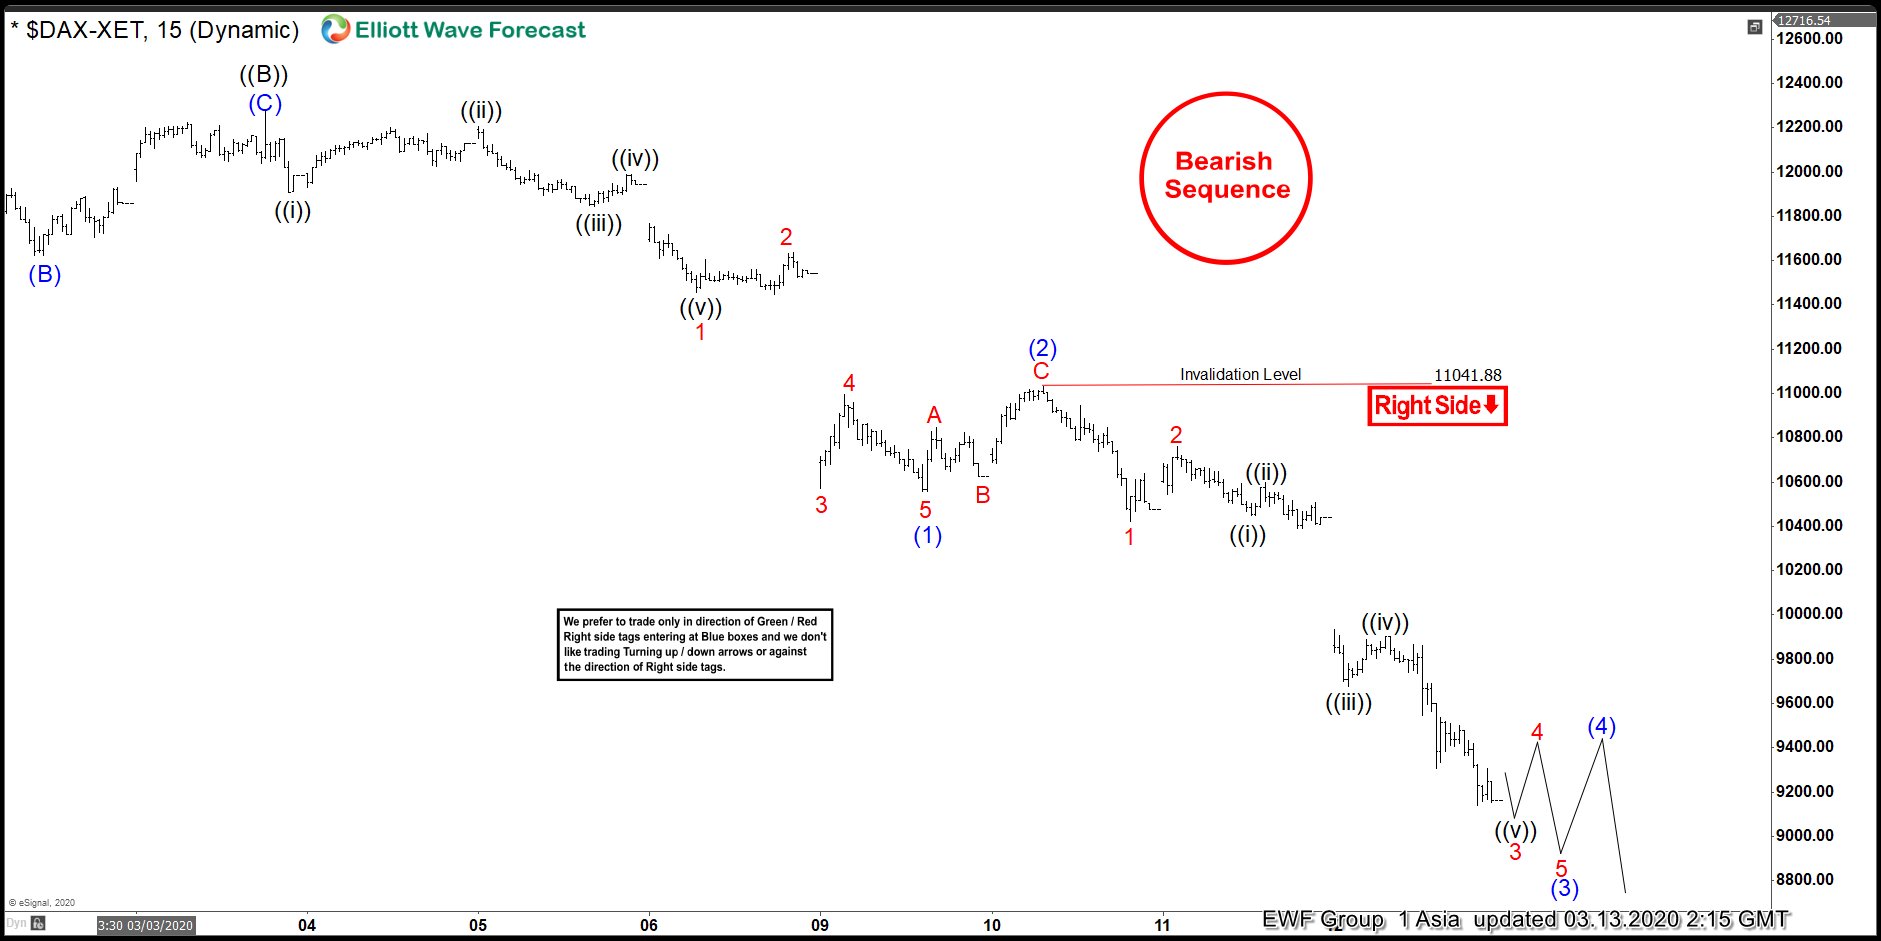
Elliott Wave View: DAX Has Reached Minimum Target
Read MoreDAX has reached the minimum target from Feb 19 peak and may see slowing down of the selloff and consolidate soon. This video look at the elliottwave path.
-
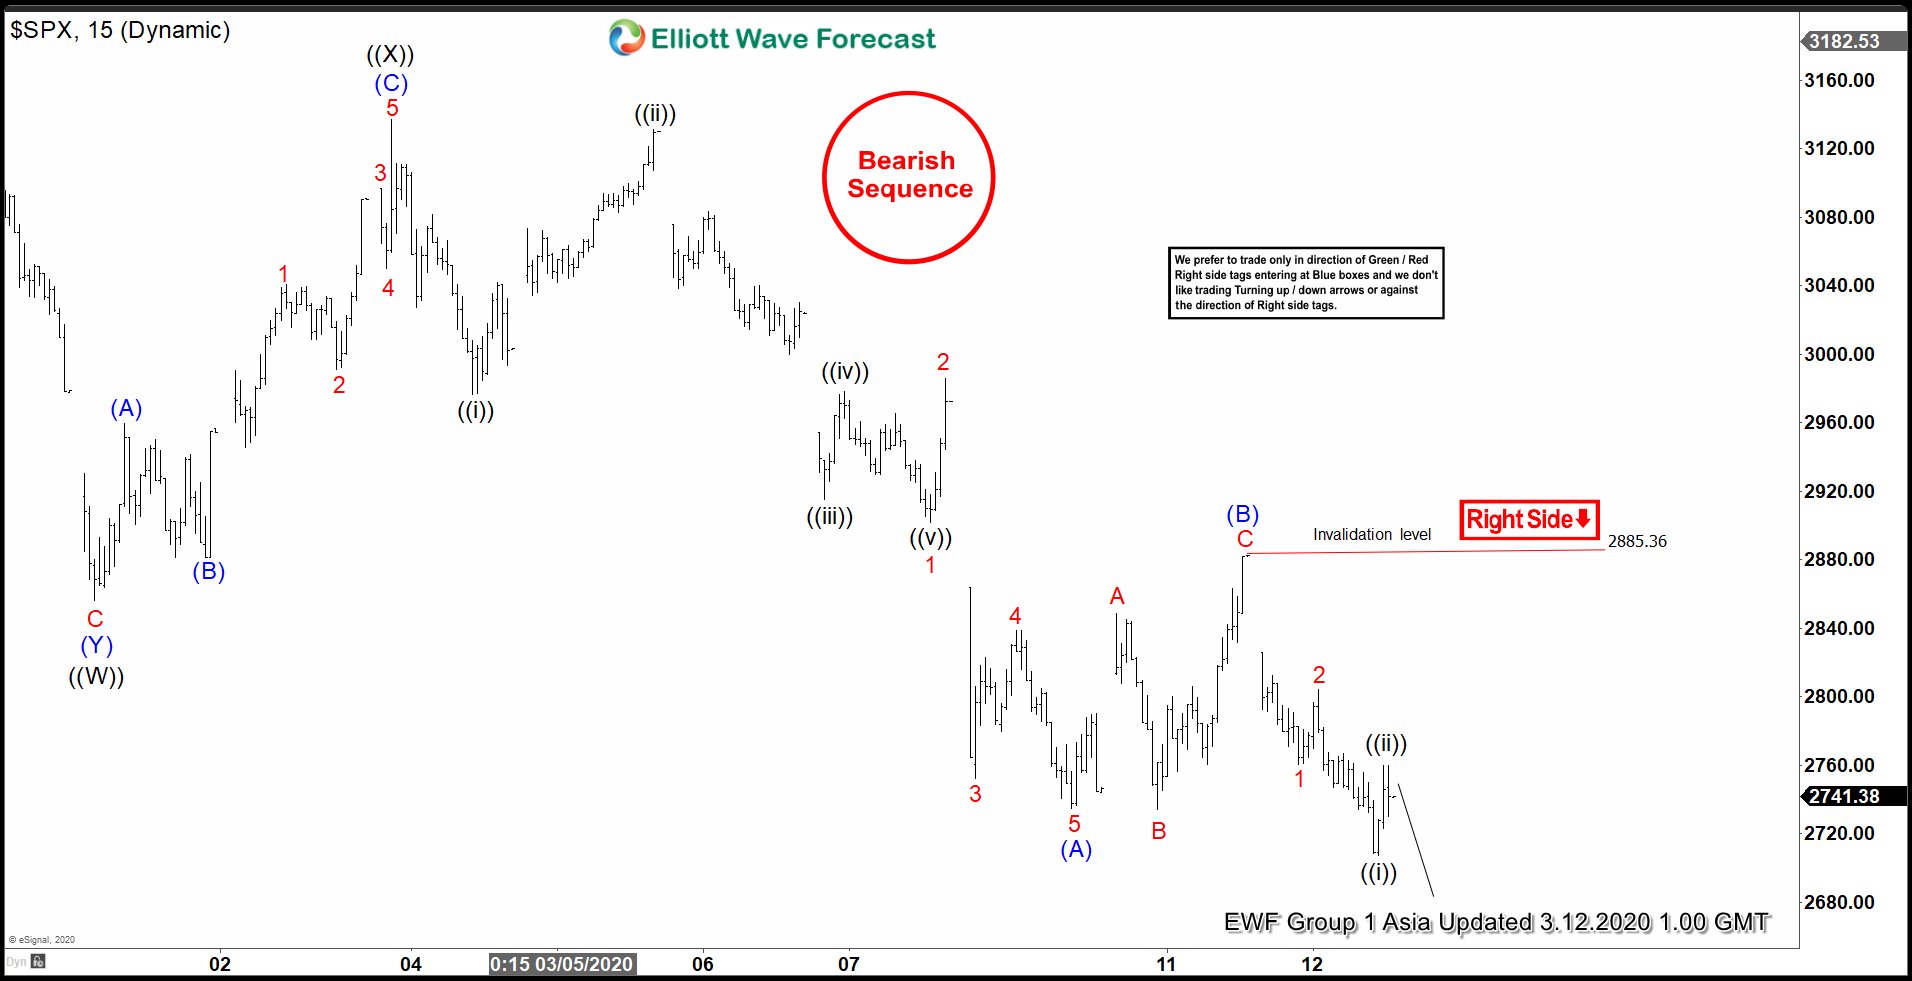
Elliott Wave View : S&P 500 (SPX) Reaching Inflection Area
Read MoreShort term Elliott Wave view in S&P 500 (SPX) suggests cycle from February 19, 2020 high is unfolding as a double three Elliott Wave structure. Down from February 19, 2020 high, wave ((W)) ended at 2855 low. The bounce in wave ((X)) ended at 3136 high. From there, the Index has extended lower and broken […]
-
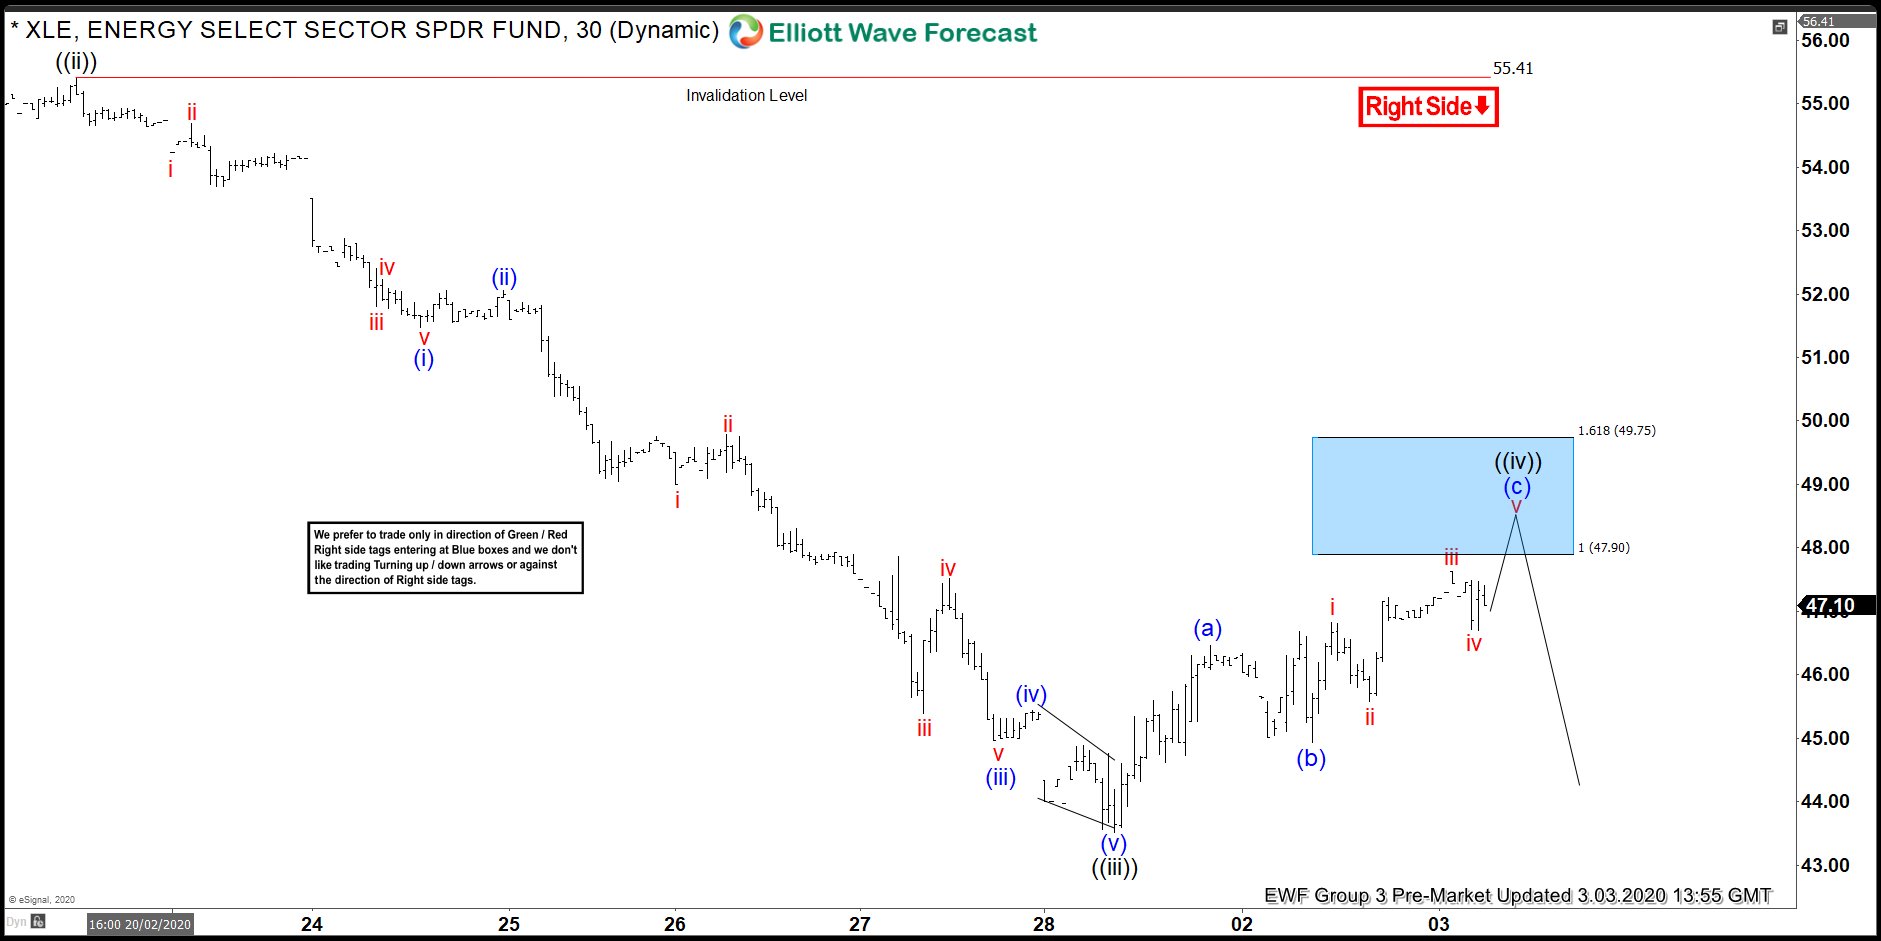
XLE Selling The Short Term Elliott Wave Blue Box Area
Read MoreIn this blog, we take a look at the past performance of 1 hour Elliott Wave charts of XLE In which our members took advantage of the blue box areas.
-
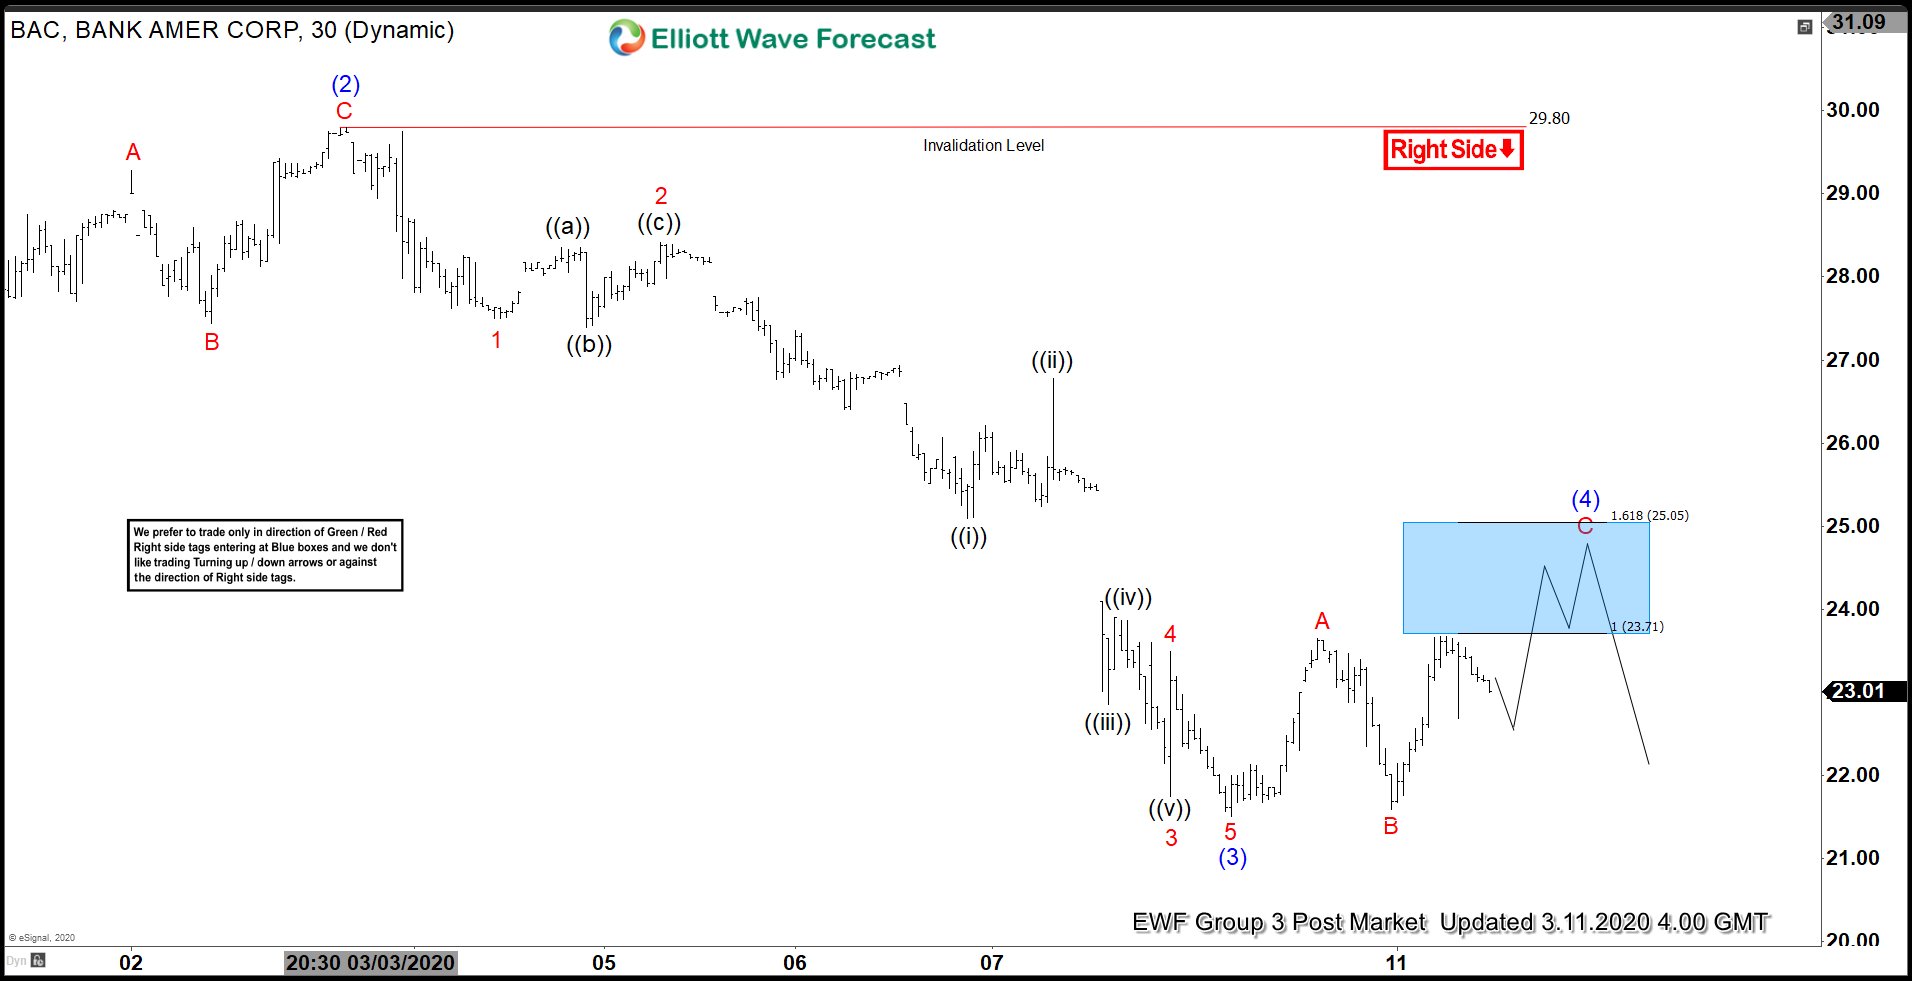
Elliott Wave View: BAC Looking for More Downside
Read MoreBAC shows impulsive structure from December 2019 high, favoring more downside. This article and video look at the Elliottwave path.
-
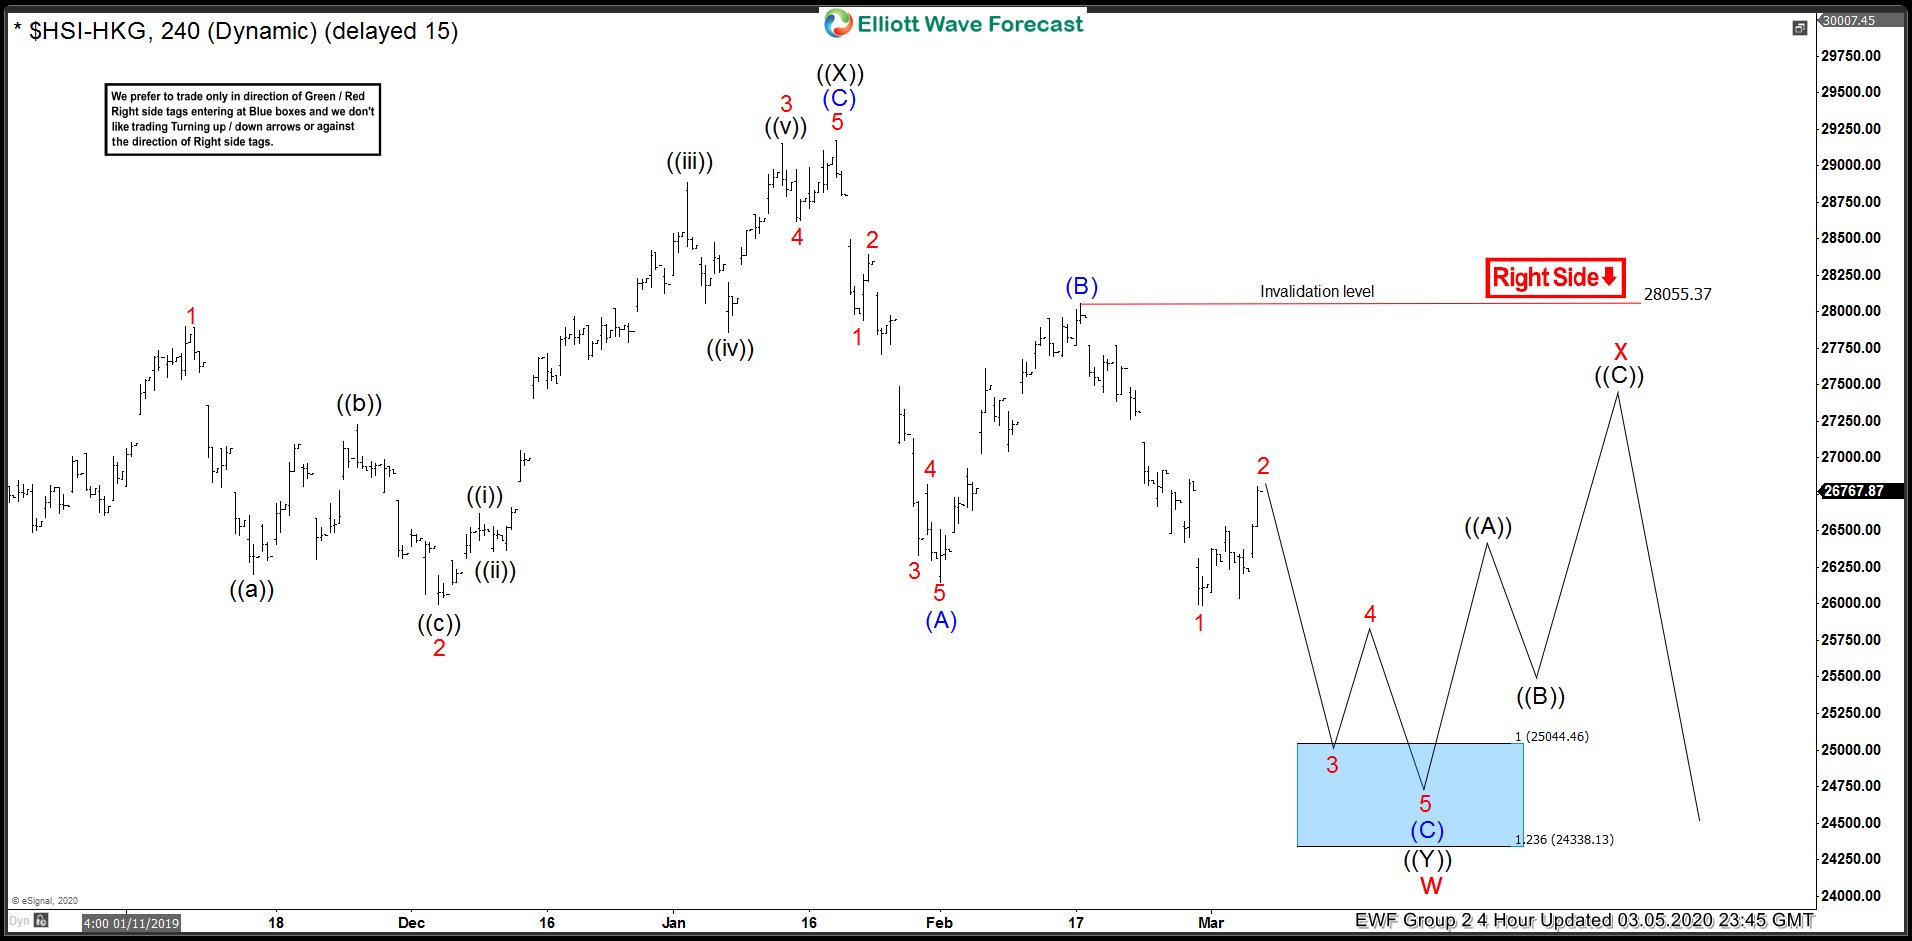
How Hangseng Called for More Downside In US Markets
Read MoreWe at Elliottwave-Foreast.com use a lot of market correlation to derive our forecasts alongside other tools that we use. In this article, we would look at a recent example of Market correlation used in our forecasts and how a Stock Market from Asia (Hangseng) kept us on the right side in US Indices by calling […]
-
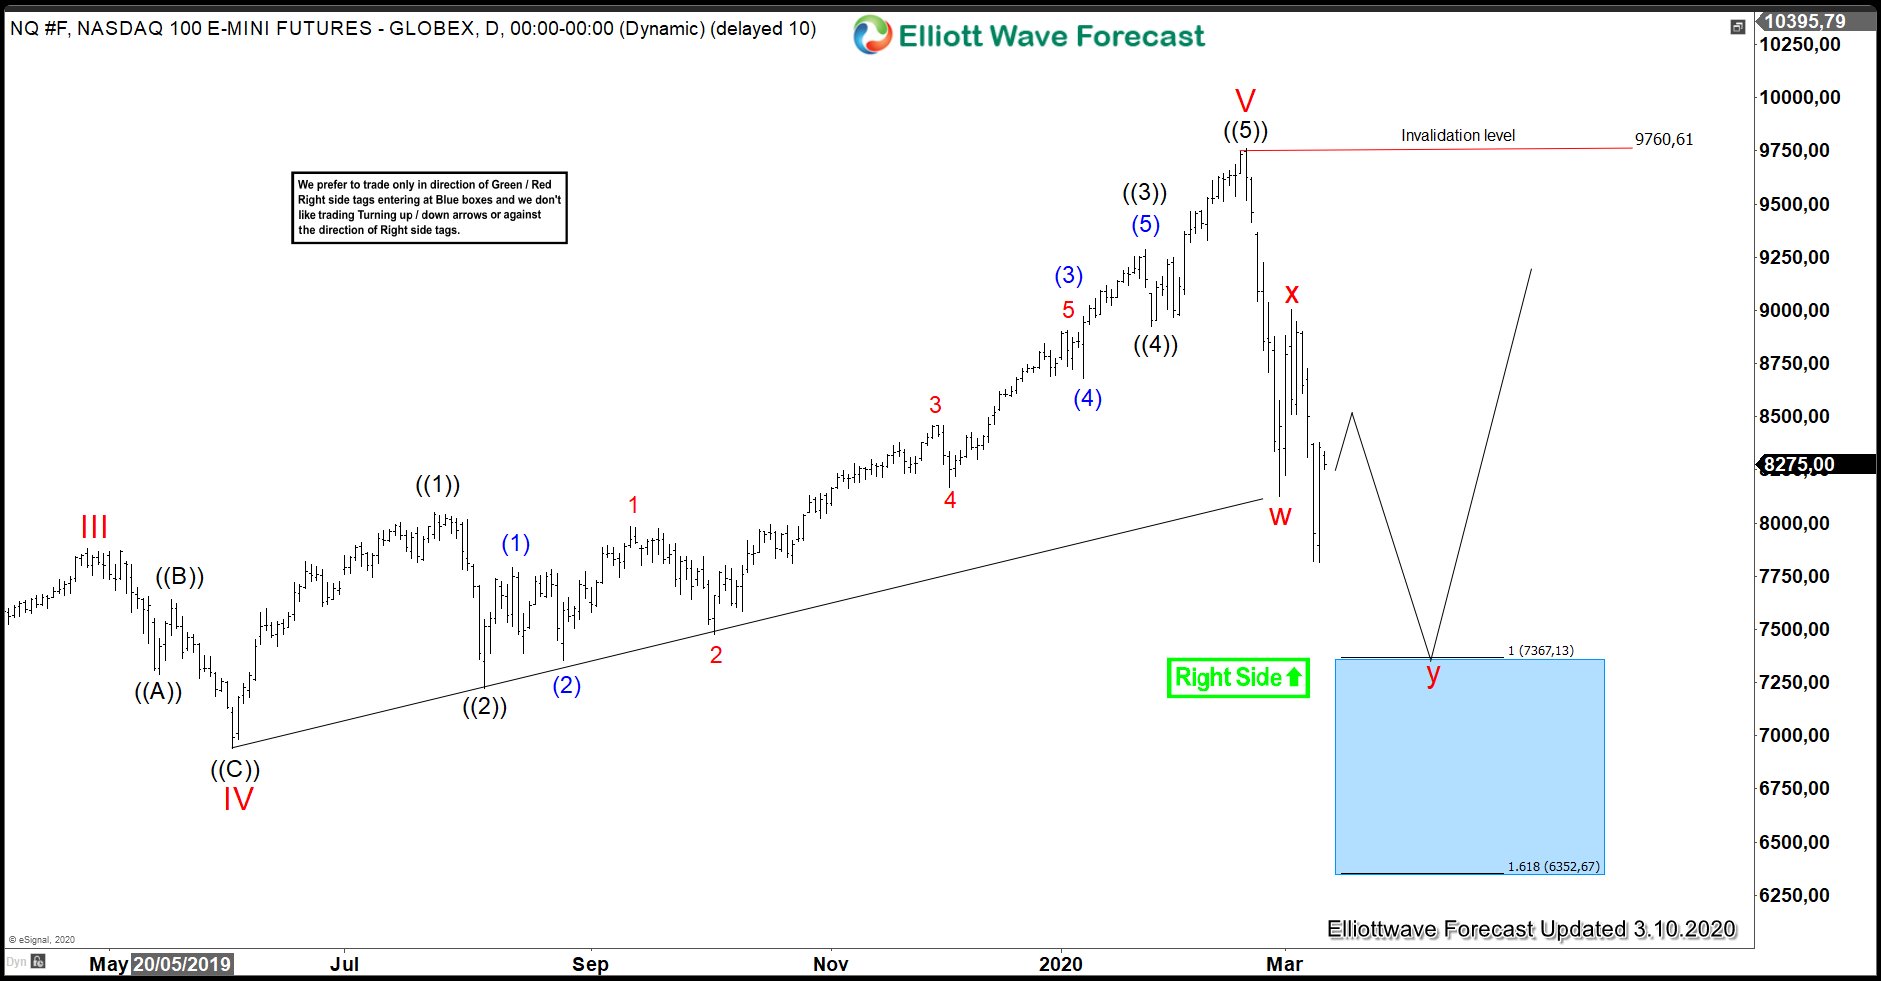
NASDAQ (NQ_F) Incomplete Sequence Targeting Lower
Read MoreIn this blog, we are going to take a look at the Elliottwave chart of NASDAQ. Based on the daily chart shown below, NASDAQ has ended the rally from 2009 low at 9760.61 high. The index is now correcting that cycle. The correction is unfolding as a double three and has an incomplete sequence. The […]