

The Power of 3-7-11 and the Grand Super Cycle: How We Saw the Bullish Turn in April 2025 Back on April 9, 2025, while World Indices were dropping sharply and global sentiment had turned overwhelmingly bearish, we published an article that challenged the fear-driven narrative. We explained why selling was not the right approach and […]
-
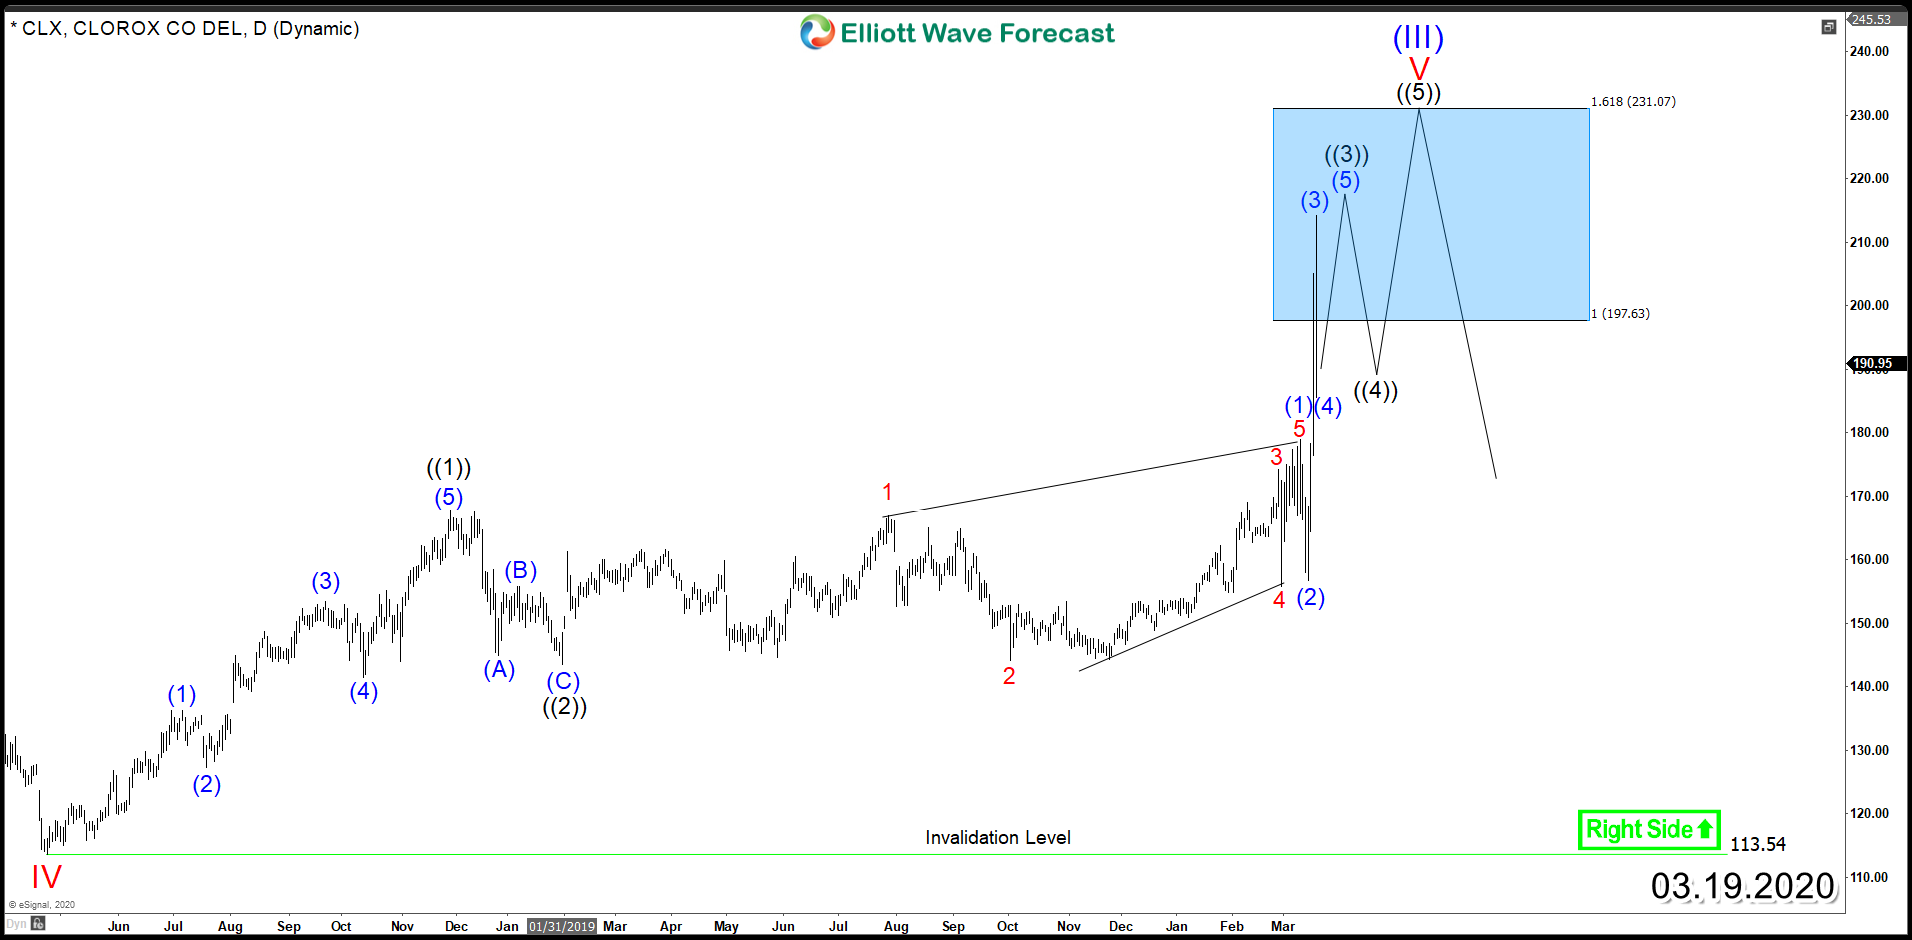
The Clorox Company (NYSE: CLX) Ending an Impulsive Cycle
Read MoreThe Clorox Company (NYSE: CLX) is an American global manufacturer and marketer of consumer and professional products. Its’s brands include its namesake bleach and cleaning products. During a pandemic, the demand for sanitizing products rises significantly which helped Clorox to avoid steep declines in the recent weeks as rest of the stock market was plunging down. The […]
-
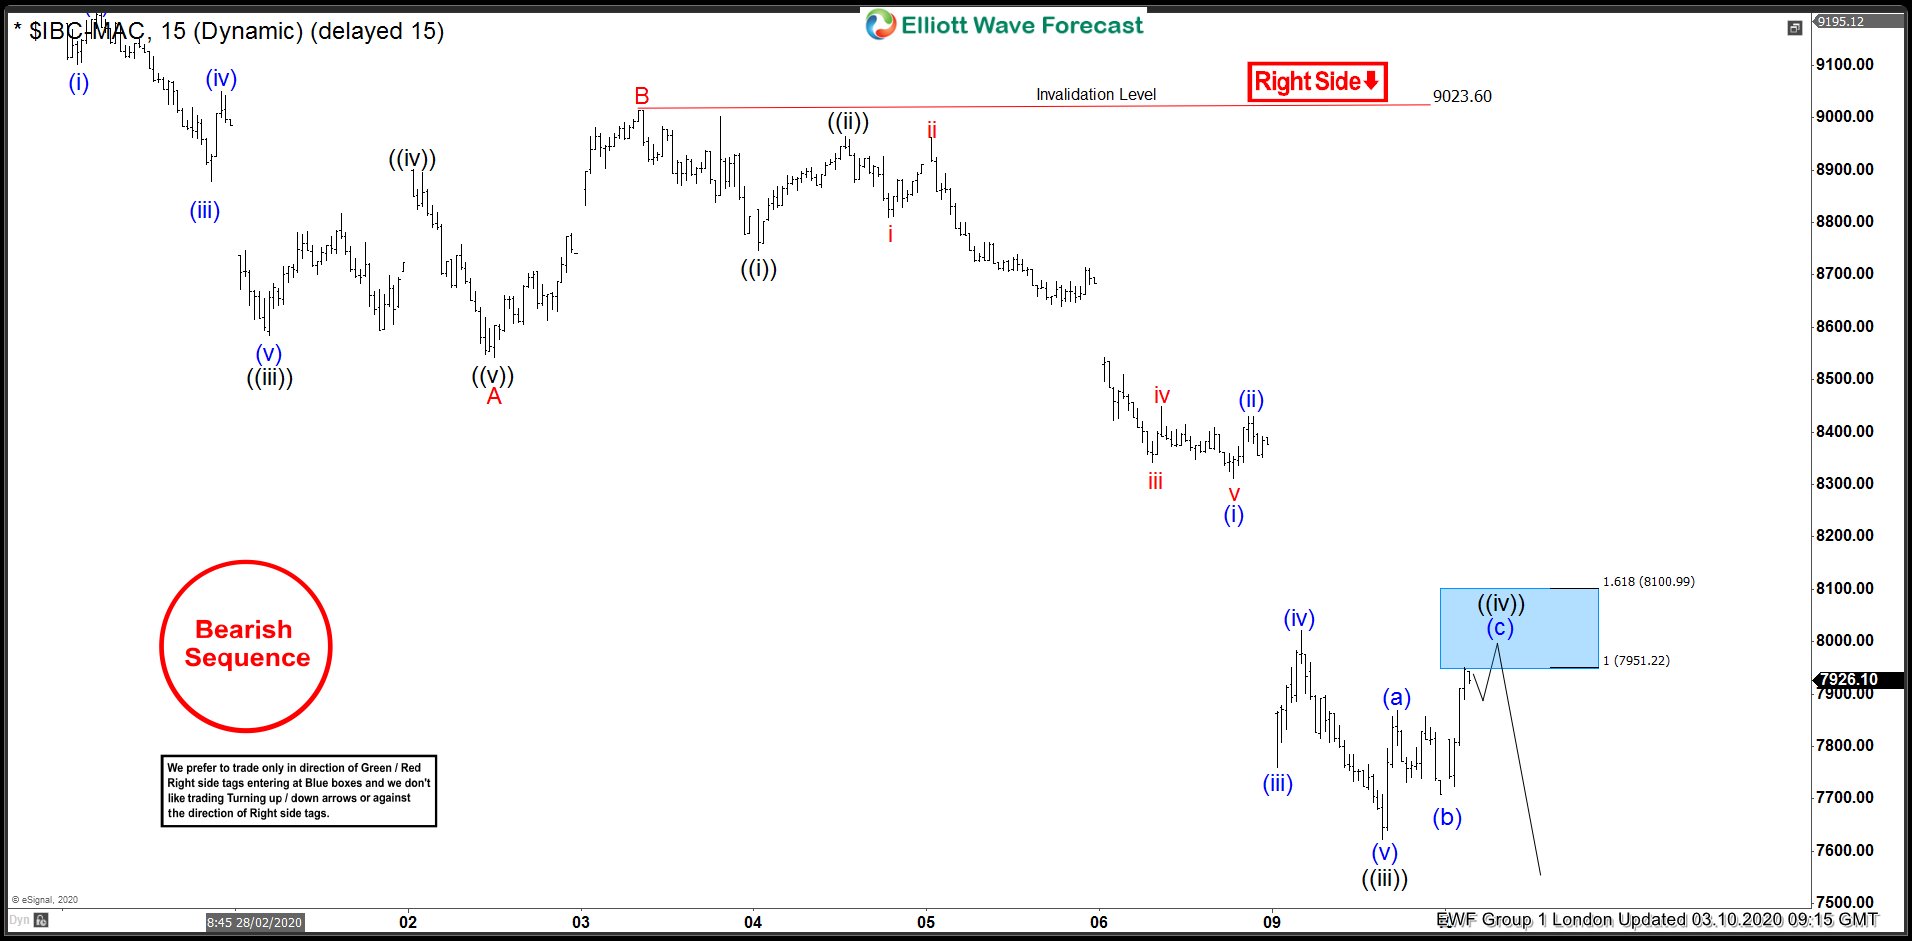
IBEX Elliott Wave: Right Side Favored More Downside
Read MoreIn this blog, we take a look at the past performance of 1 hour Elliott Wave charts of IBEX In which our members took advantage of the blue box areas.
-
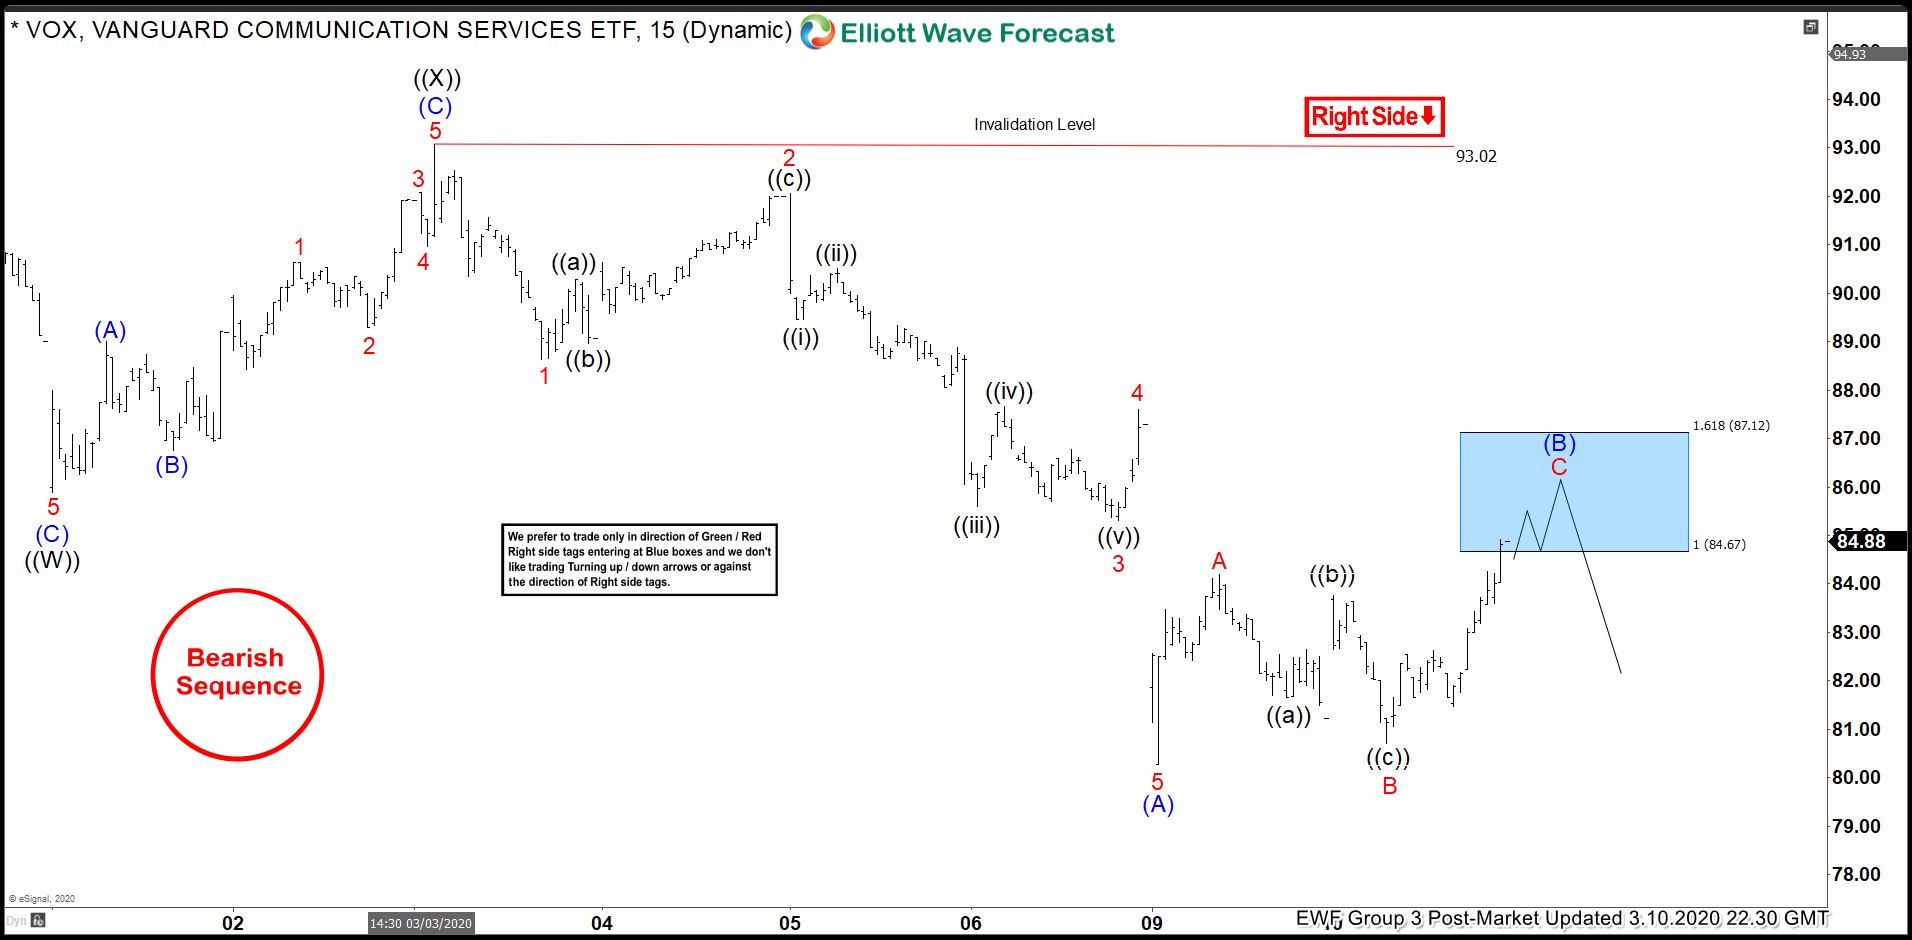
VOX Elliott Wave View: Selling The Blue Box Areas
Read MoreIn this blog, we take a look at the past performance of 1 hour Elliott Wave charts of VOX In which our members took advantage of the blue box areas.
-
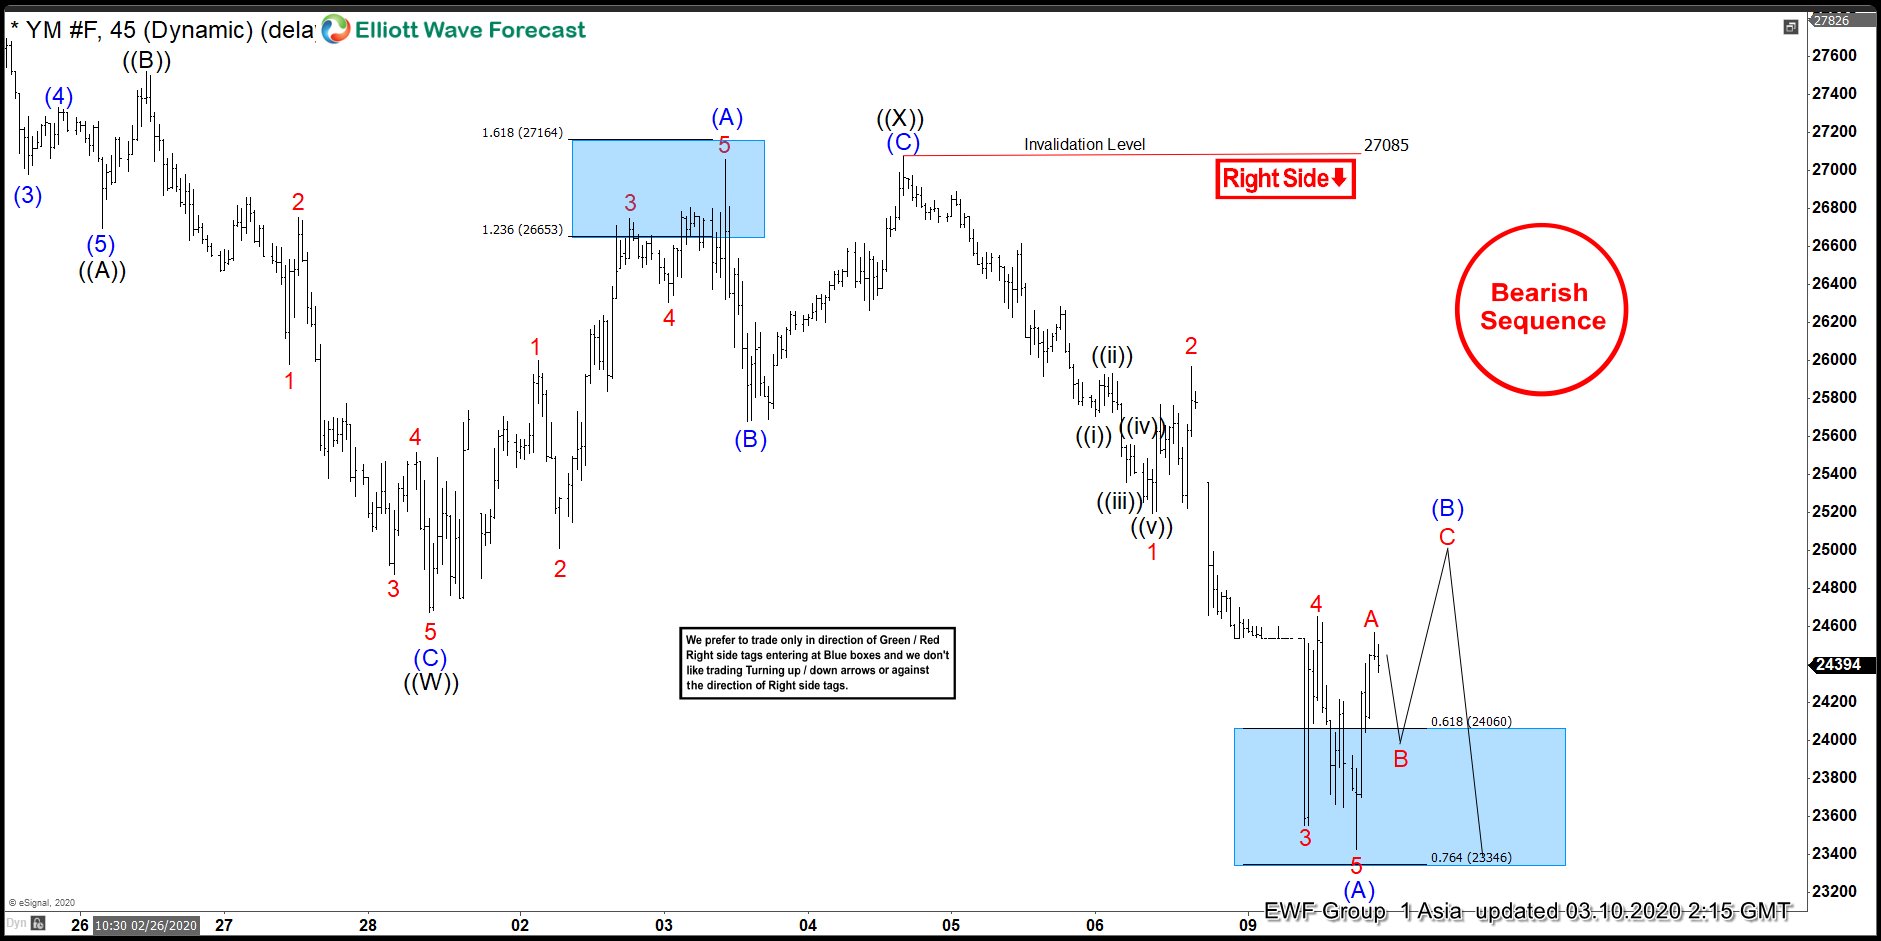
INDU ( $YM_F ) Elliott Wave : Forecasting The Path
Read MoreHello fellow traders. In this technical blog we’re going to take a quick look at the Elliott Wave charts of INDU ( $YM_F) , published in members area of the website. As our members know , recently we were calling for more weakness in INDU within the cycle from the February 12th peak. Eventually INDU […]
-
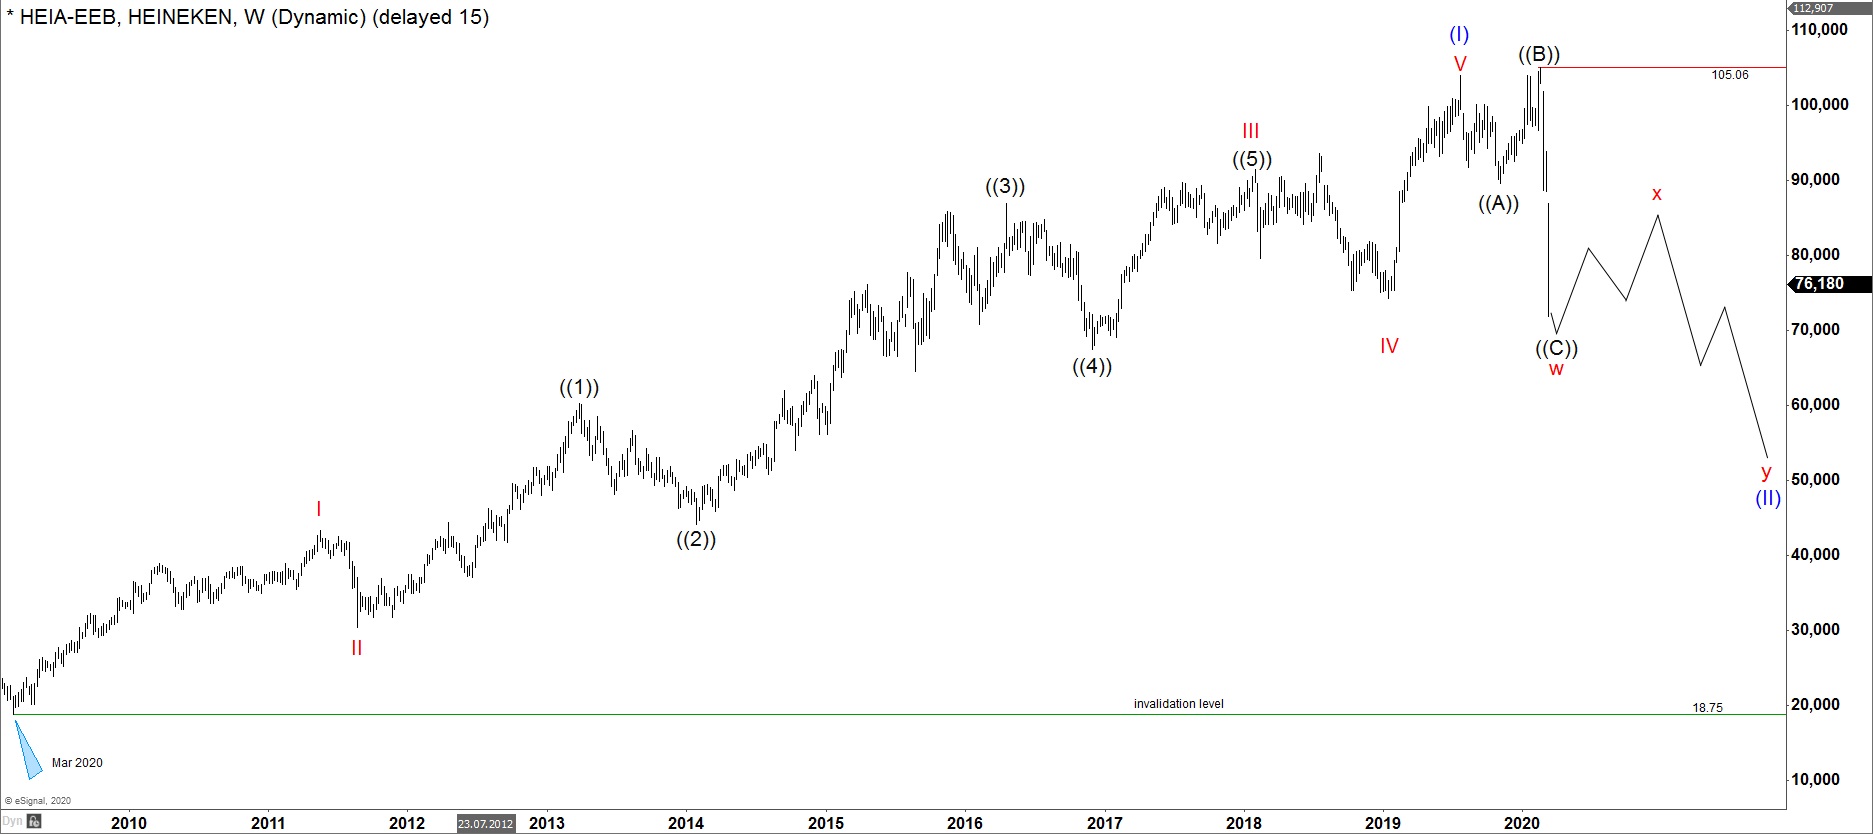
$HEIA : Mort subite owner Heineken is correcting 2009 cycle
Read MoreIn recent days, the dutch stock Heineken has attracted a reasonable public attention as it also owns the Mort subite brand. In popular culture, the beer Mort subite goes with the Corona beer. “For 2x Coronas one can obtain 1x Mort Subite (sudden death, cardiac arrest) for free”. From the February 2020, the Heineken stock […]
-
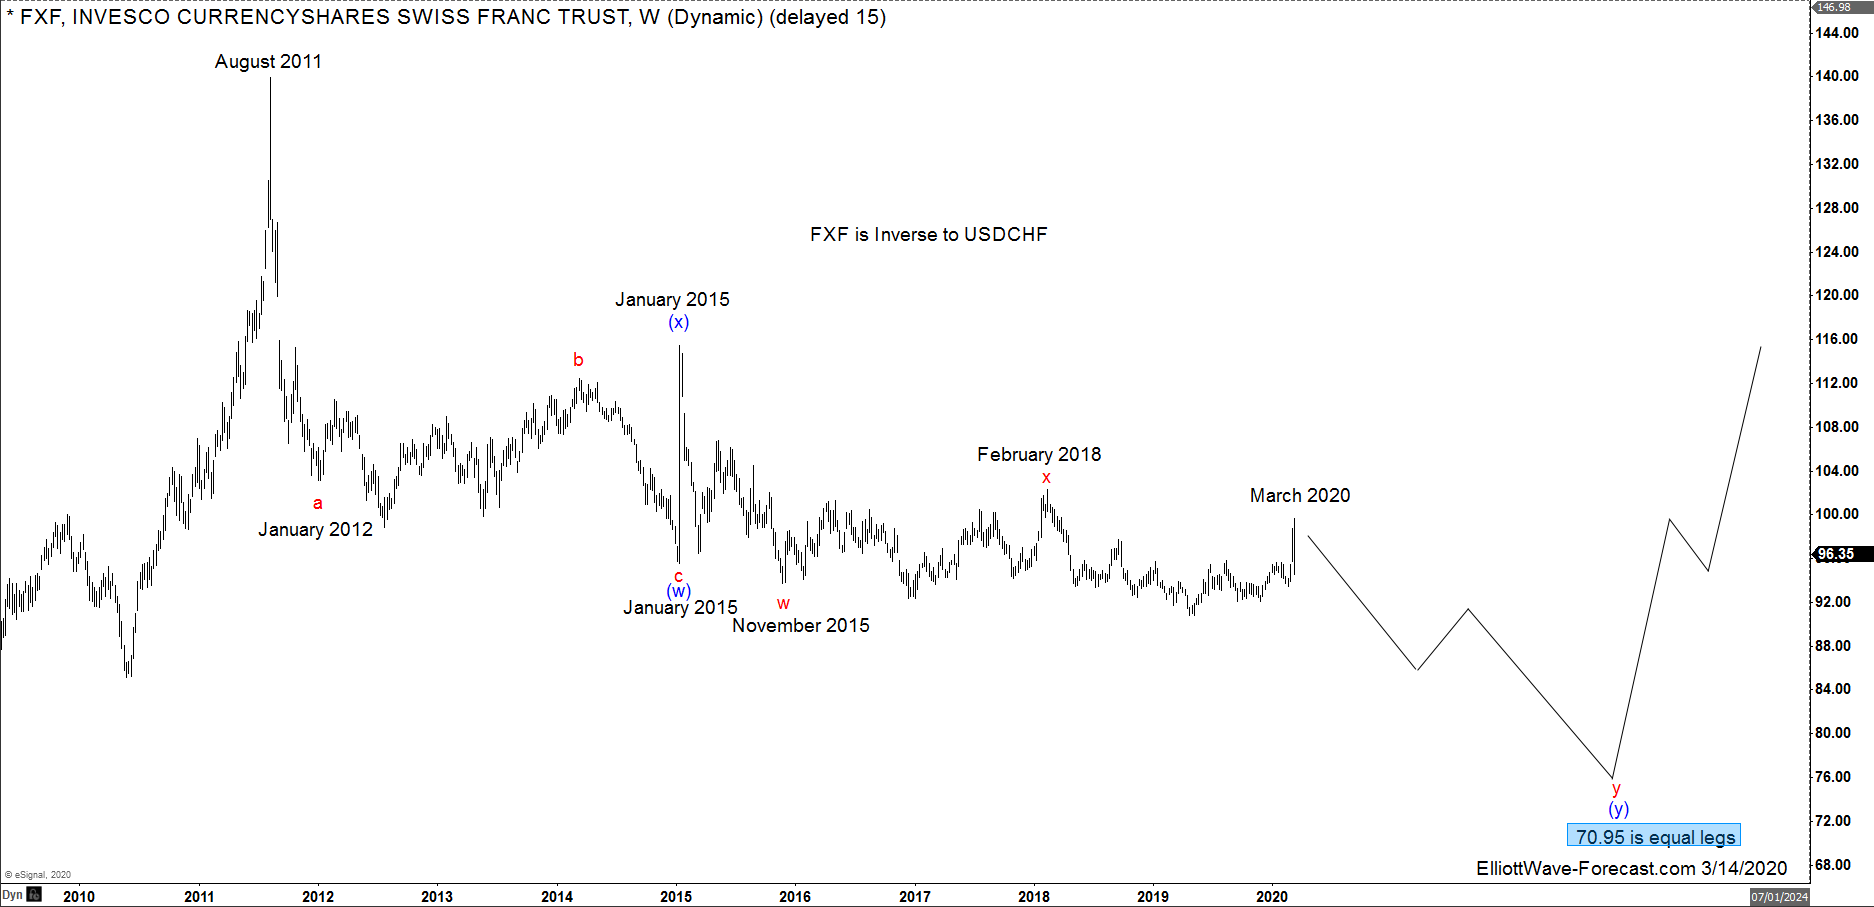
$FXF Longer Term Cycles and Elliott Wave
Read More$FXF Longer Term Cycles and Elliott Wave Firstly there is data back to when the ETF fund began in 2006 as low as 78.43. Data correlated in the USDCHF foreign exchange pair suggests the FXF high in August 2011 is also the lows of a cycle lower from the all time in the USDCHF. In this instrument there […]