

The Power of 3-7-11 and the Grand Super Cycle: How We Saw the Bullish Turn in April 2025 Back on April 9, 2025, while World Indices were dropping sharply and global sentiment had turned overwhelmingly bearish, we published an article that challenged the fear-driven narrative. We explained why selling was not the right approach and […]
-
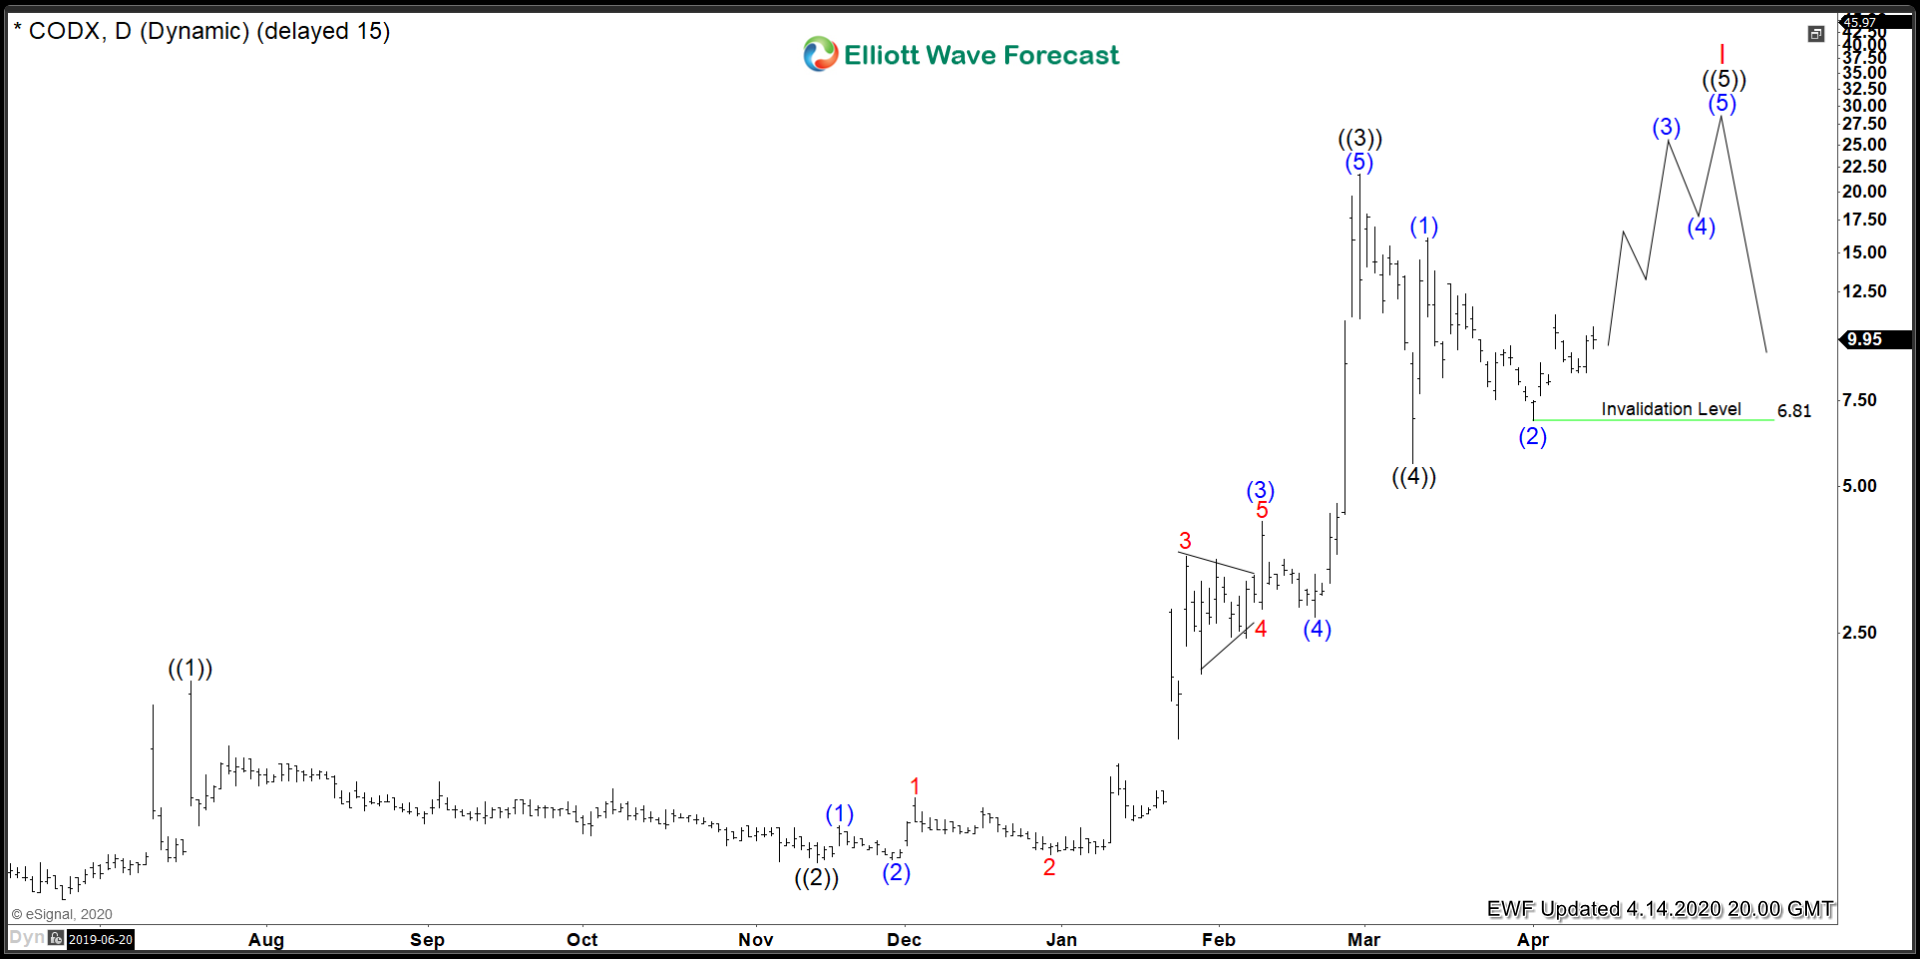
Co-Diagnostics ($CODX) Still Bullish
Read MoreContinuing along the theme of Corona Virus stocks, Co-Diagnostics is next up in line. Co-Diagnostics Inc. is one of those names that has also gone parabolic with the COVID-19 spreading worldwide. It still remains very technical, and I think there could be one more leg up before the rally is complete. Lets take a look […]
-
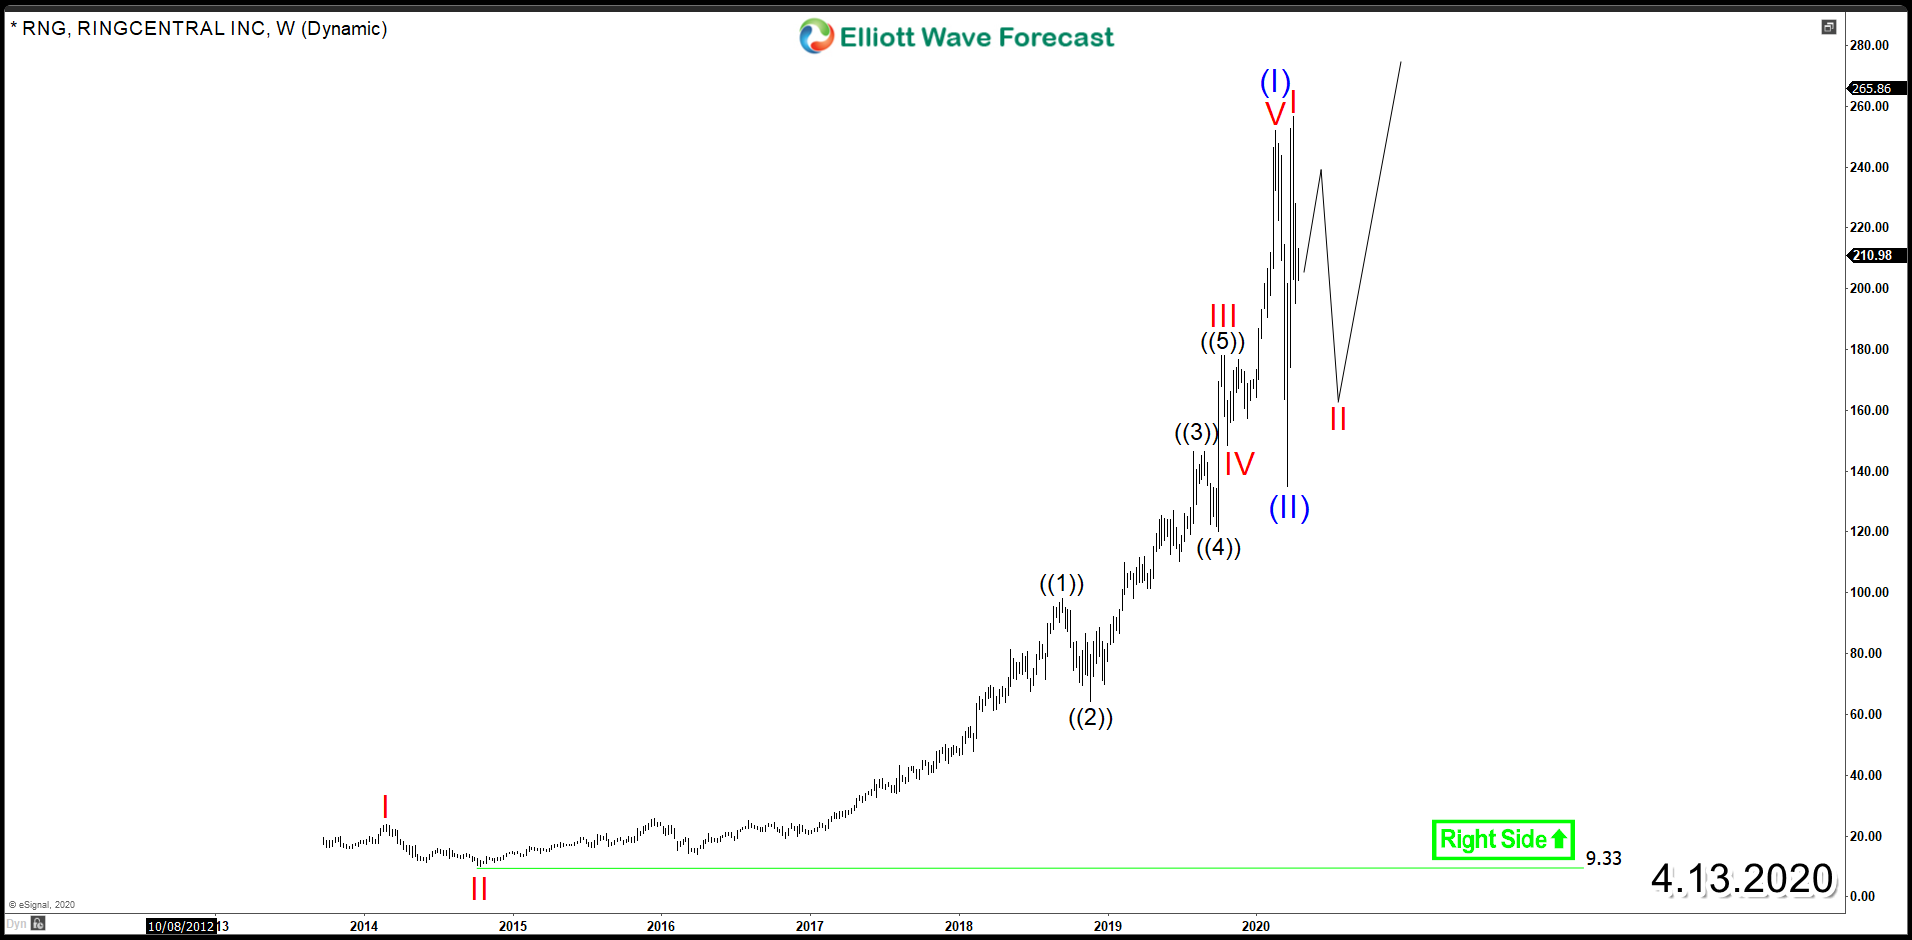
RingCentral Inc (NYSE: RNG) – Bullish Cycle in Play
Read MoreRingCentral Inc (NYSE: RNG) is an American publicly traded provider of cloud-based communications and collaboration solutions for businesses. The company is considered the leader in Unified Communications as a Service in terms of revenue and subscriber seats. Its solutions can be used in multiple devices including Smartphones Tablets PCs and Desk Phones which allow communication across […]
-
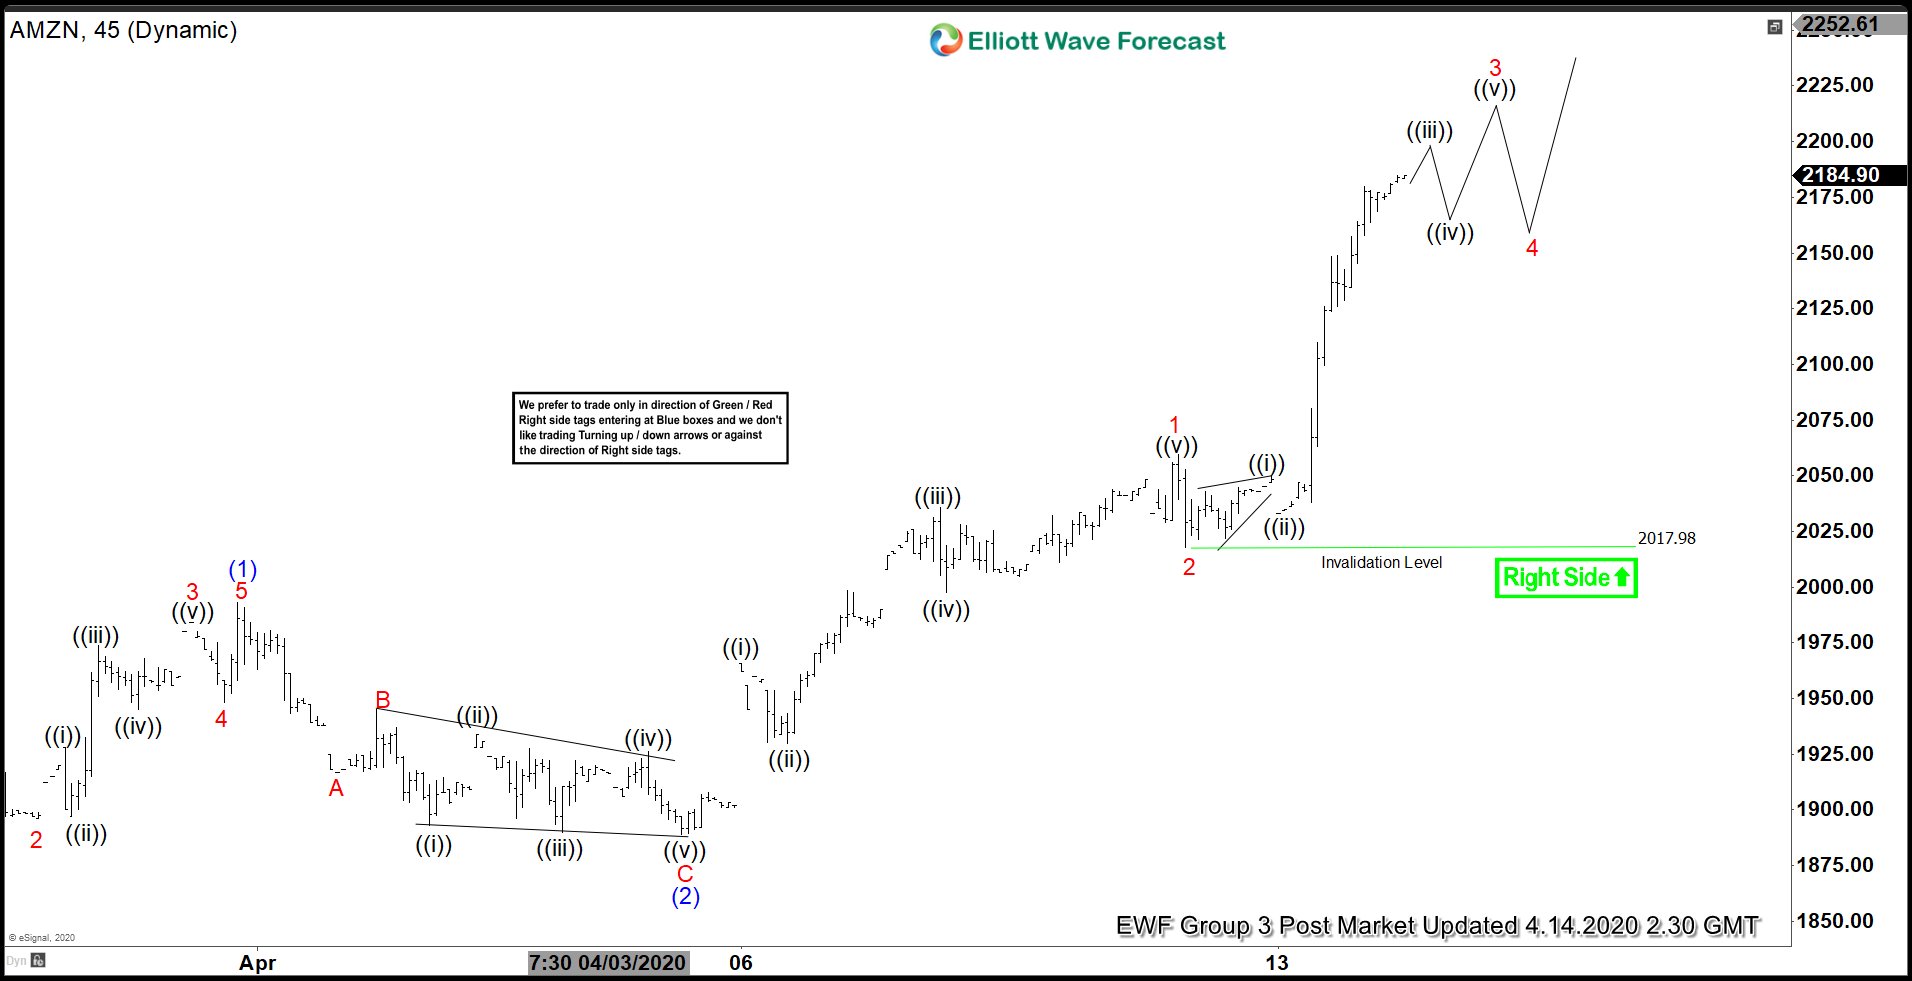
Elliott Wave View: Amazon (AMZN) Aiming for All-Time High
Read MoreAMZN continues to make higher high. While dips stay above April 9 low, expect Amazon to continue higher. This article & video look at the Elliottwave path..
-
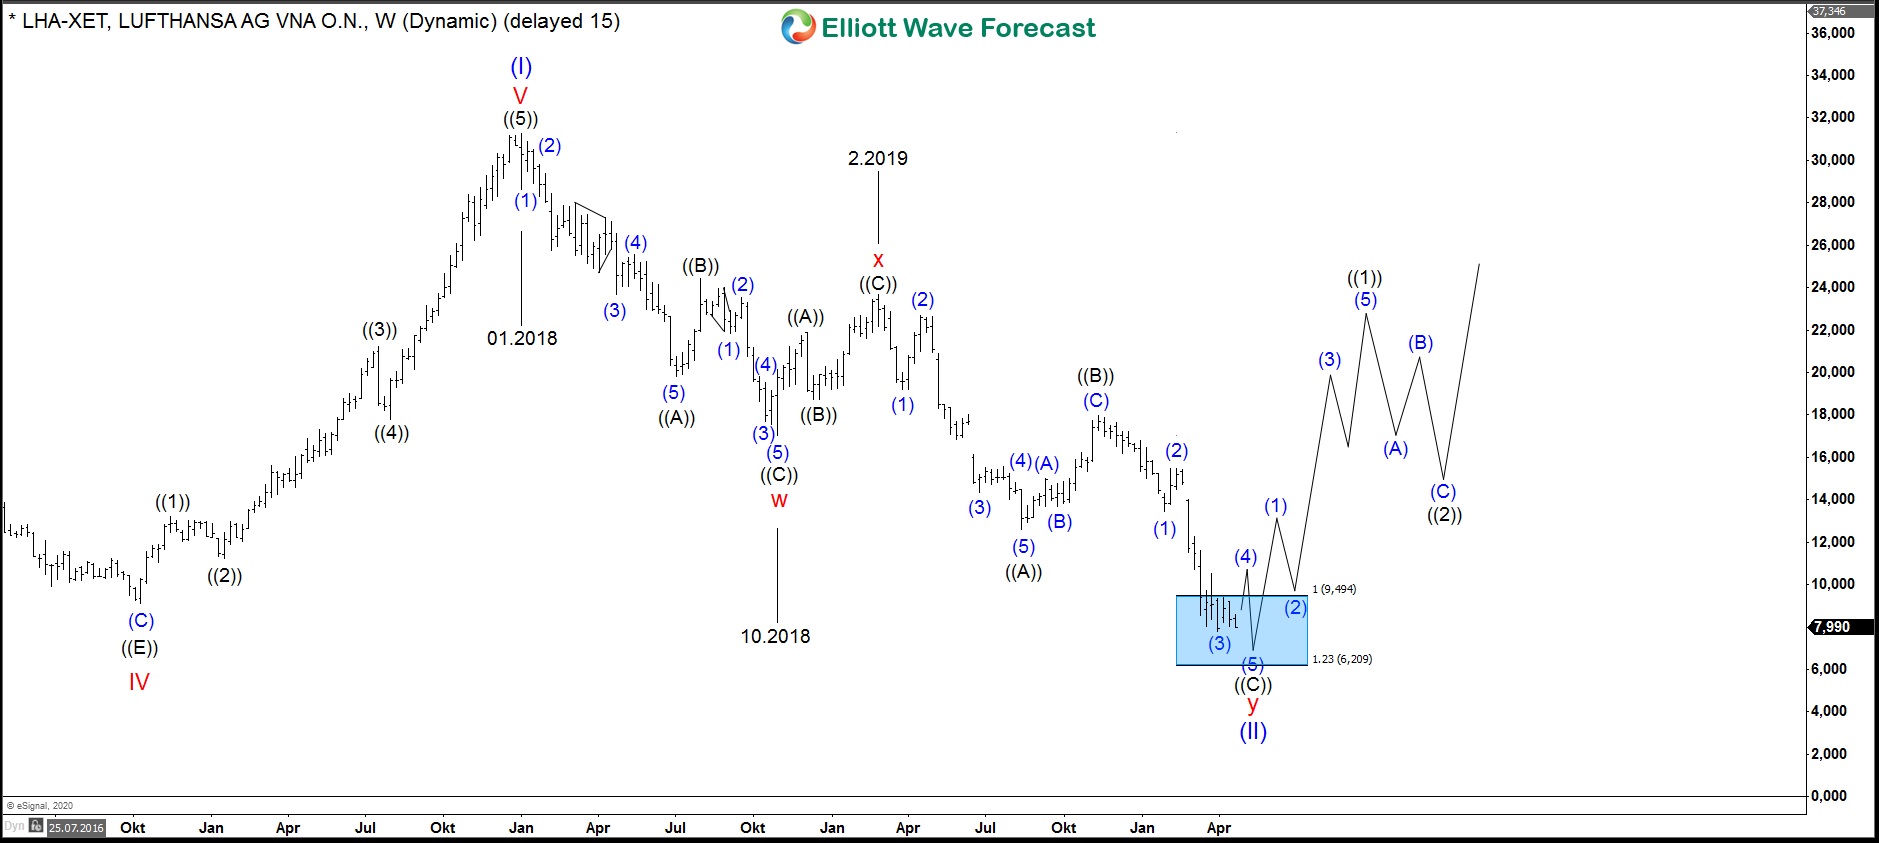
$LHA: Lufthansa stock price is finally pointing to the sky
Read MoreDeutsche Lufthansa AG is the largest German airline which is part of the DAX 30 index. Moreover, the company is the second largest company in Europe in terms of the number of passengers. However, the stock price of Lufthansa has not brought too much financial success for the investors. Indeed, since January 2018, the stock […]
-
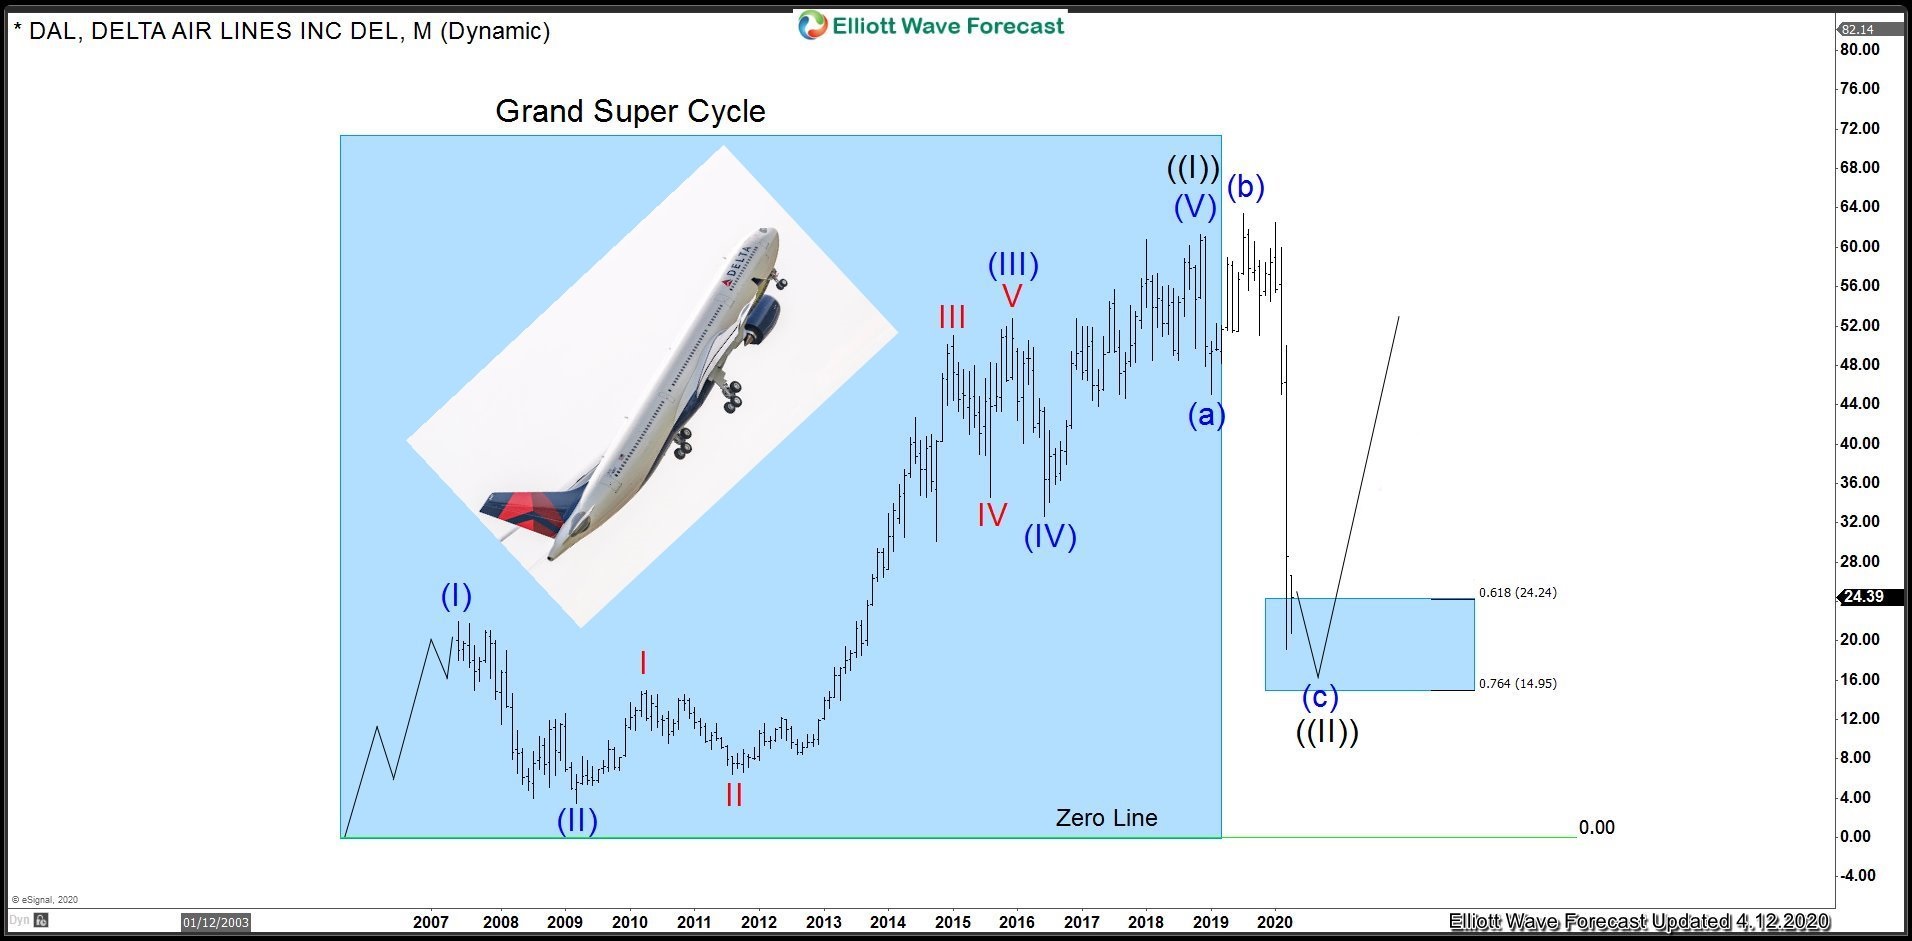
DELTA AIRLINES (DAL) Crash Landed! Is It Ready to Take Off Again?
Read MoreIn this article, we will look at DELTA AIRLINES (DAL) to make sense of the recent huge volatility in the stock market caused by Corona virus pandemic which has now spread to over 200 countries in the World. The financial markets made huge declines but as is often the case, some sectors always get hit […]
-
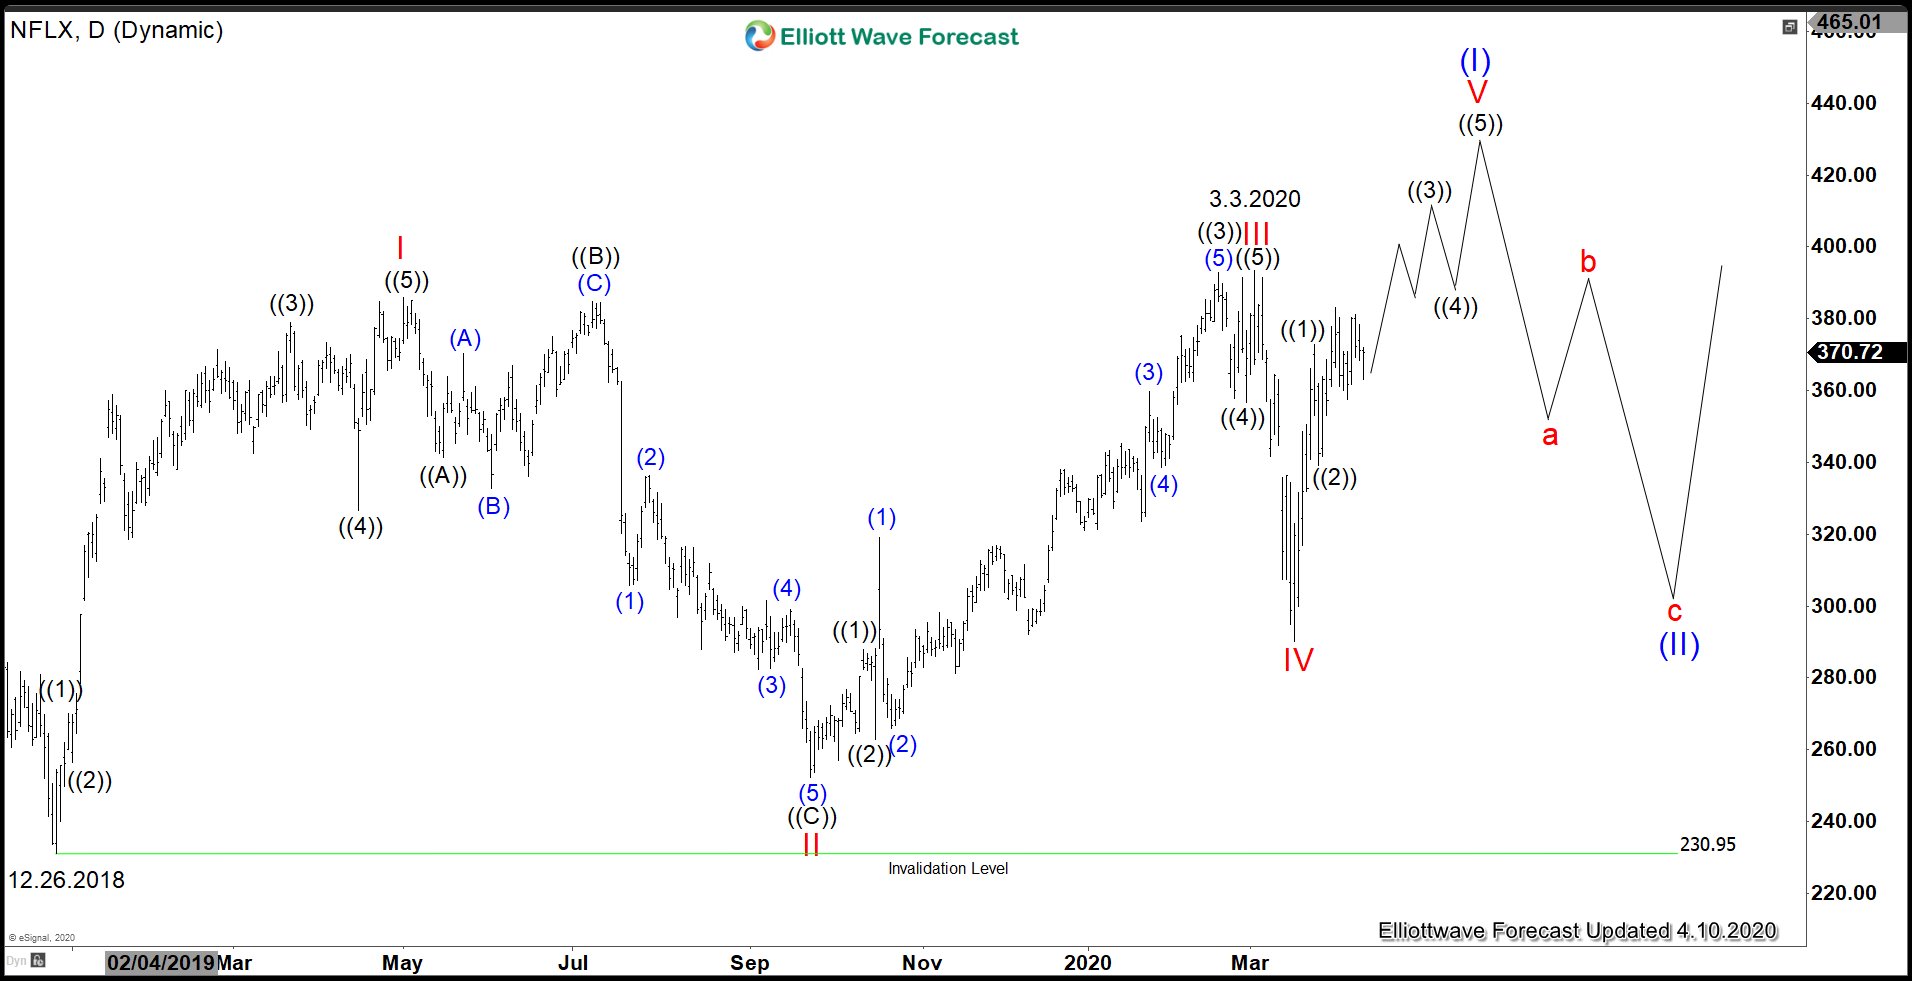
Netflix Sees Uptick Demand As People Spent More Time at Home
Read MoreThe novel corona virus forces government around the world to implement various mitigation measures to flatten the contagion curve. Some of the popular introduce social distancing where people must stay at home as much as possible. Others introduce stricter measures such as lock down in Italy, where residents can only go out of home for […]