

The Power of 3-7-11 and the Grand Super Cycle: How We Saw the Bullish Turn in April 2025 Back on April 9, 2025, while World Indices were dropping sharply and global sentiment had turned overwhelmingly bearish, we published an article that challenged the fear-driven narrative. We explained why selling was not the right approach and […]
-
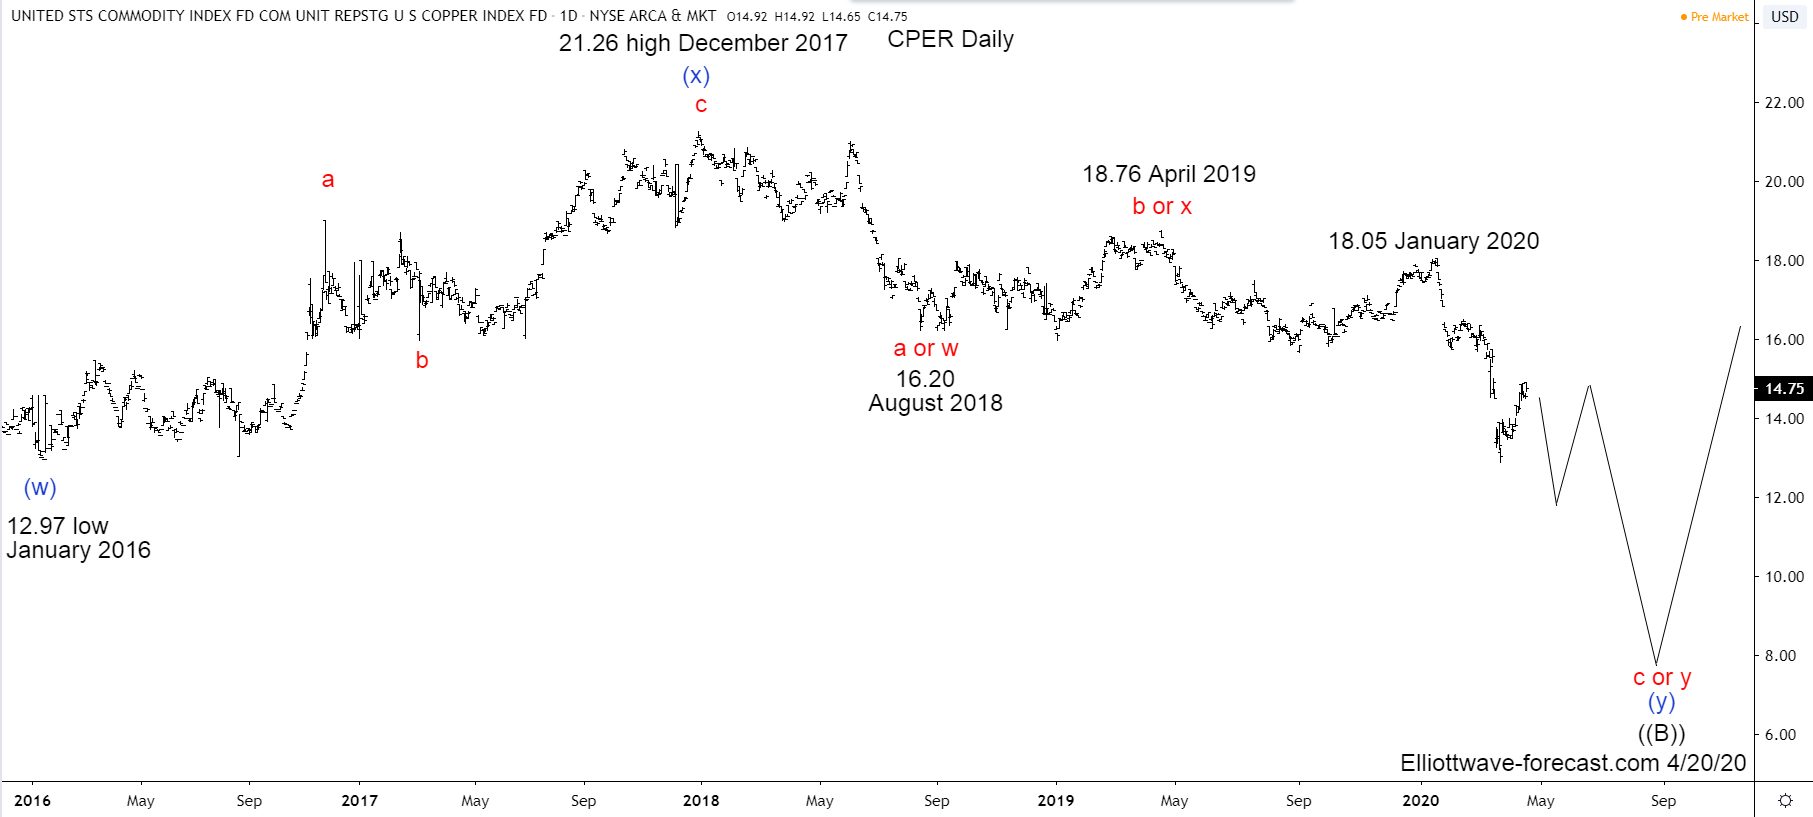
$CPER Copper Index Tracker Elliott Wave & Long Term Cycles
Read More$CPER Copper Index Tracker Elliott Wave & Long Term Cycles Firstly the CPER Copper Index Tracking instrument has an inception date of 11/15/2011. There is data in the HG_F copper futures before this going back many years. That shows copper made an all time high on February 15th, 2011 at 4.649. Translated into this instrument, it […]
-
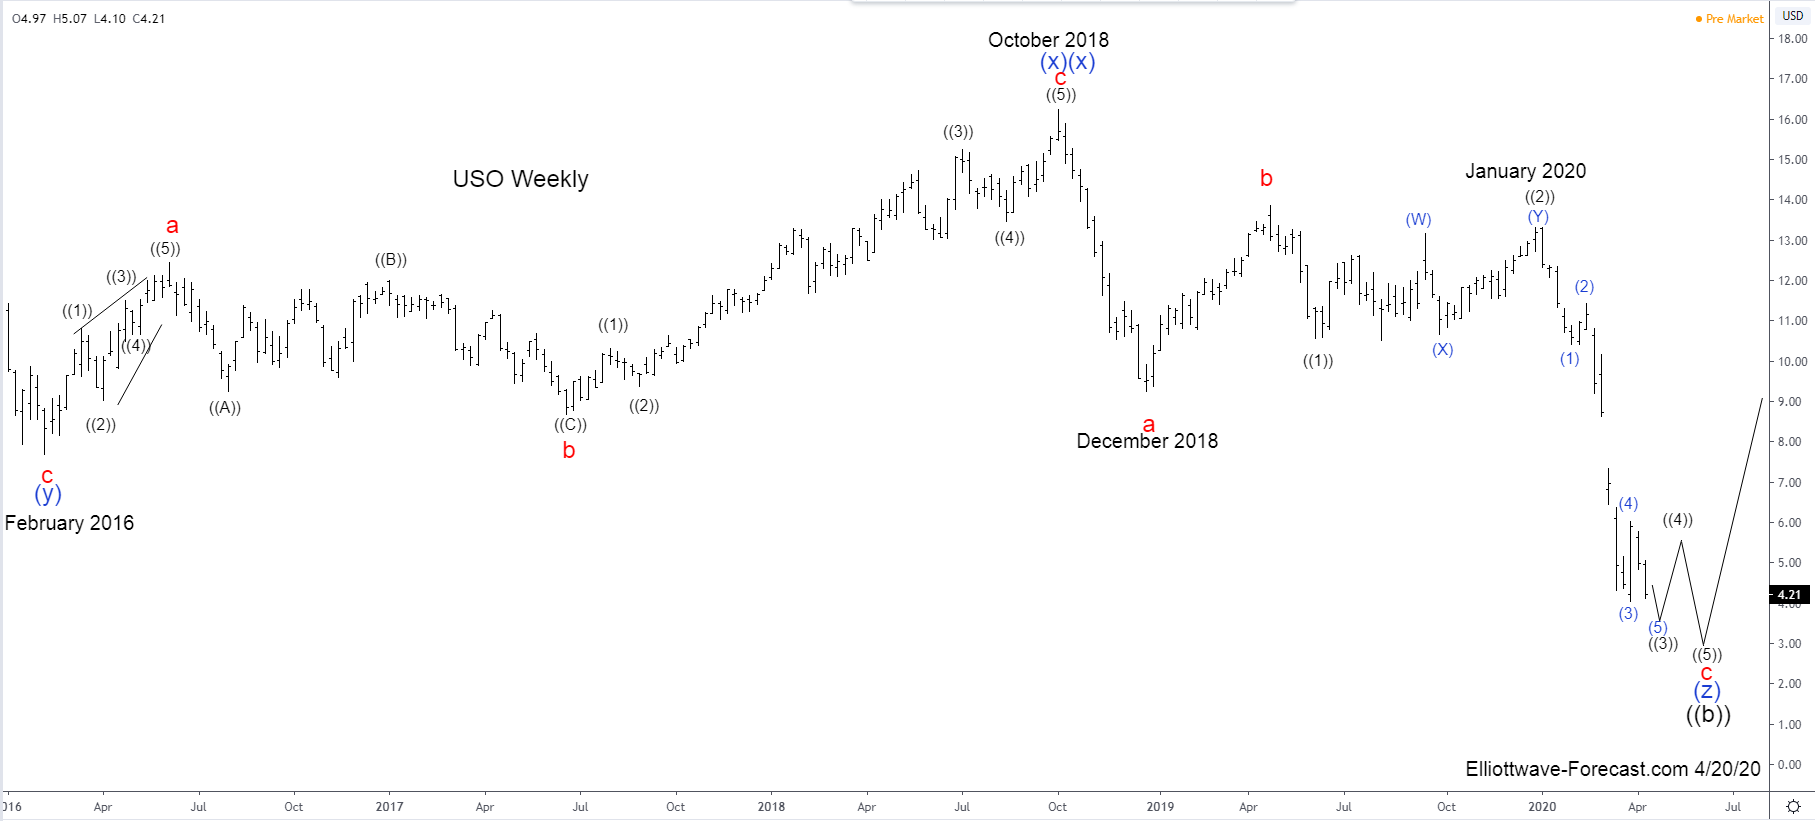
$USO United States Oil Fund Elliott Wave & Longer Term Cycles
Read More$USO United States Oil Fund Elliott Wave & Longer Term Cycles Firstly the USO instrument inception date was 4/10/2006. CL_F Crude Oil put in an all time high at 147.27 in July 2008. USO put in an all time high at 119.17 in July 2008 noted on the monthly chart. The decline from there into the […]
-
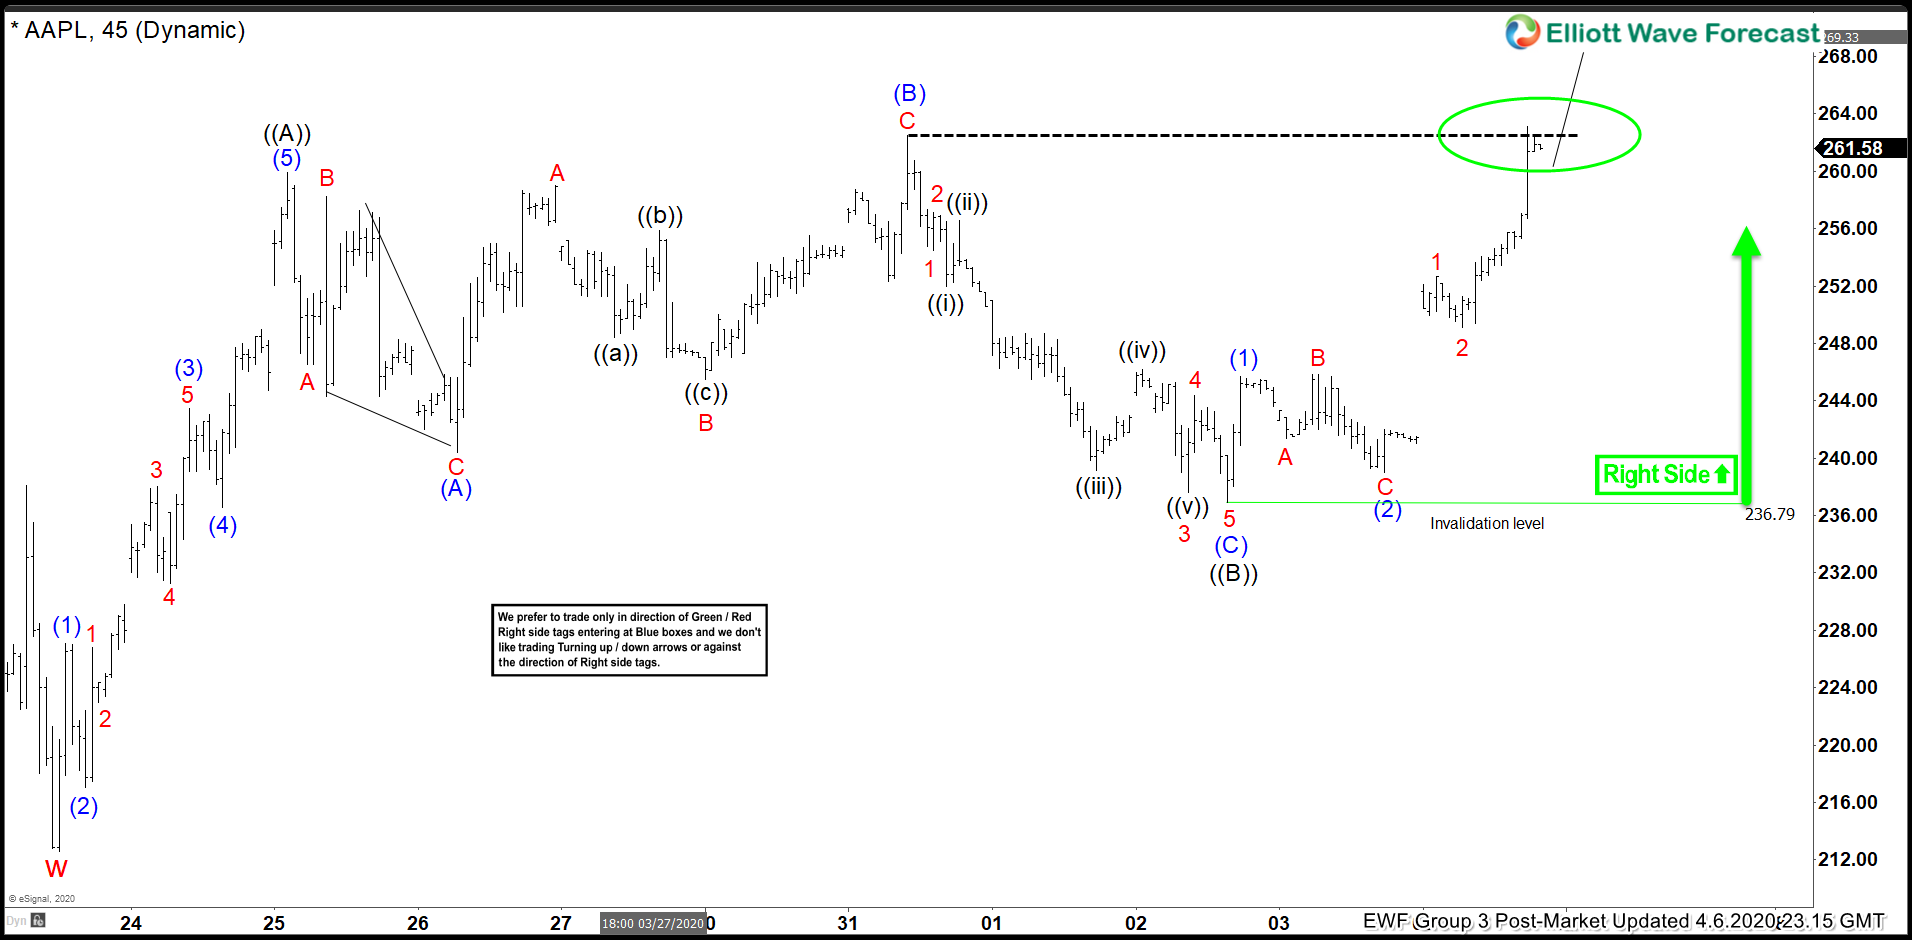
Apple ( $AAPL) Elliott Wave: Forecasting The Path
Read MoreHello fellow traders. In this technical blog we’re going to take a quick look at the Elliott Wave charts of Apple stock, published in members area of the website. As our members know, Apple has been showing incomplete Higher- High Sequences in the cycle from the March 23rd low, calling for further rally. Consequently we […]
-
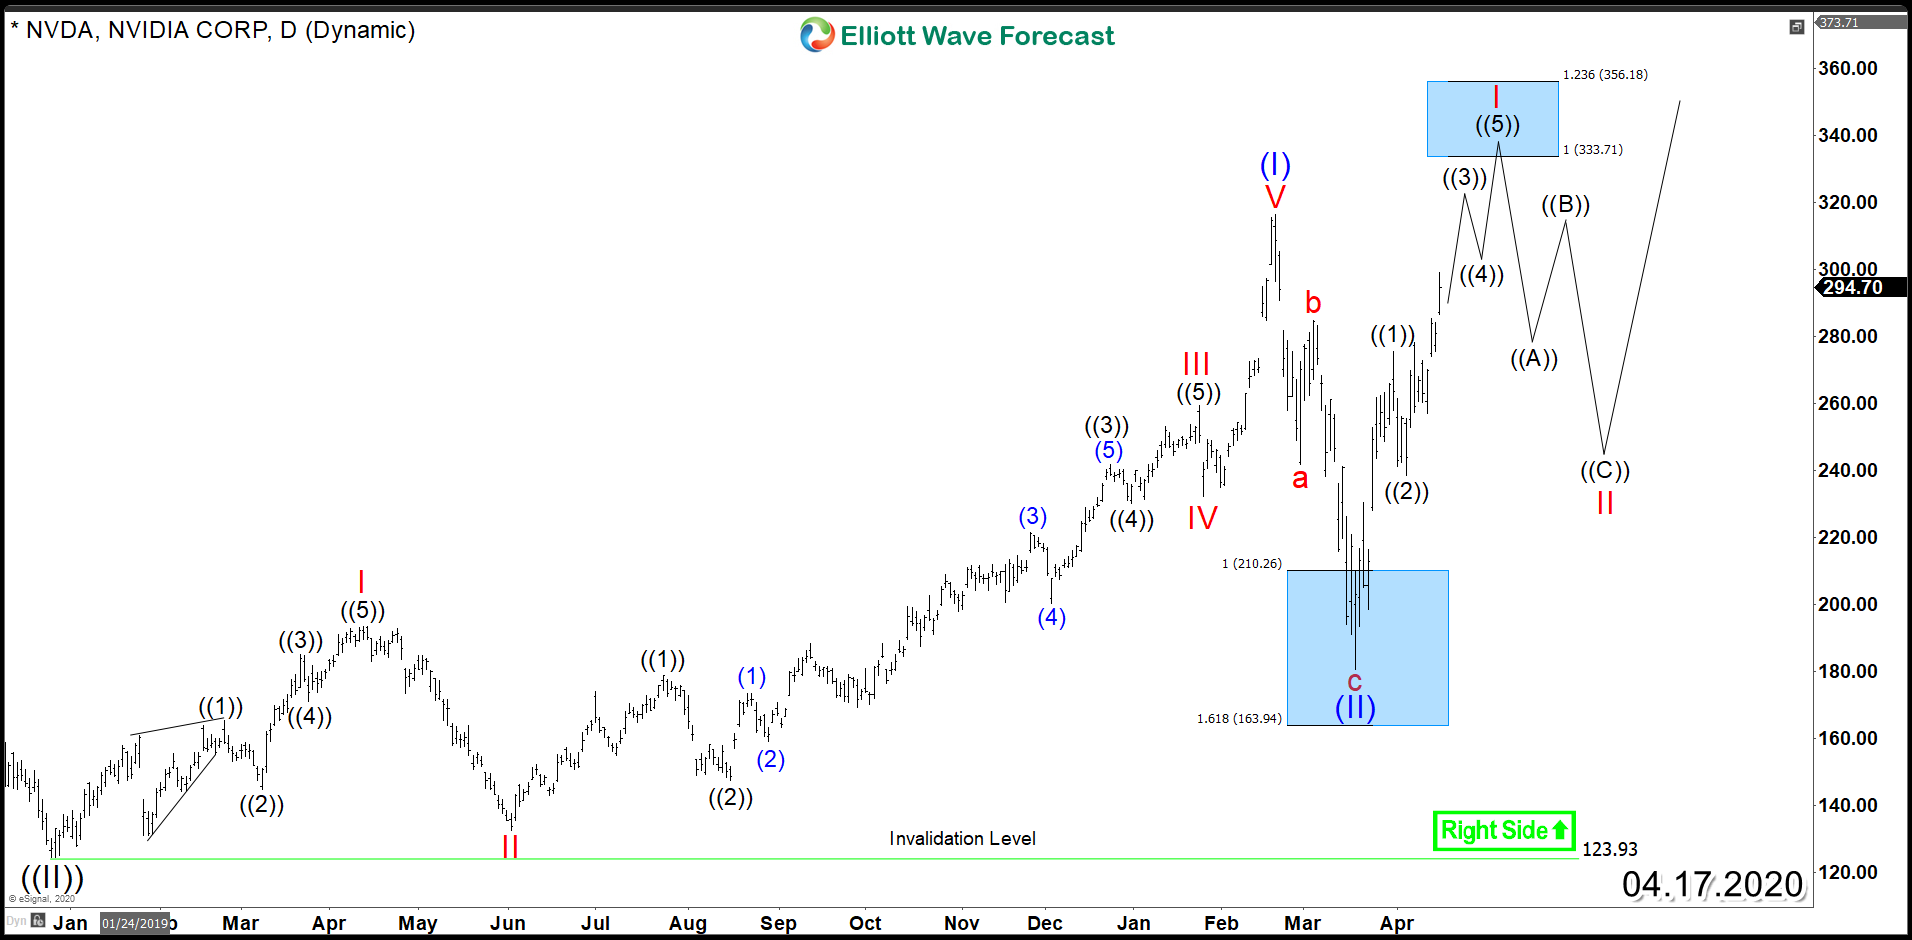
Nvidia (NASDAQ: NVDA) Aiming for All-Time High
Read MoreNvidia (NASDAQ: NVDA) is up 25% Year-To-Date outperforming the Semiconductor Sector which is currently down 9%. Despite, the sell off that took place last month around the entire stock market, NVDA along few other stocks managed to sustain its main bullish trend because it was trading within a powerful wave ((III)) as mentioned in our previous […]
-
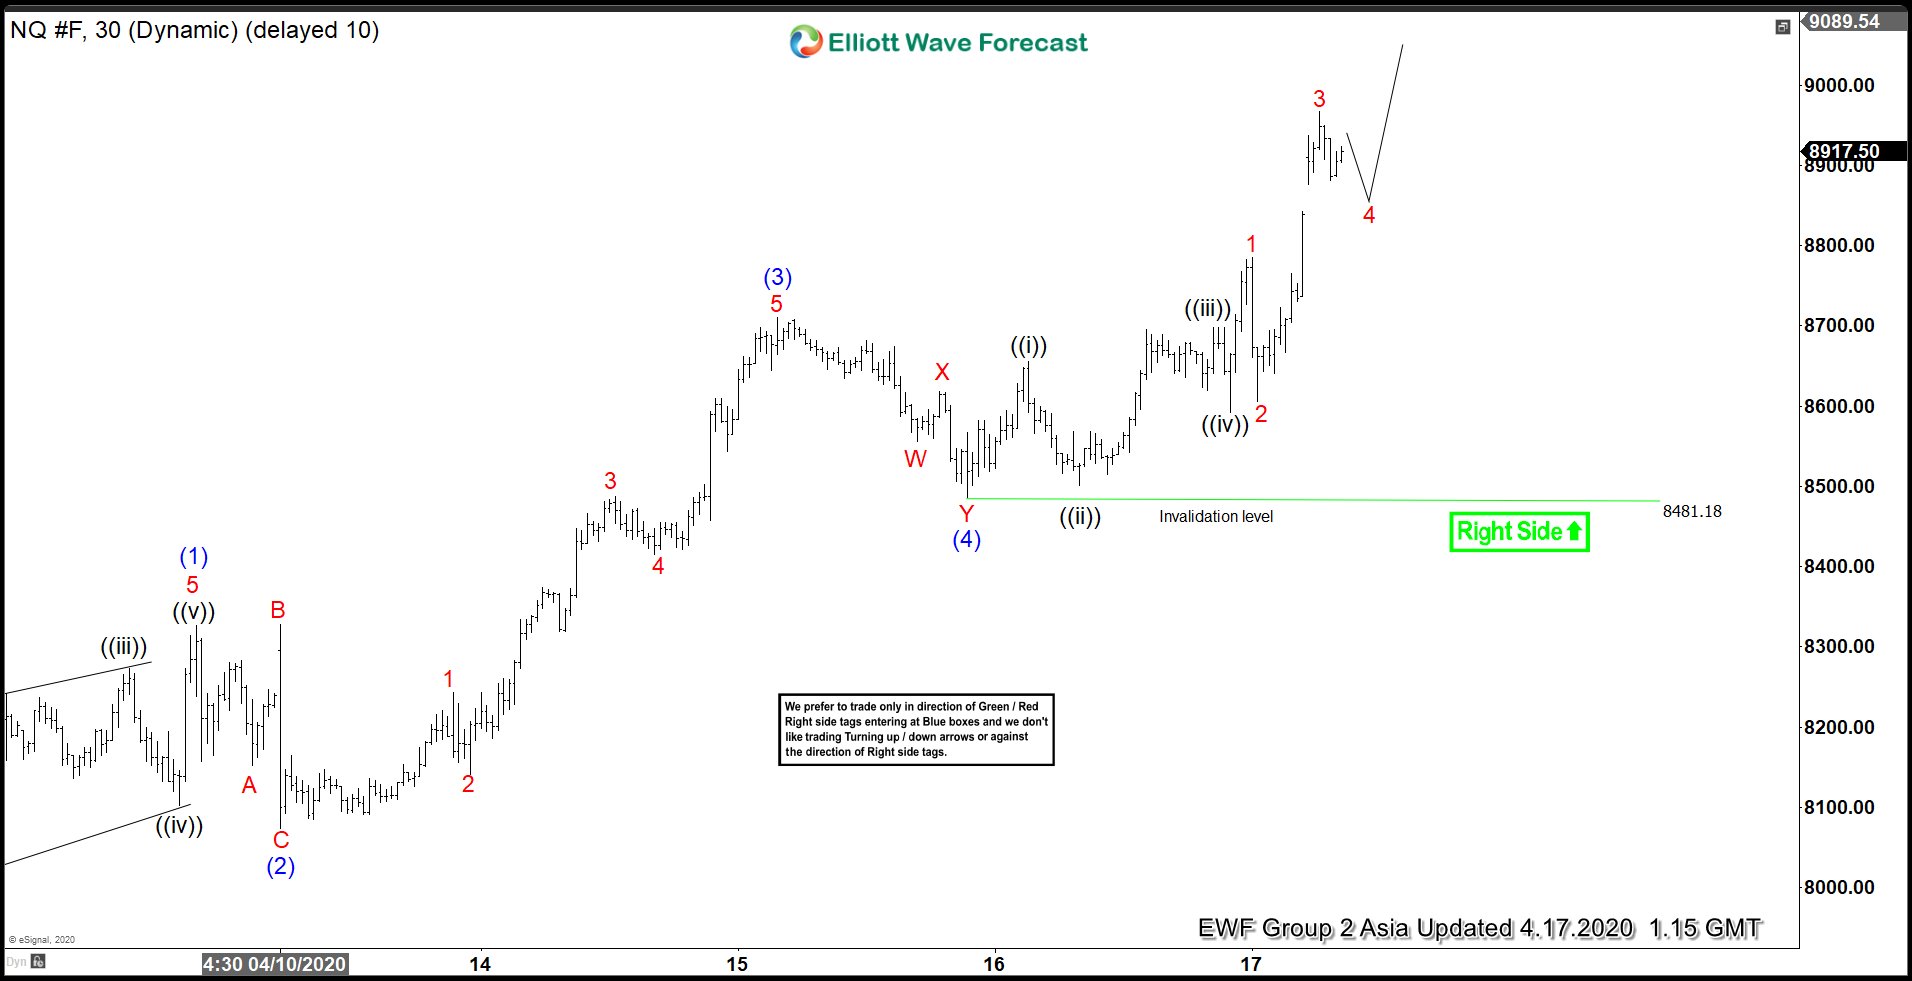
Elliott Wave View: Impulsive Rally in Nasdaq Favors Upside
Read MoreRally in Nasdaq from April 8, 2020 low appears impulsive, favoring more upside. This article and video looks at the Elliott Wave path.
-
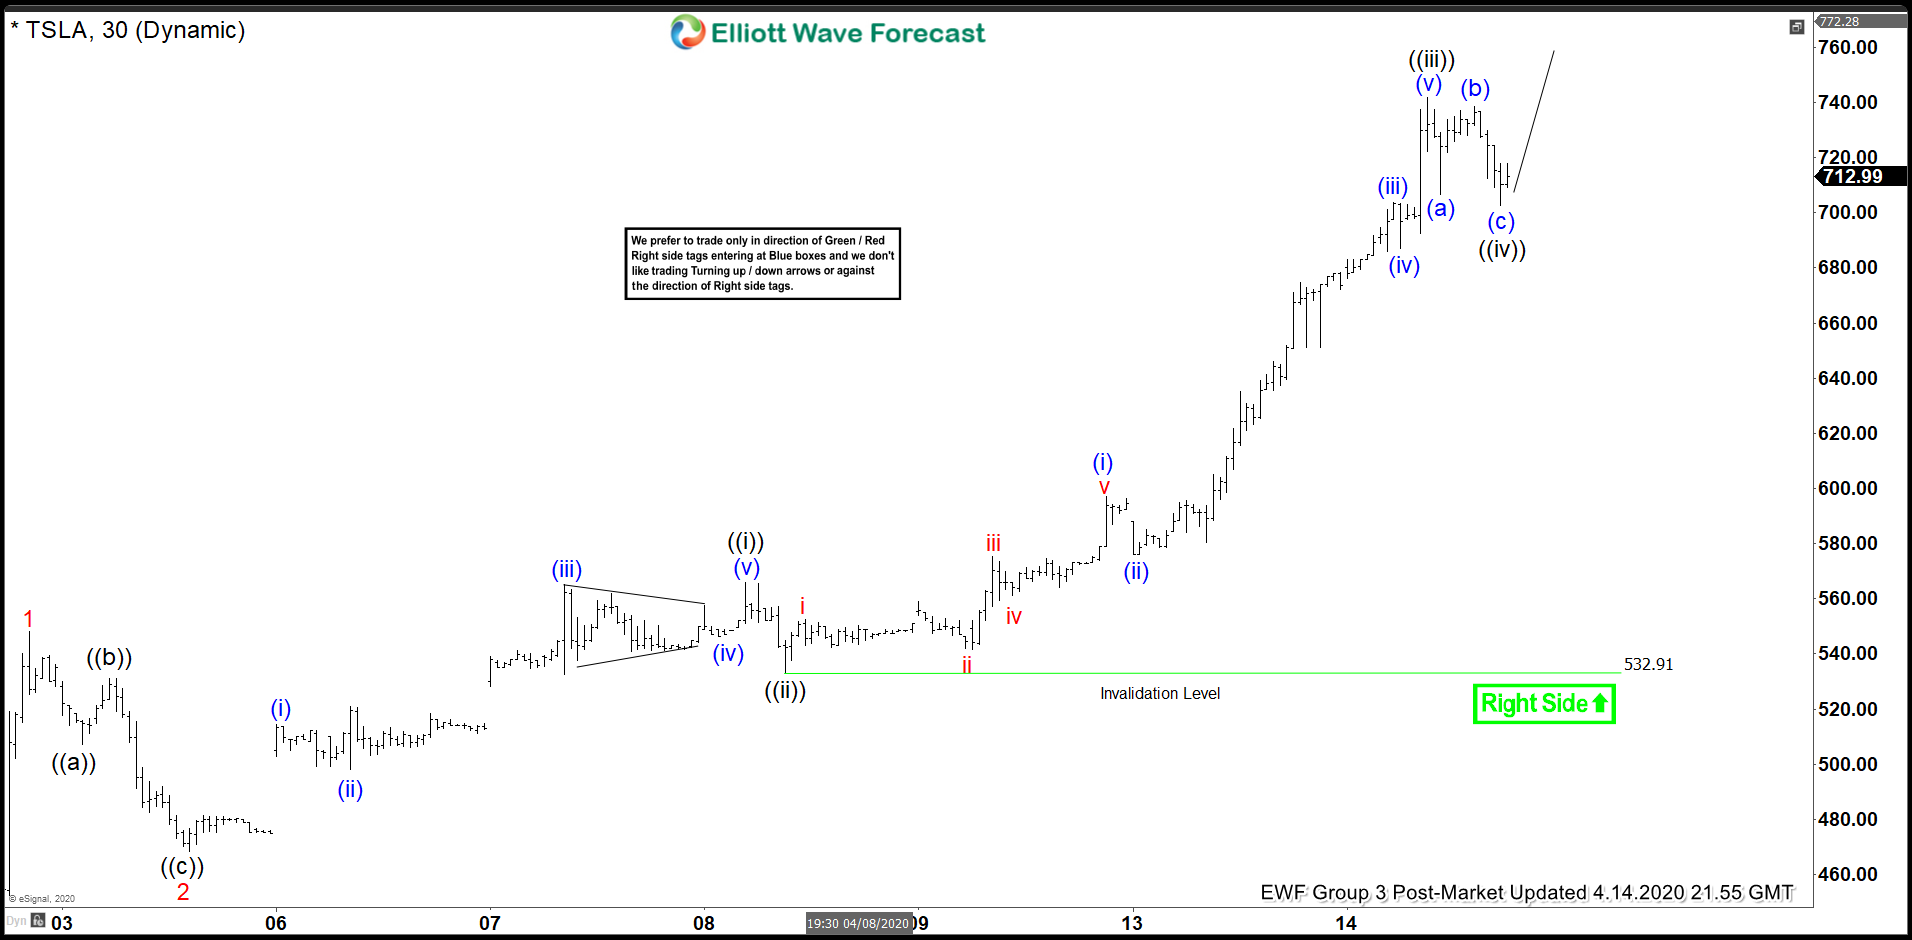
Elliott Wave View: Tesla Impulsive Rally
Read MoreTesla rally from 3.19 low is unfolding as an impulse and the stock can see more upside. This video looks at the Elliott Wave path.