

The Power of 3-7-11 and the Grand Super Cycle: How We Saw the Bullish Turn in April 2025 Back on April 9, 2025, while World Indices were dropping sharply and global sentiment had turned overwhelmingly bearish, we published an article that challenged the fear-driven narrative. We explained why selling was not the right approach and […]
-
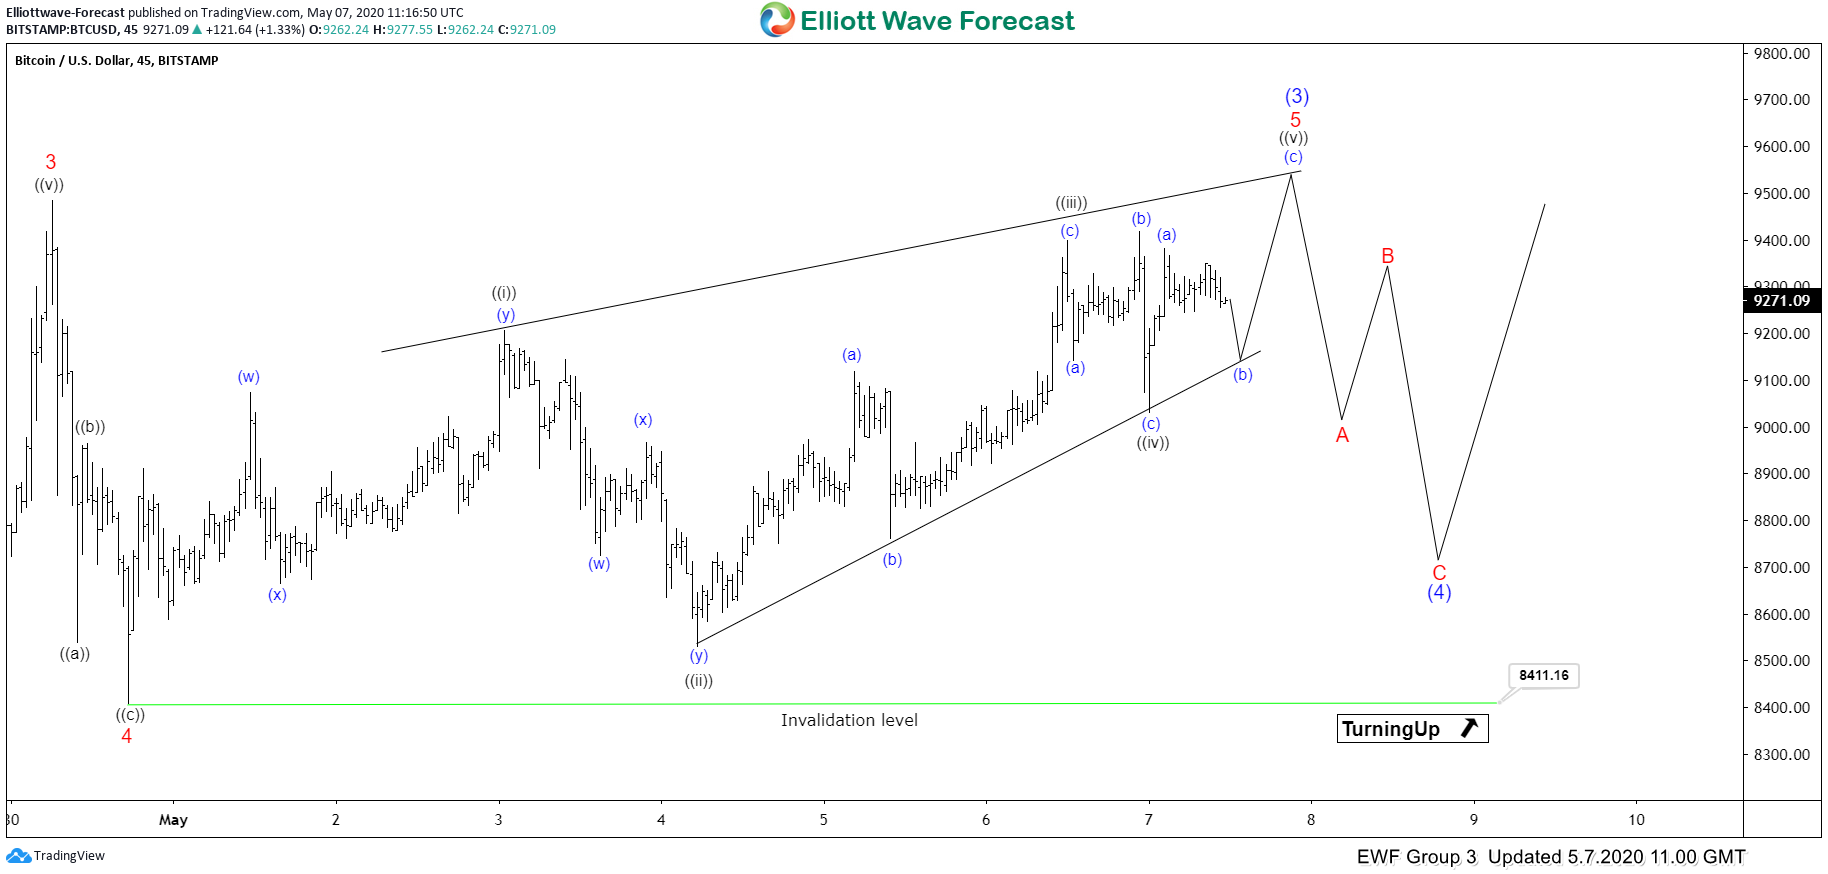
Elliott Wave View: Bitcoin Ending Diagonal in Progress
Read MoreBitcoin is finishing wave 5 as an Ending Diagonal. Short term, cycle is mature and pullback can happen soon. This video looks at the Elliott Wave path.
-
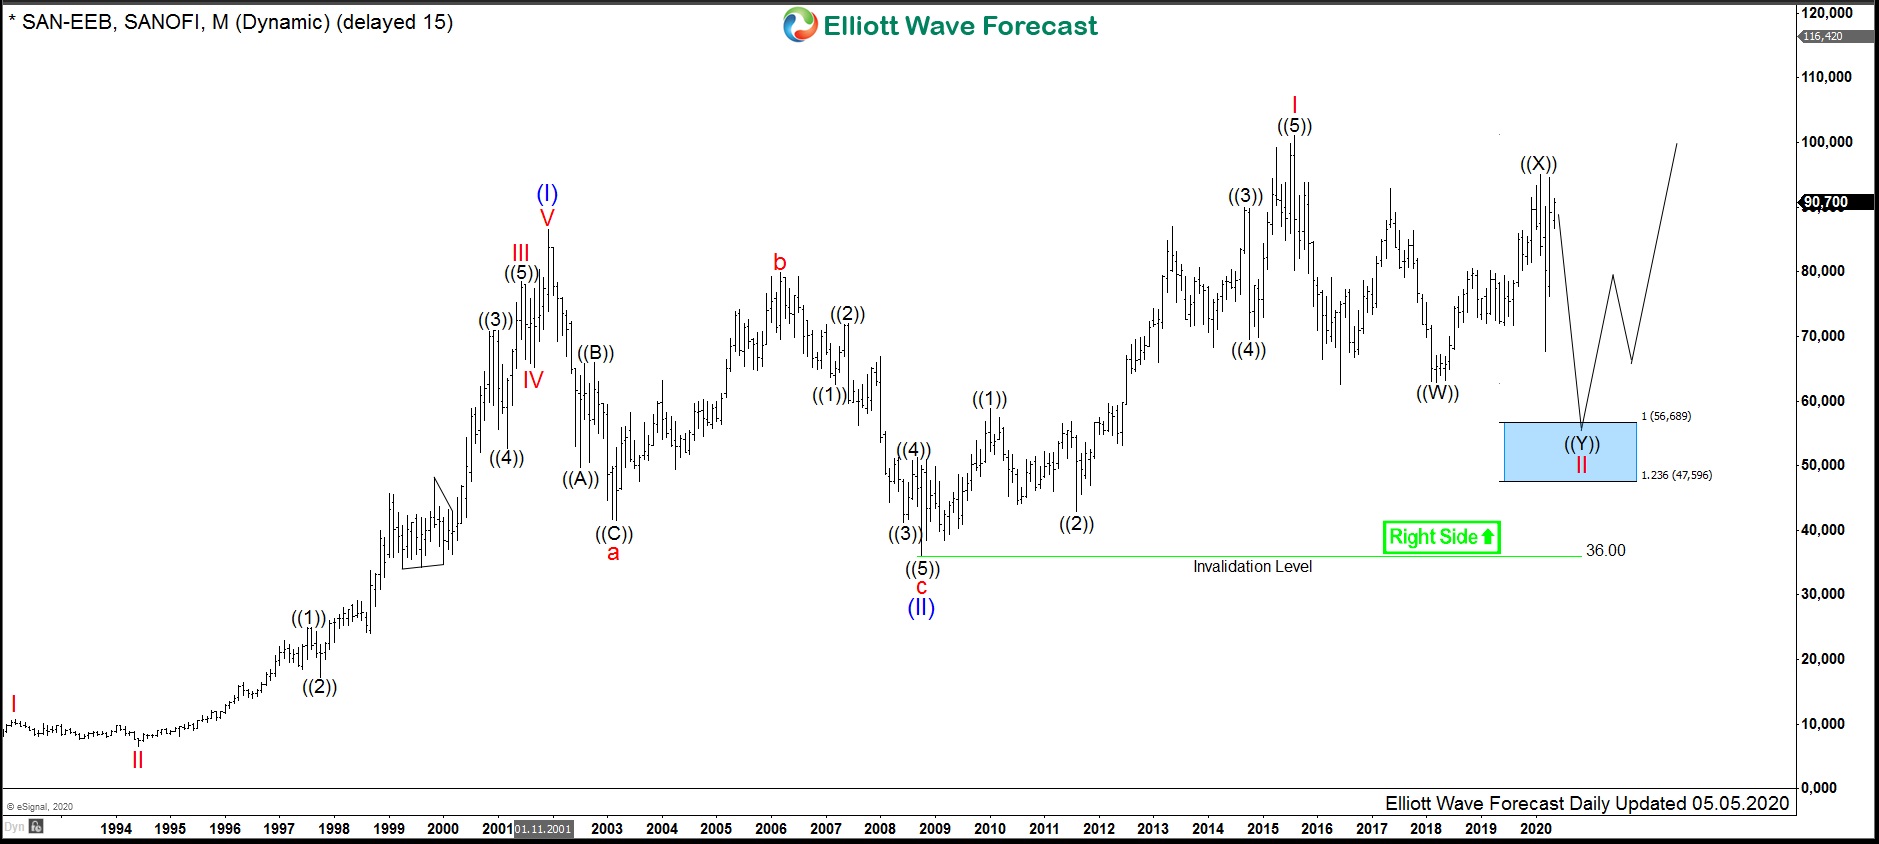
$SAN : Sanofi Shows Monthly Bullish Structure
Read MoreSanofi S.A. is a French multinational pharmaceutical company being within 10 largest pharmaceutical companies in the world. Headquartered in Paris, it is a merger of Aventis and Sanofi-Synthélabo. Sanofi is a part of Euro Stoxx 50 (SX5E) and CAC40 indices. Investors can trade it under the ticker $SAN at Euronext Paris and also under $SNY at […]
-
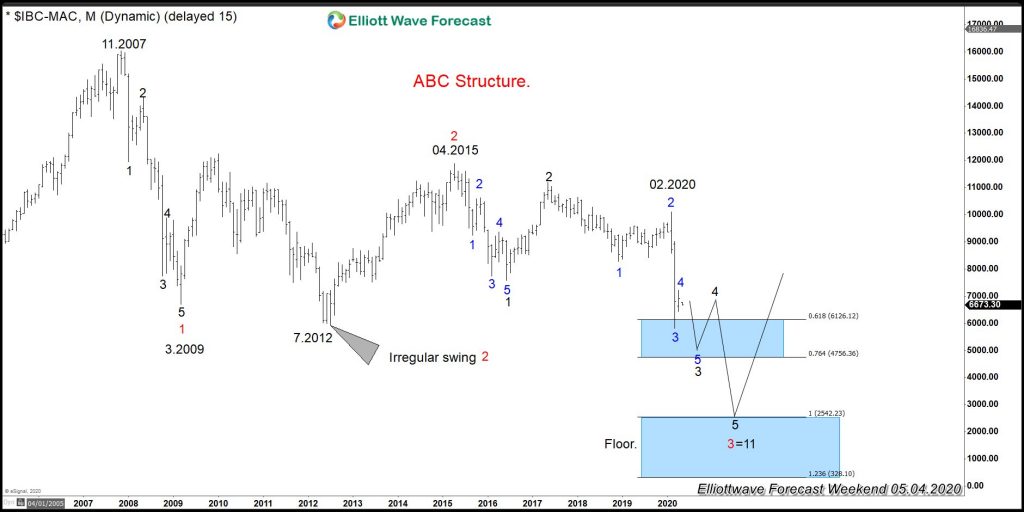
IBEX 35 Shows Why World Indices Might Not Be Ready to Rally
Read MoreIBEX 35 is the benchmark Stock Market Index of the Bolsa de Madrid, Spain’s principal stock exchange. Initiated in 1992, the index is administered and calculated by Sociedad de Bolsas, a subsidiary of Bolsas y Mercado Espanoles (BME). BME is the company which runs Spain’s securities markets (including the Bolsa de Madrid). It is a market […]
-
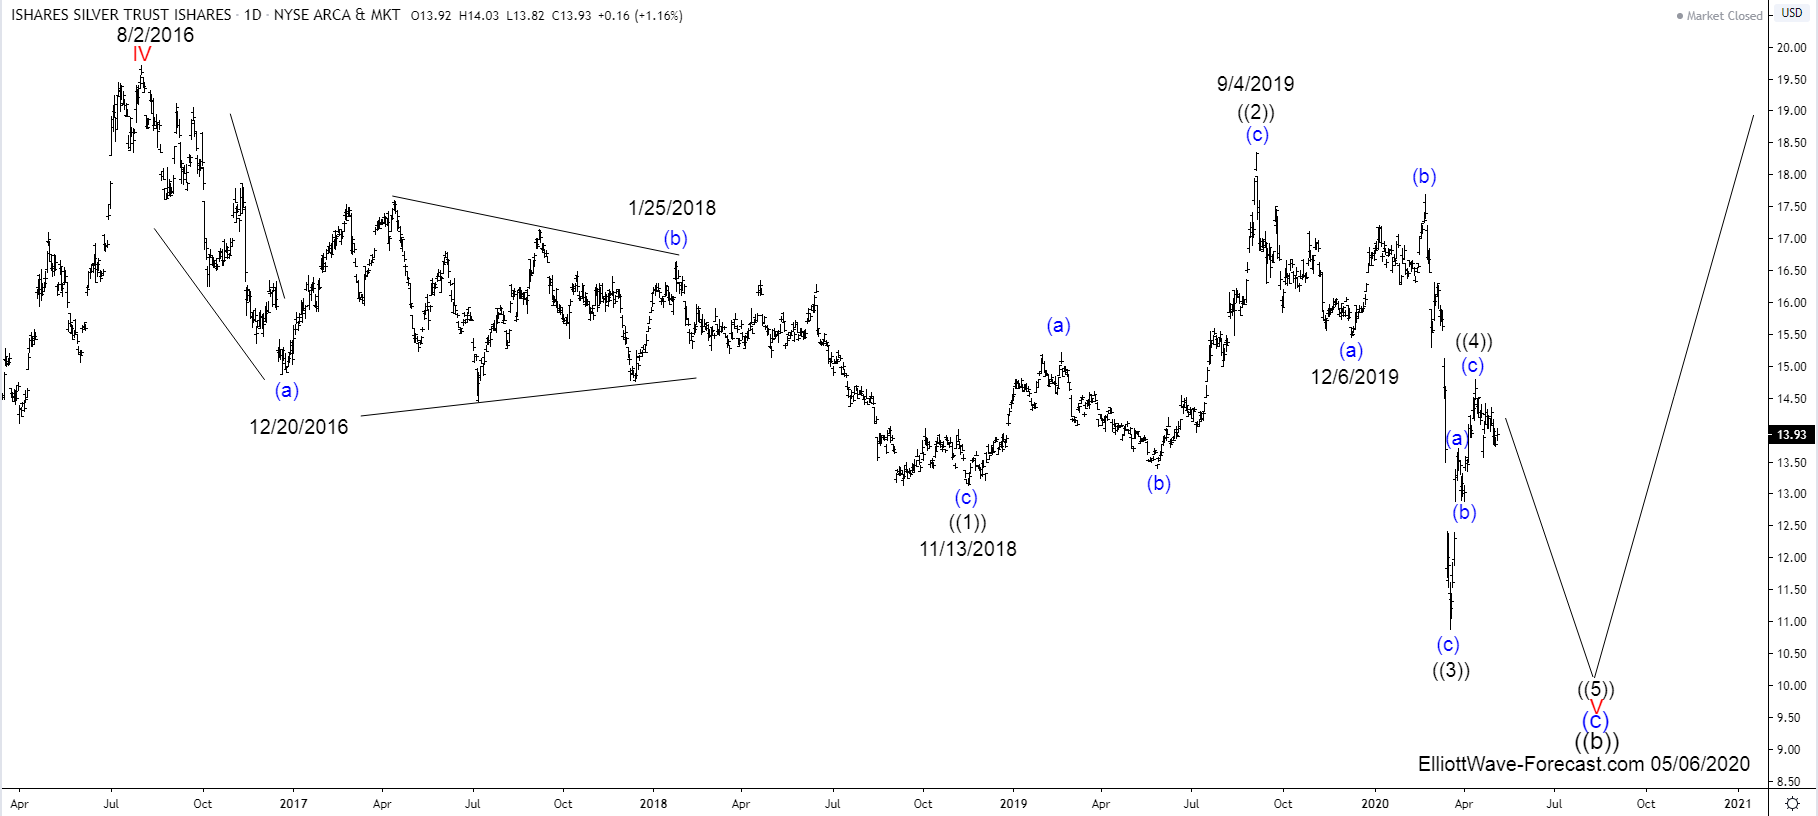
$SLV Ishares Silver Trust Elliott Wave and Larger Cycles
Read More$SLV Ishares Silver Trust Elliott Wave and Larger Cycles Firstly there is data back to when the ETF fund began in 2006 as seen on the weekly chart shown below. The fund made a low in 2008 at 8.45 that has not since been taken out in price. However it can be in this current pullback […]
-
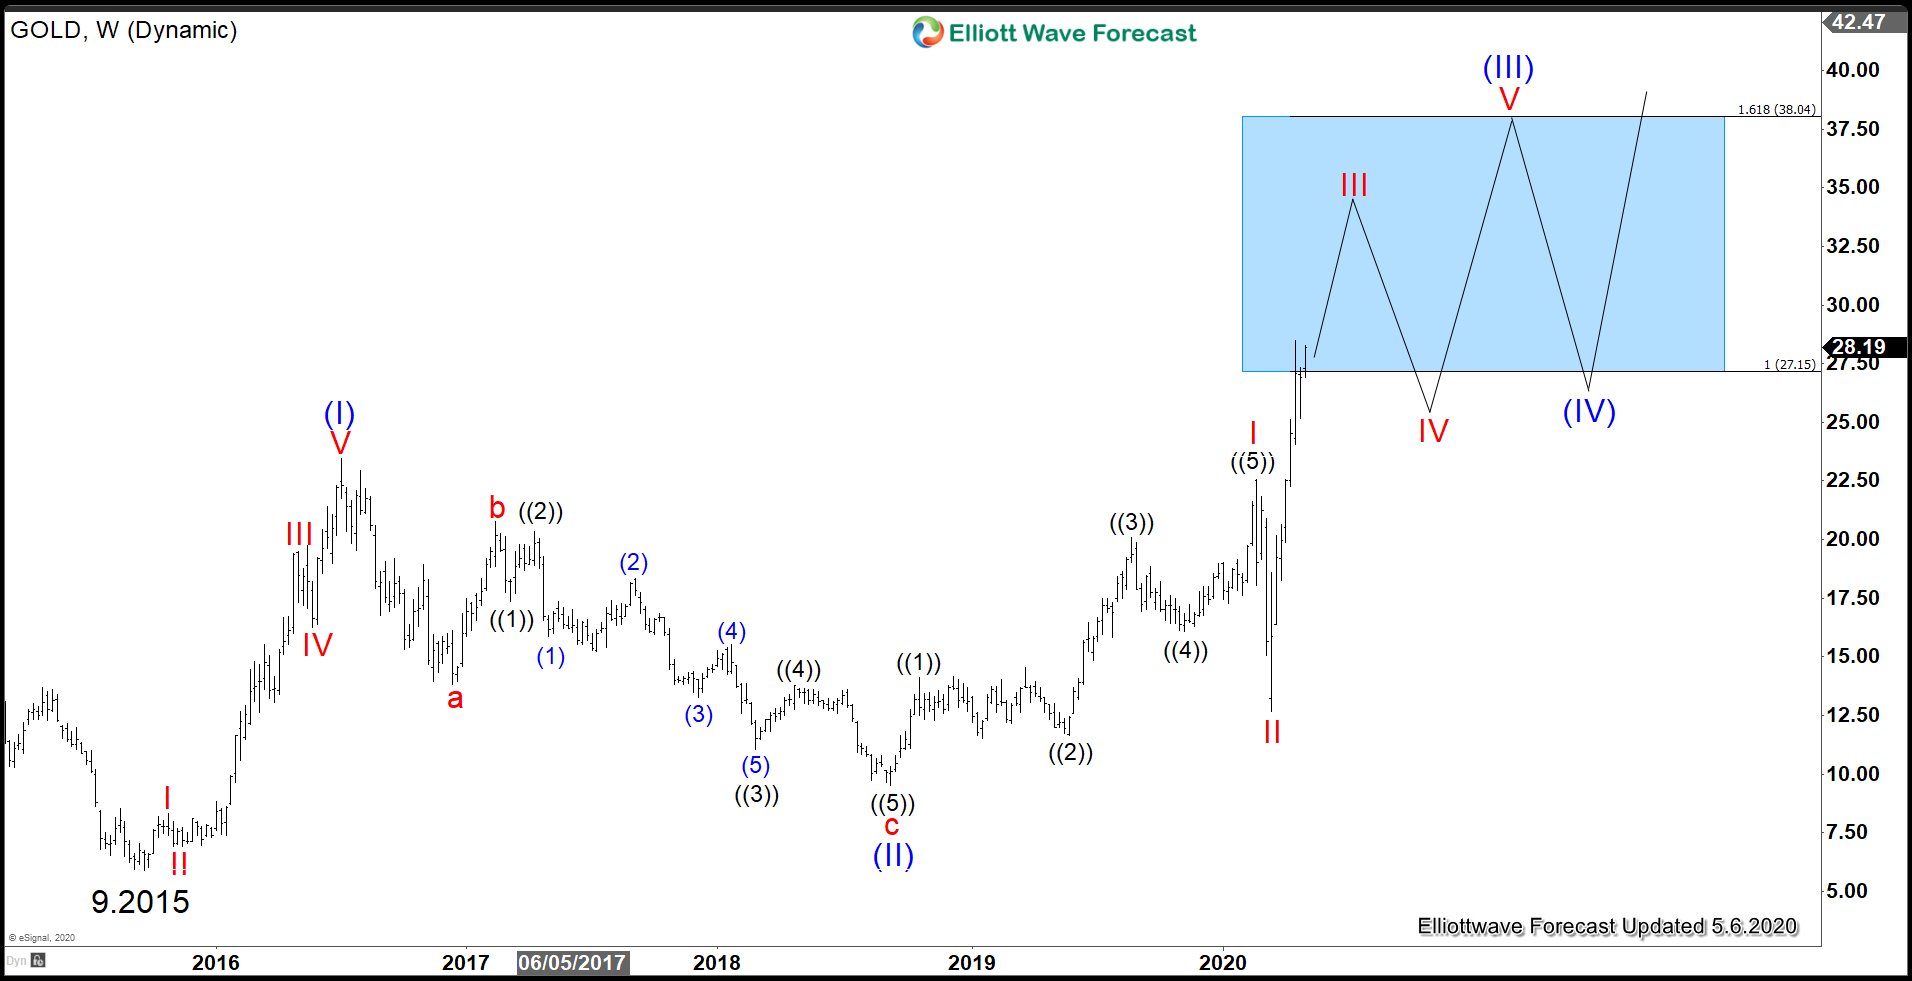
Barrick Gold Corporation (NYSE: GOLD): Strong Impulse Rally In Progress
Read MoreBarrick Gold Corporation (NYSE: GOLD) is the second-largest gold mining company in the world. Year-to-Date, the stock is up around 45%. The combination of low Oil’s price (major cost component for miners) and high price in gold creates a favorable environment for the company. On Wednesday, the company will report its first-quarter results. The consensus for the […]
-
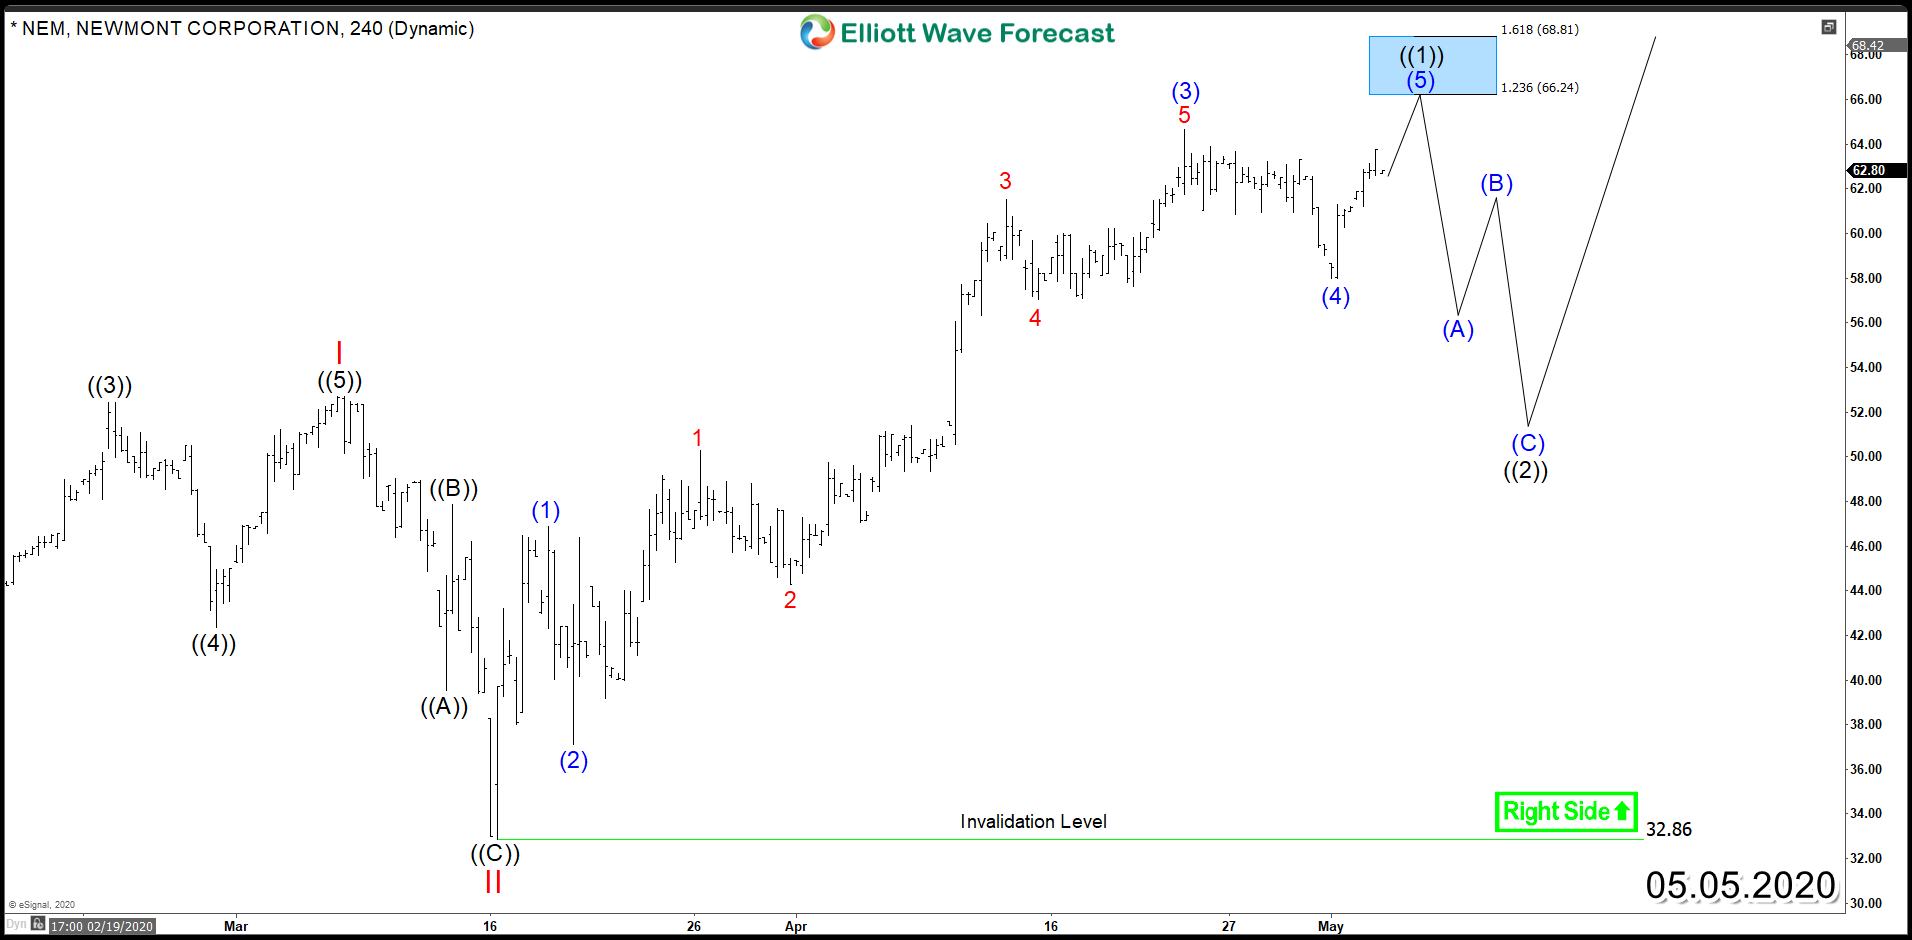
Newmont Corporation (NYSE: NEM) – Impulsive Bullish Structure
Read MoreNewmont Corporation (NYSE: NEM) is the world’s largest Gold mining company. Since the major low in the precious metal back in 2015 around $1050, many mining stocks rallied significantly and managed to outperform shining metals. If we take a look at this year’s data, NEM is currently up 45% while GOLD is 11% which gives an […]