

The Power of 3-7-11 and the Grand Super Cycle: How We Saw the Bullish Turn in April 2025 Back on April 9, 2025, while World Indices were dropping sharply and global sentiment had turned overwhelmingly bearish, we published an article that challenged the fear-driven narrative. We explained why selling was not the right approach and […]
-
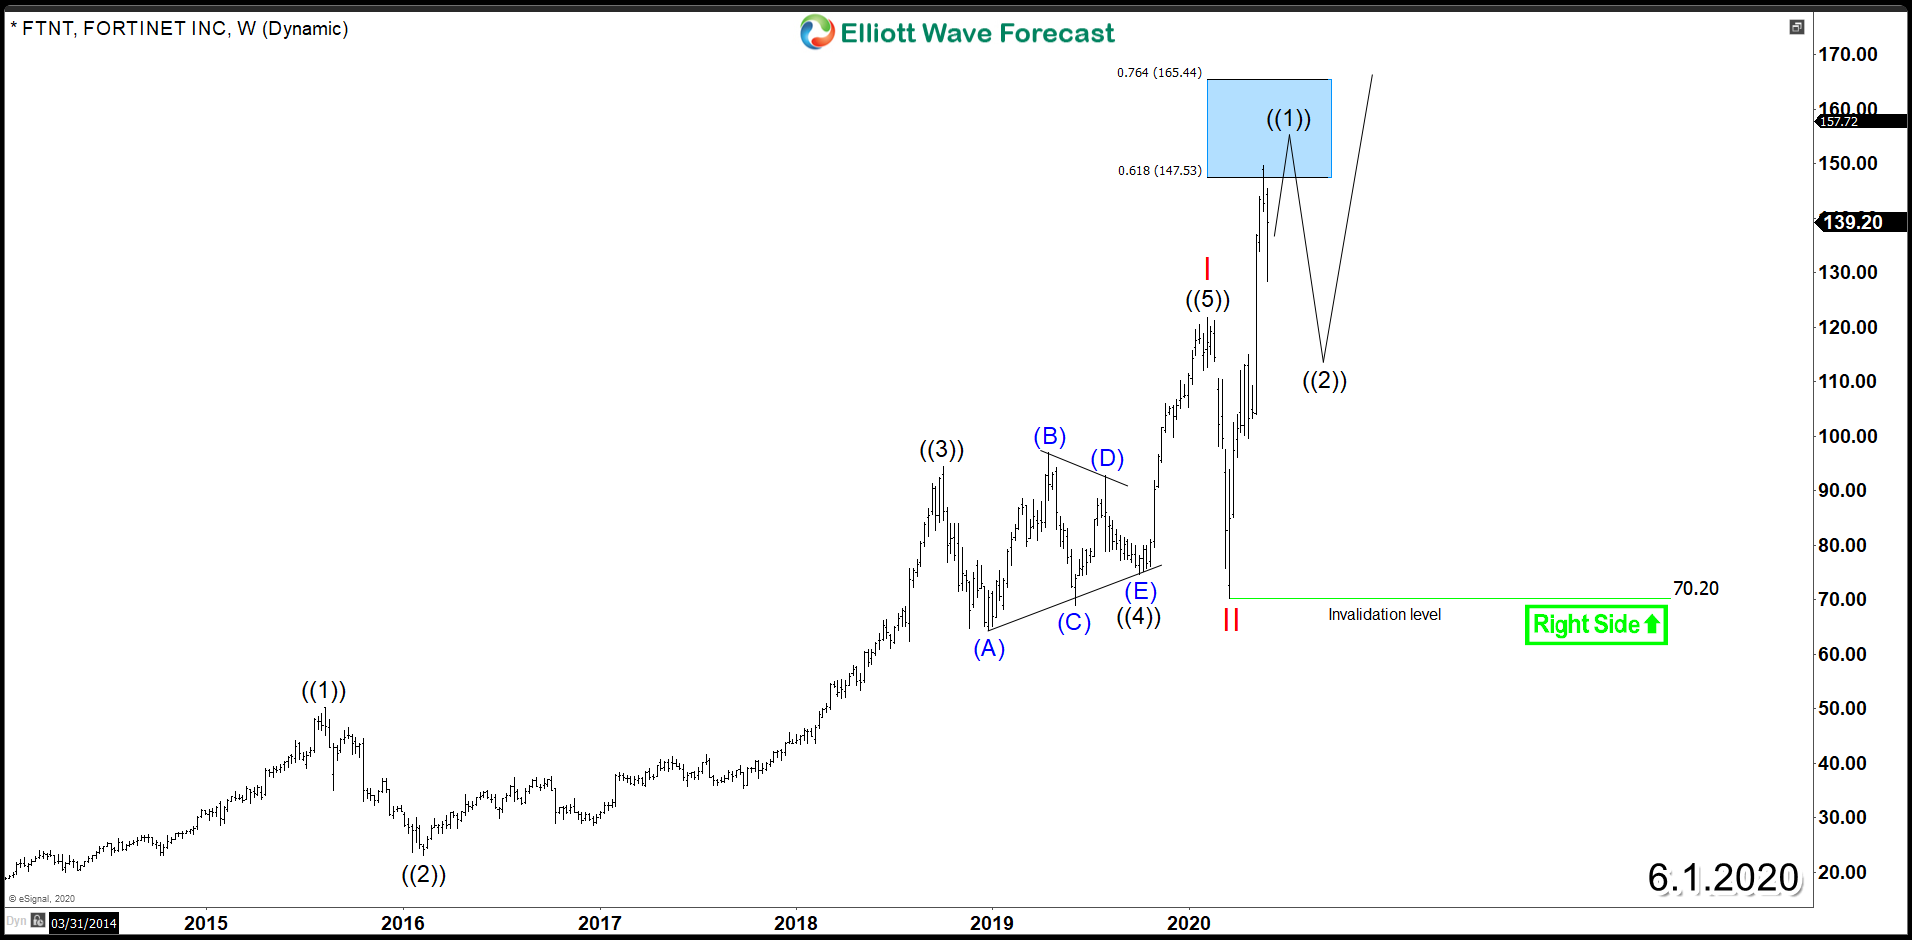
Fortinet Inc (NASDAQ: FTNT) Bullish Sequence Supporting the Stock
Read MoreFortinet Inc (NASDAQ: FTNT) ended it’s initial bullish cycle from 2009 low after it rallied within an impulsive 5 waves advance which reached a pea at $121.8 peak on February of this year. The multinational corporation gained a total of %1330 during this 11 Years rally putting it on the list of one of the fastest growing stocks […]
-
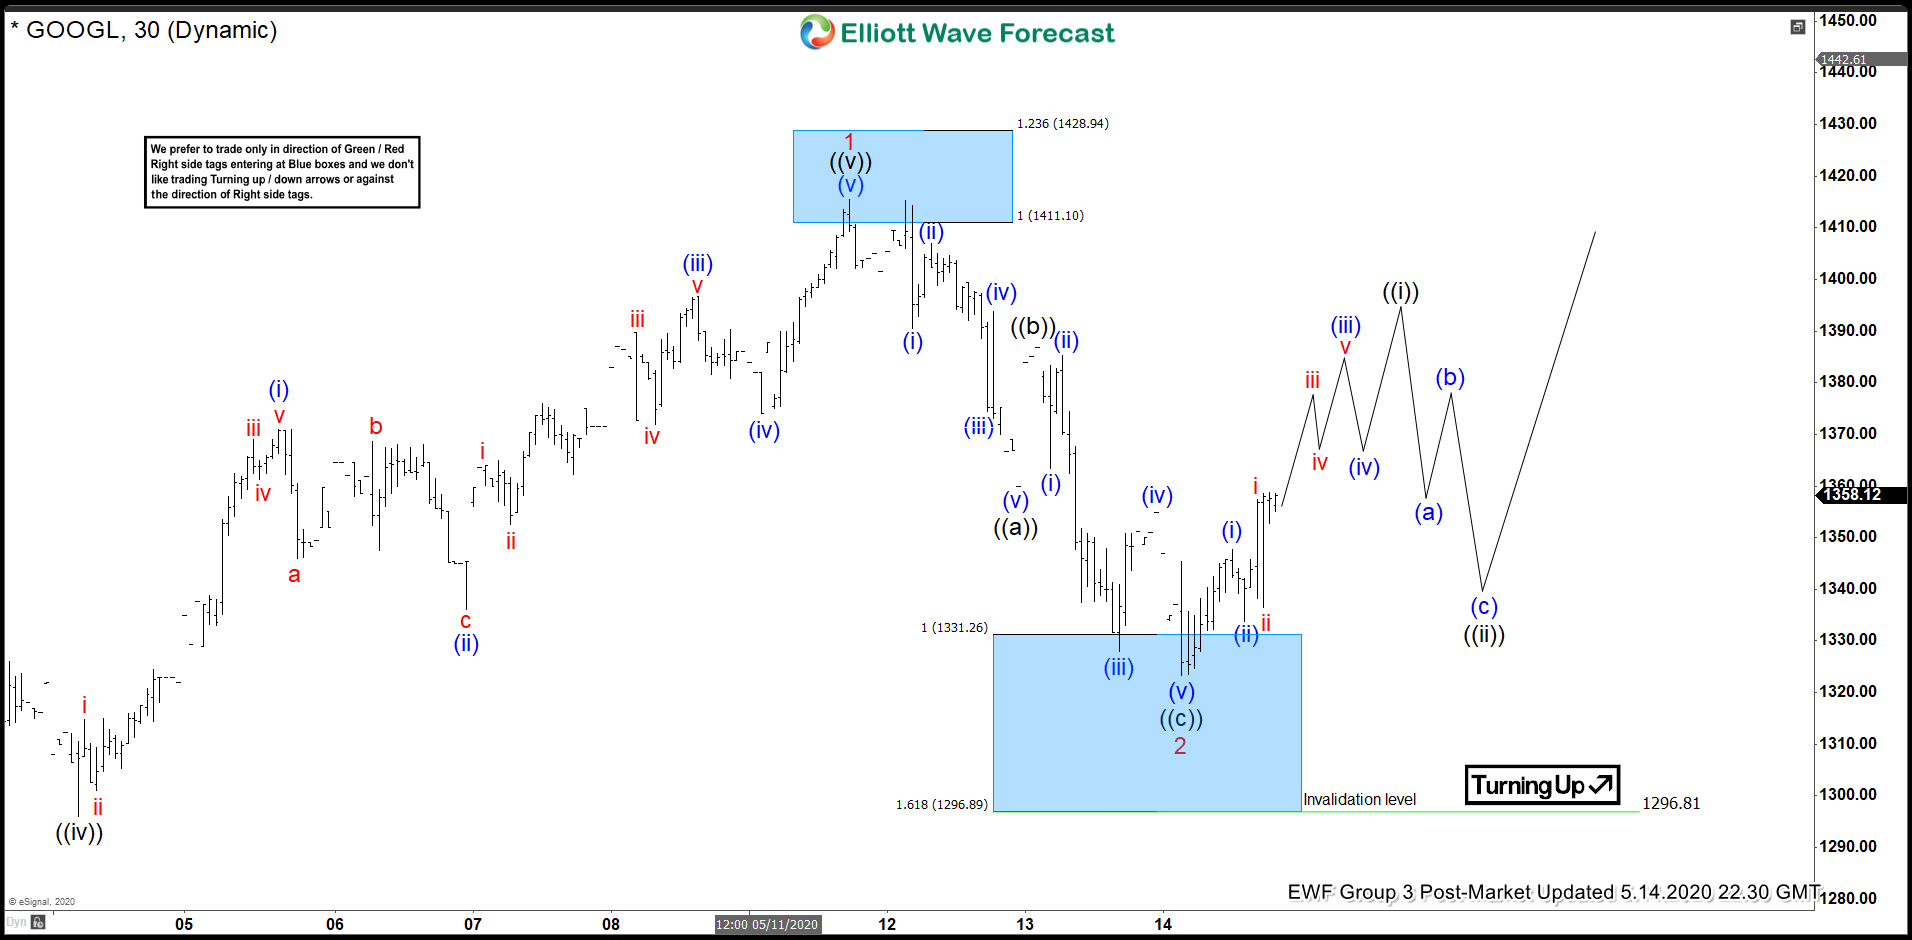
GOOGLE (GOOGL) Elliott Wave Forecasting The Path
Read MoreIn this technical blog we’re going to take a quick look at the Elliott Wave charts of GOOGL, published in members area of the website. The stock is trading within the cycle from the March 1009.6 low. Proposed cycle can be still in progress as impulsive structure. In further text we’re going to explain Elliott […]
-
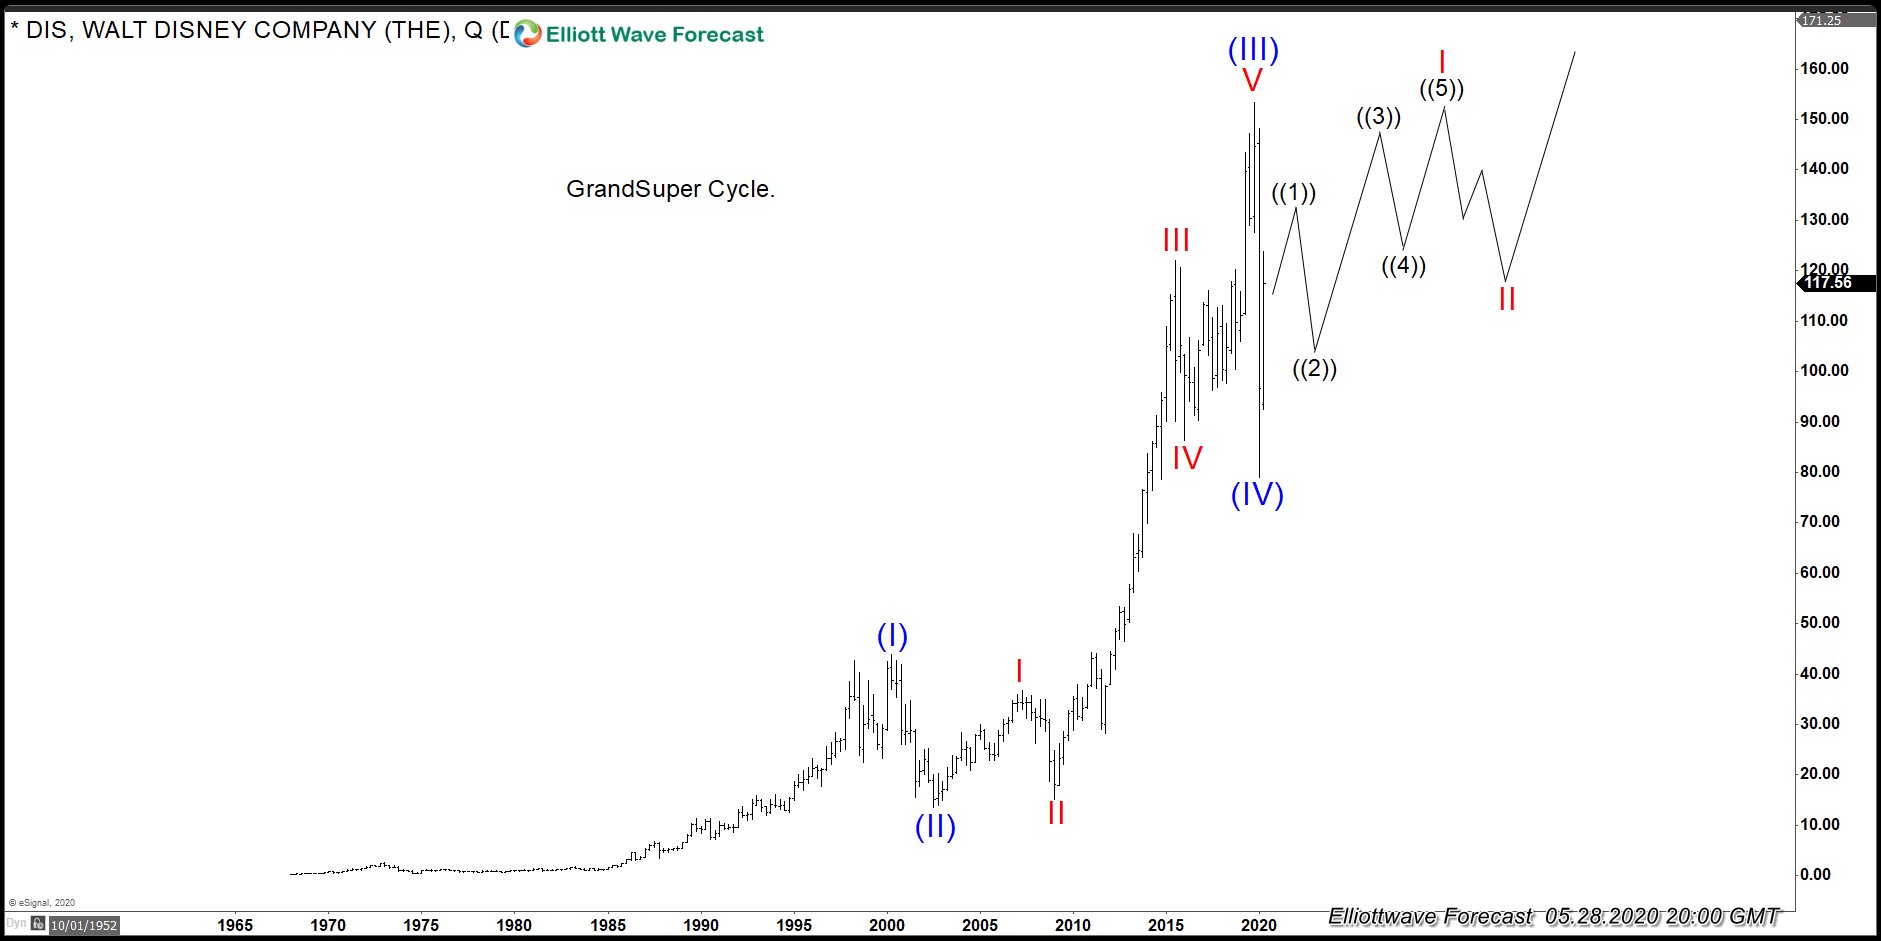
$DIS: Disney Parks Ready to Open, Stock Turning Higher
Read MoreLike most stocks around the world. Walt Disney Company (ticker: DIS) took a dip earlier in the year. The decline was expected across the world markets at one point during 2020, but we believe the market has started to turn higher into new all-time highs. The Grand Super cycle is showing three waves advance as […]
-
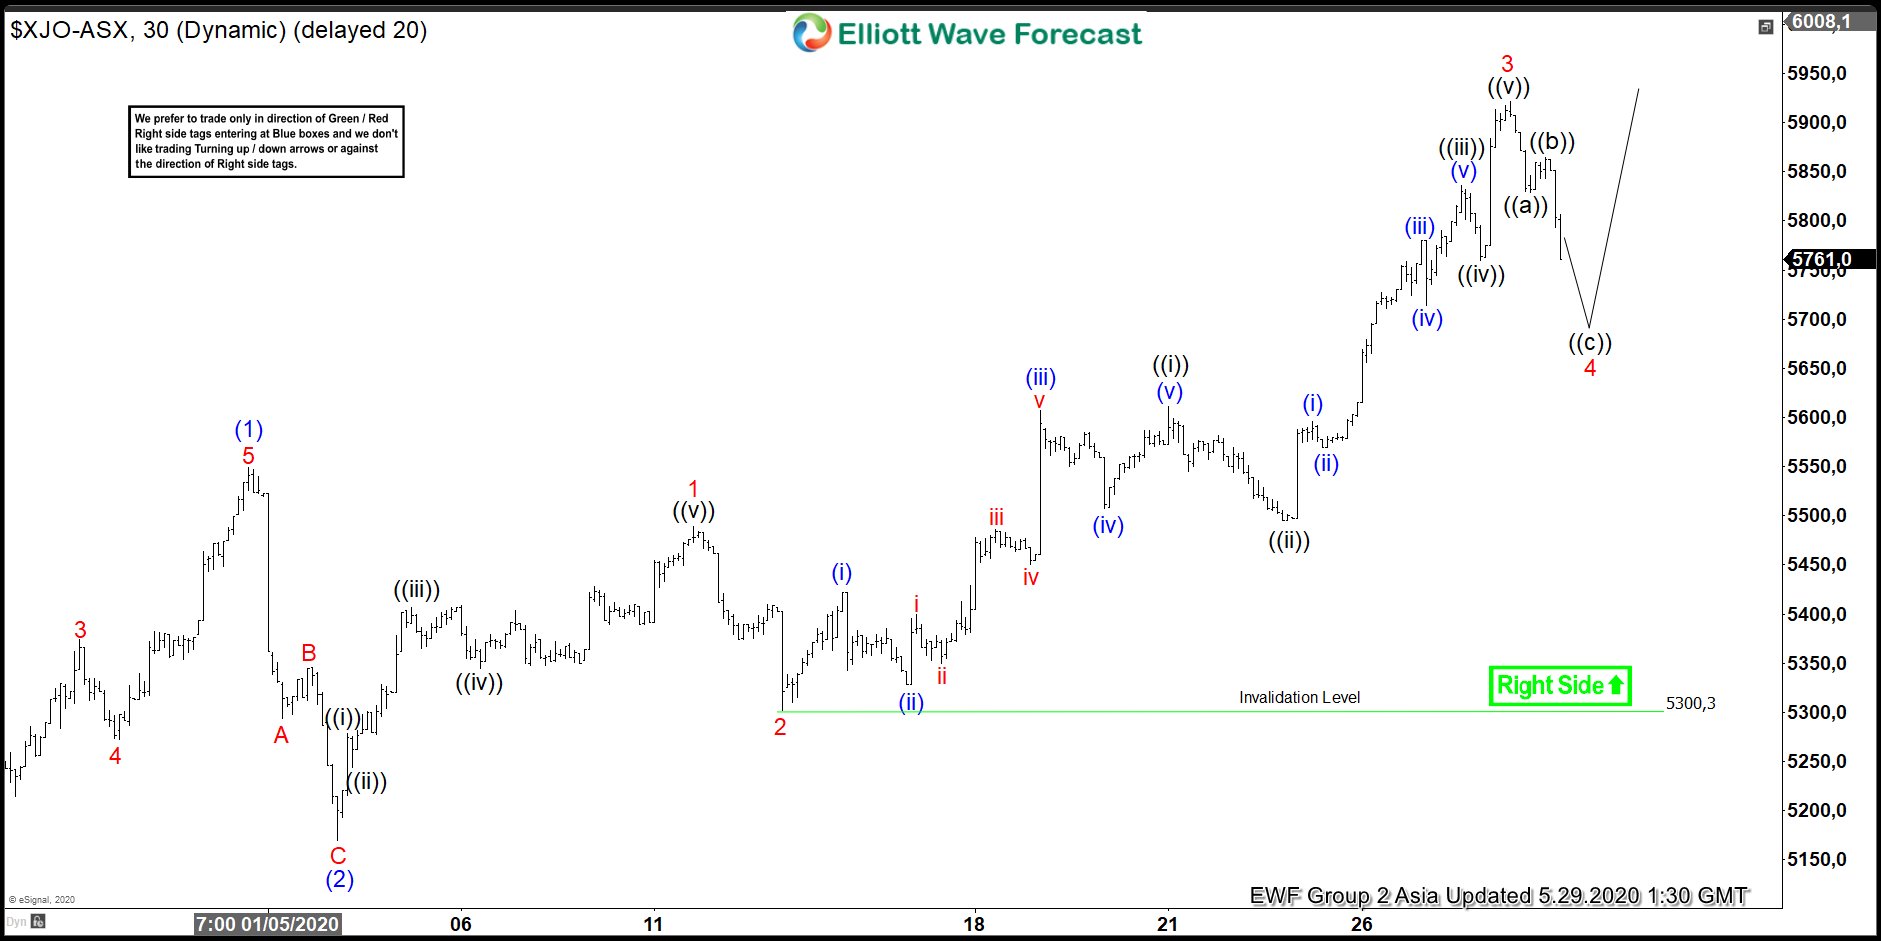
Elliott Wave View: Rally in ASX 200 (XJO) Should Extend
Read MoreASX 200 (XJO) shows incomplete sequence from 3.23.2020 low favoring more upside. This article and video look at the Elliott Wave path.
-
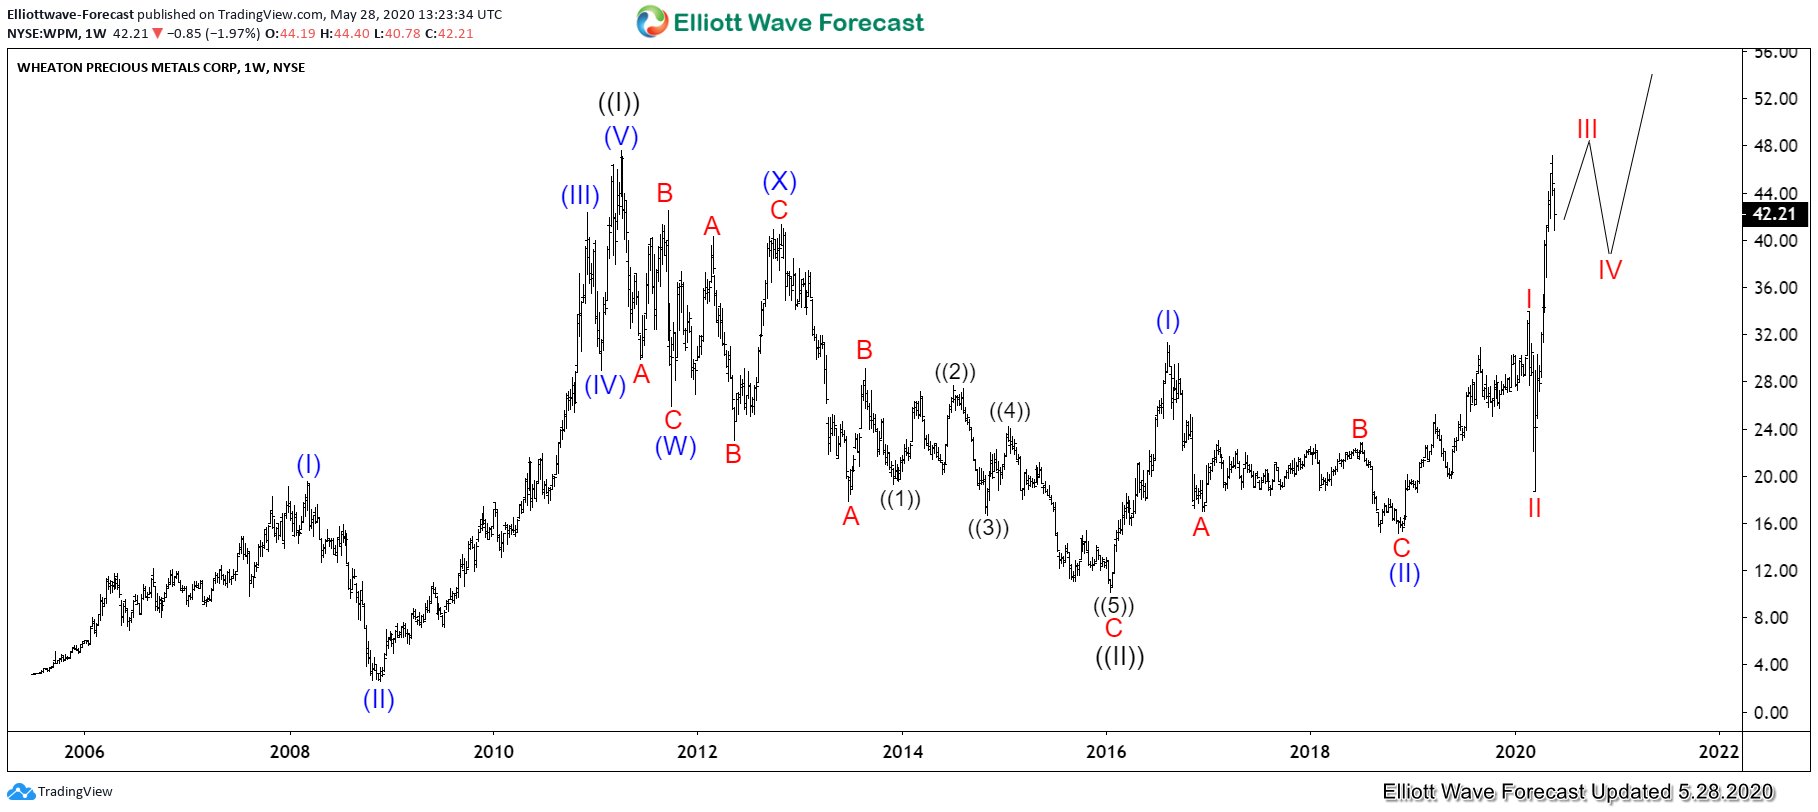
Wheaton Precious Metals (WPM) on Verge of Major Bullish Breakout
Read MoreWheaton Precious Metals Corp (WPM) is a multinational precious metals streaming company. Streaming is a term when a company such as WPM makes an agreement with a mining company to purchase all or part of the production at a predetermined price. Typically this is a by-product precious metals from a mine. In exchange, Wheaton will […]
-
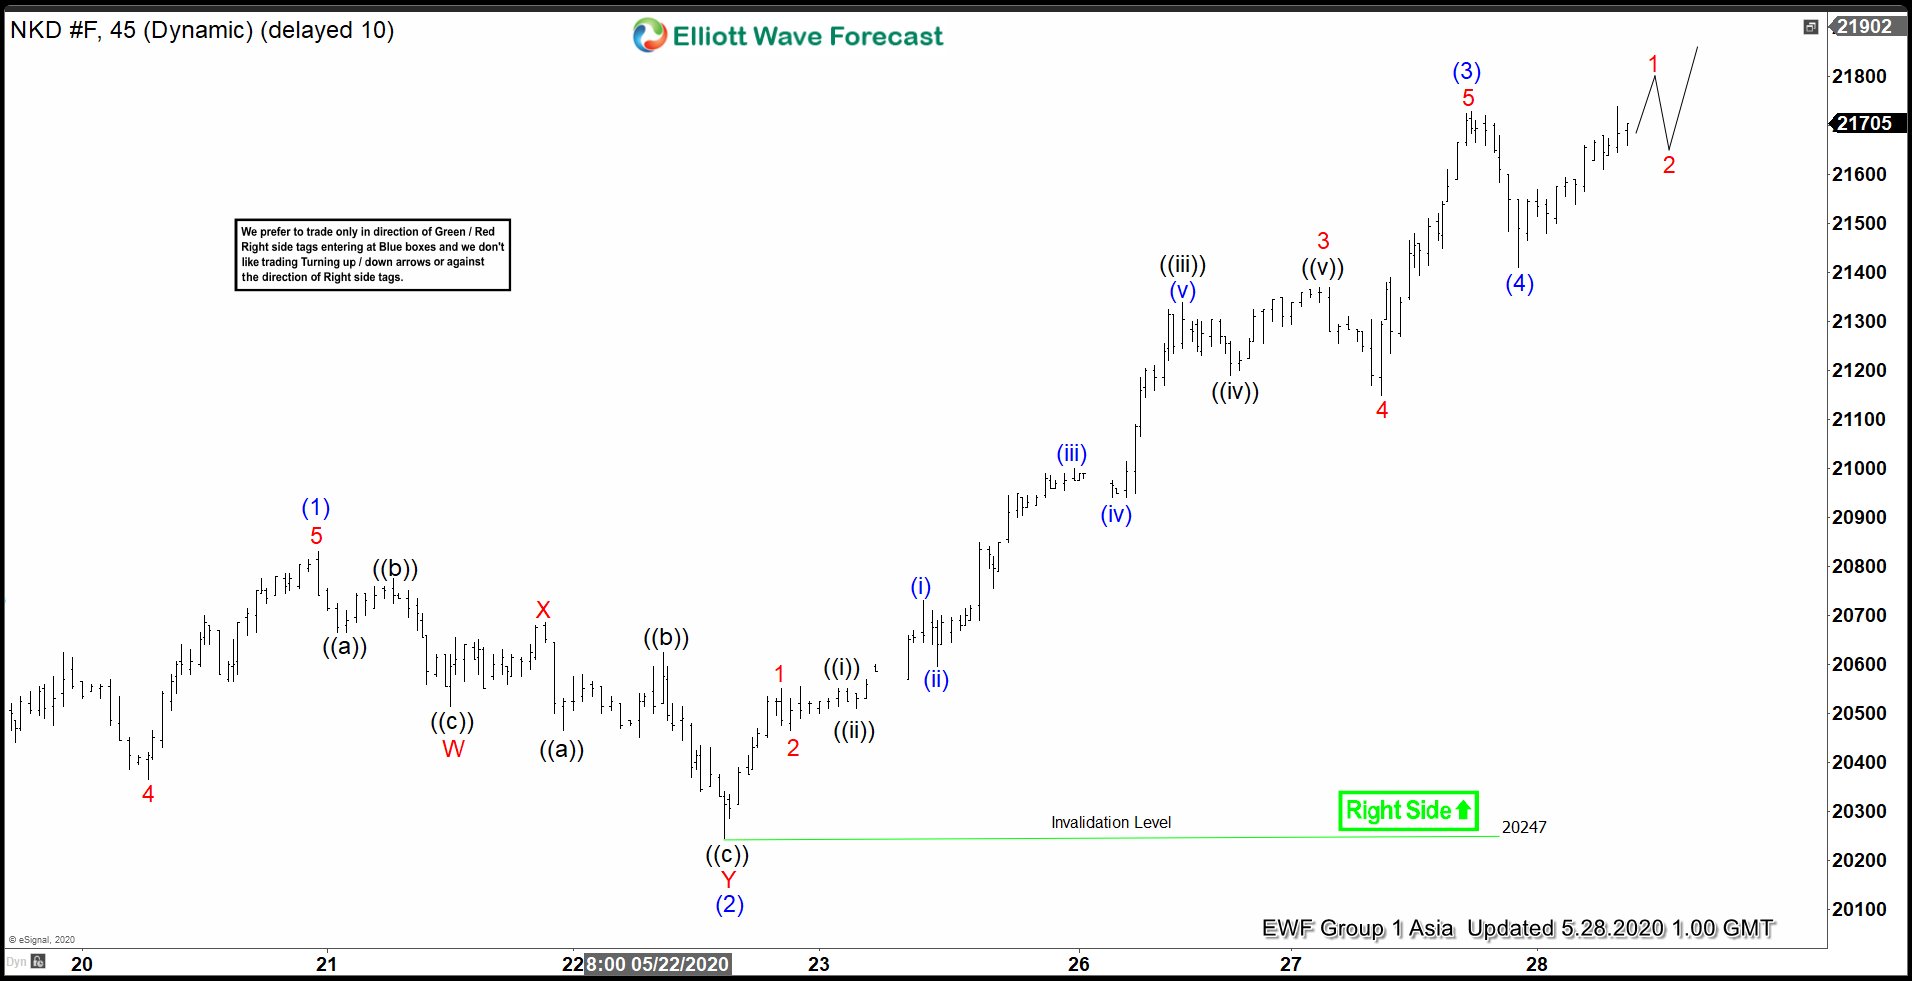
Elliott Wave View: Further Upside in Nikkei
Read MoreNikkei (NKD_F) rally from May 14 low as an impulsive structure favoring more upside. This article and video look at the Elliott Wave path.