

The Power of 3-7-11 and the Grand Super Cycle: How We Saw the Bullish Turn in April 2025 Back on April 9, 2025, while World Indices were dropping sharply and global sentiment had turned overwhelmingly bearish, we published an article that challenged the fear-driven narrative. We explained why selling was not the right approach and […]
-
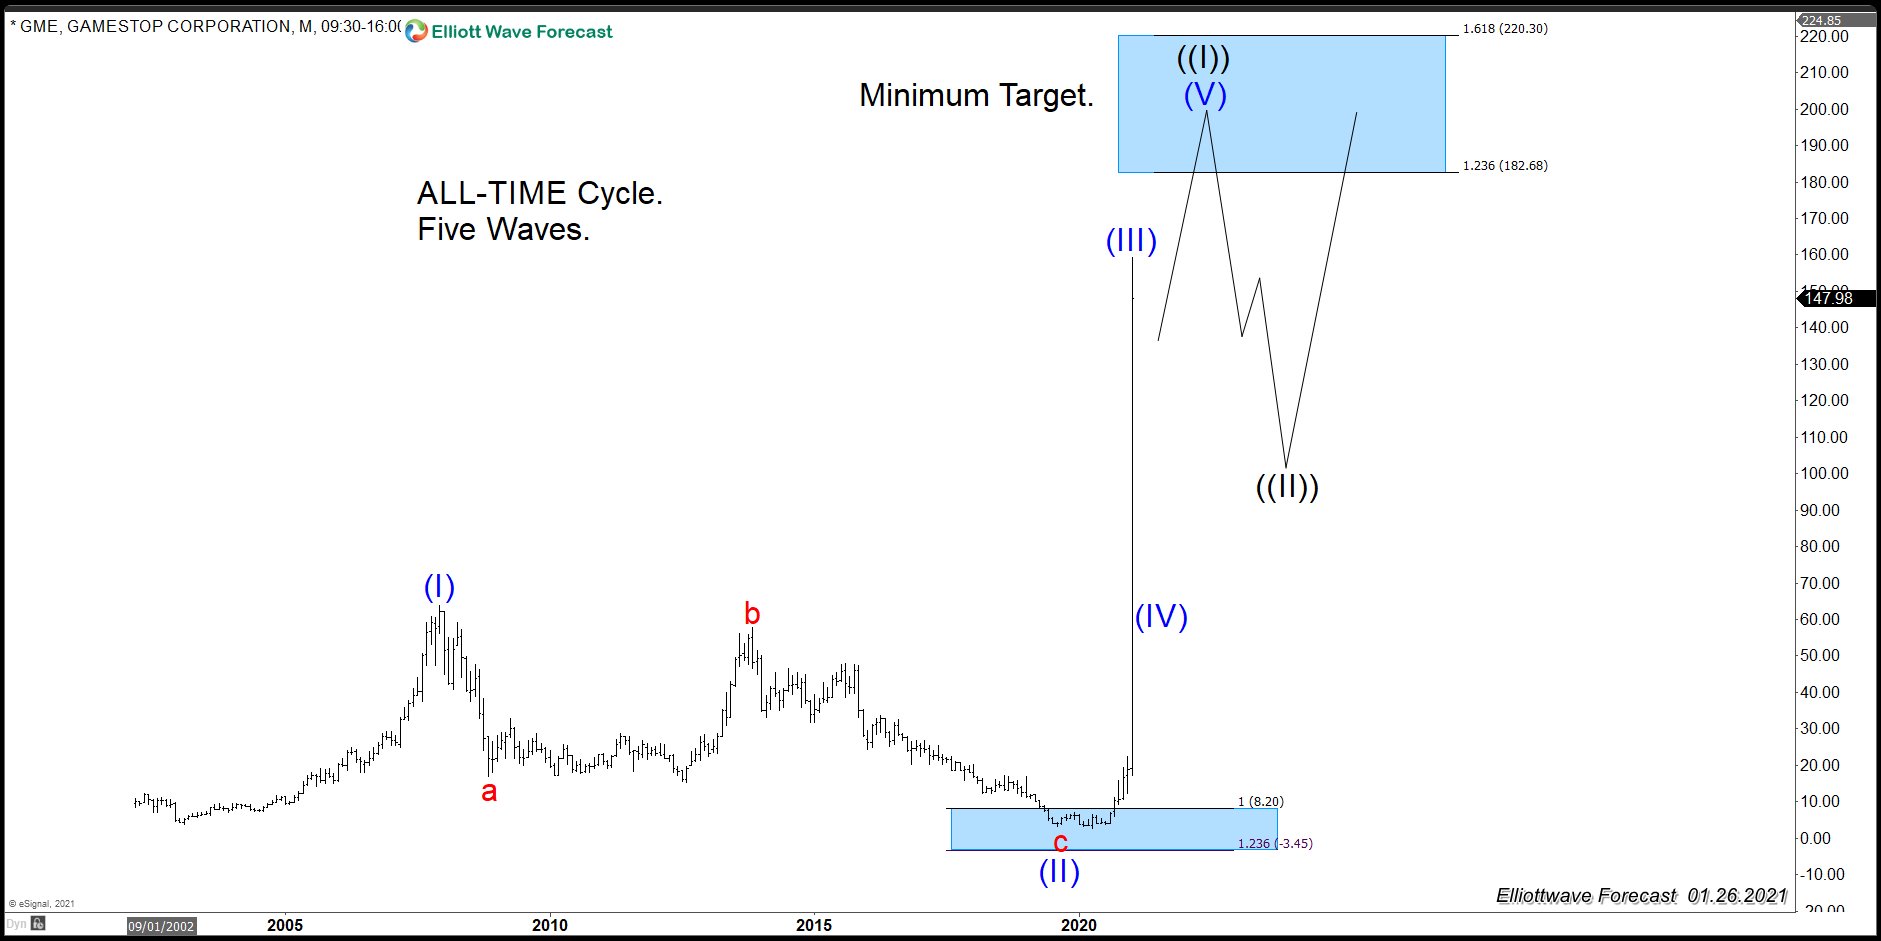
GME: A Wave (V) Might Happen with Minimum Target $182.00
Read More$GME (Game Stop) has been in a tremendous rally since it reached the blue box buying around the $8.20 area. The market has changed, and there is no question computers have taken over the market. We have done a series of articles explaining this idea. The market is always a fight between buyers and sellers. Knowing […]
-
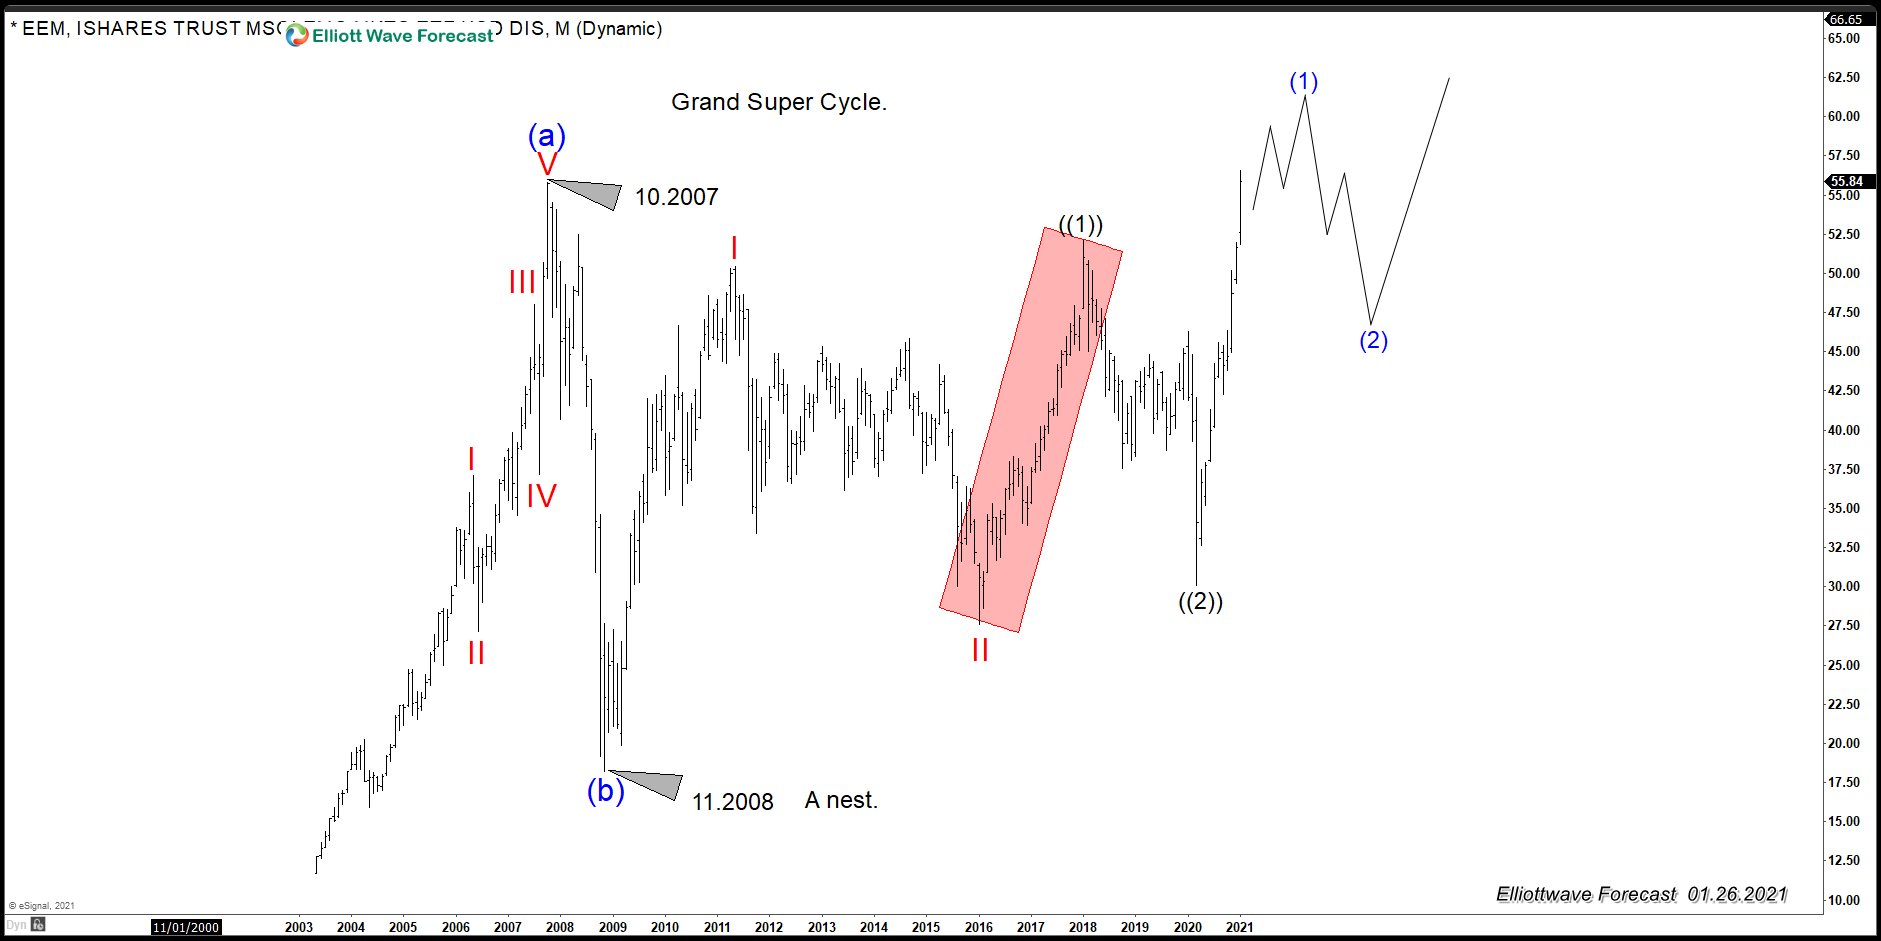
Possible Nesting Structure in EEM May Support World Indices
Read MoreAs we always do at Elliottwave-Forecast, we look at the market as a whole. We track over hundreds of instrument around the world to get a more complete forecast. There is a degree of correlation among different instrument and we have developed a system to identify them. We group together correlated instrument and create different […]
-
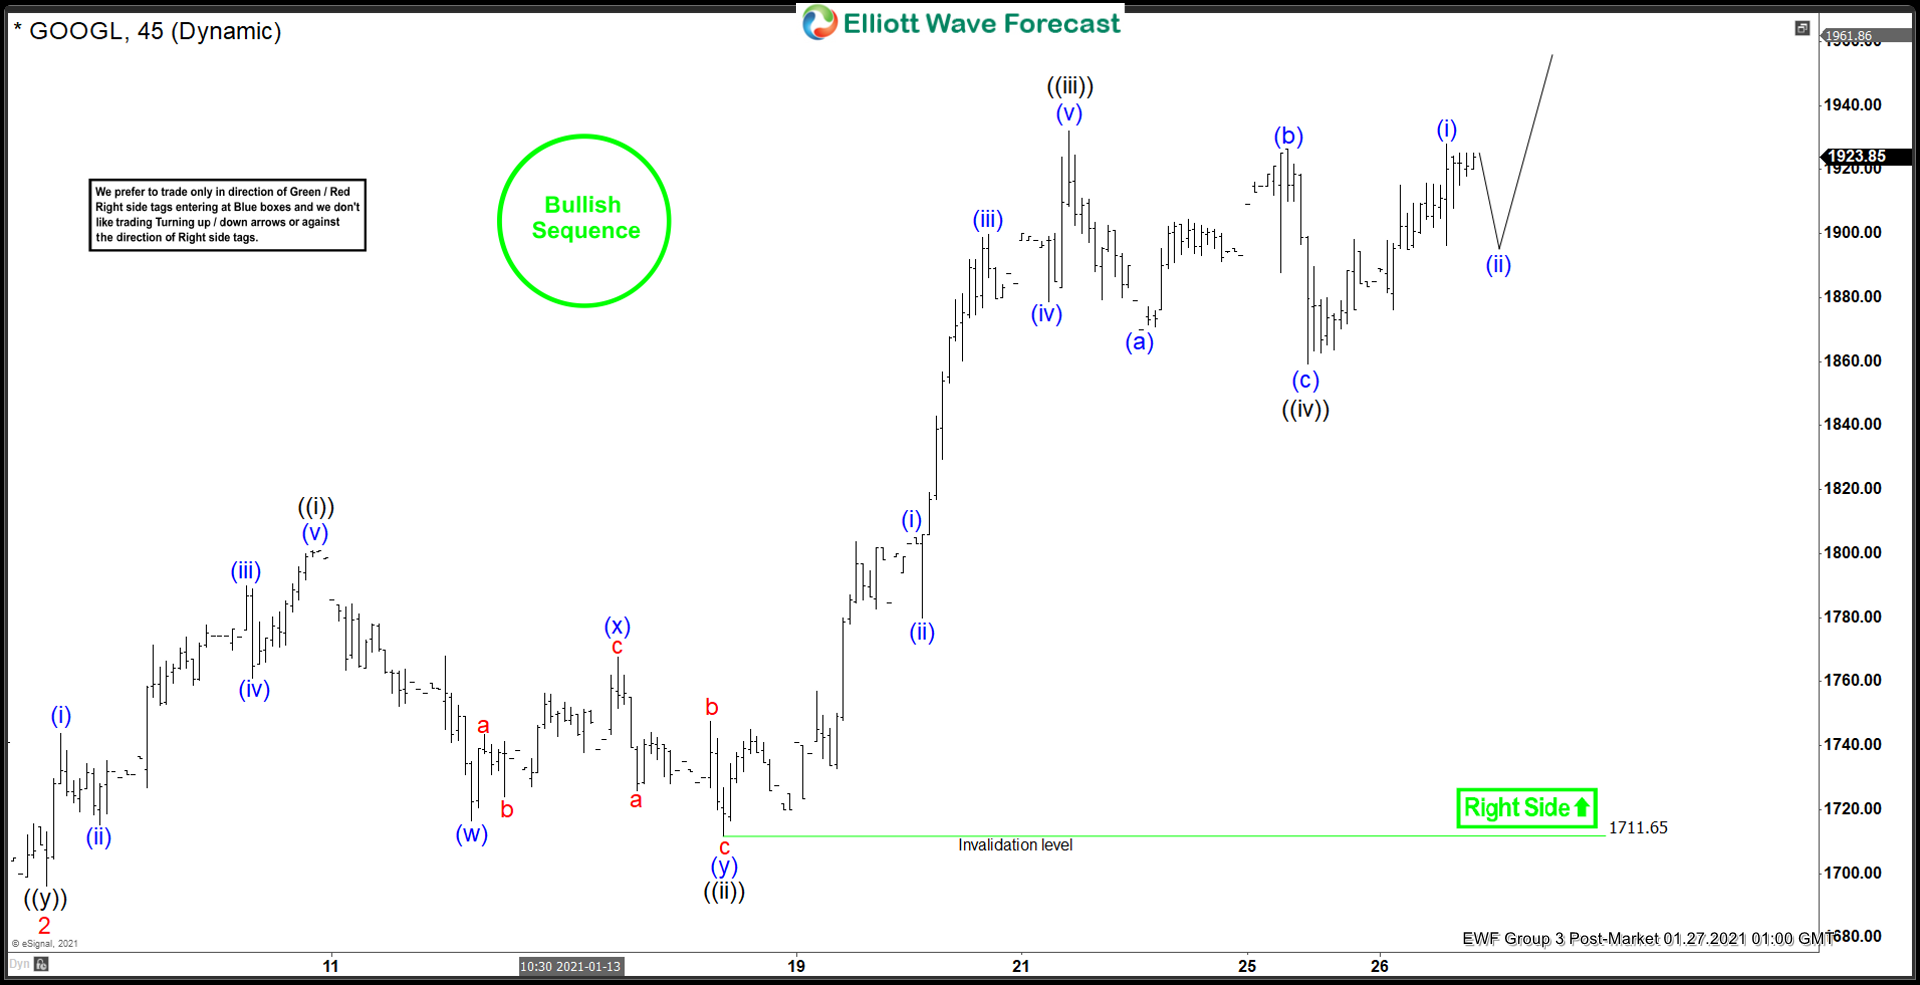
Elliott Wave View: Alphabet (GOOGL) Impulsive Rally Incomplete
Read MoreAlphabet (GOOGL) shows incomplete impulsive structure from December 21 low favoring more upside. This article and video look at the Elliott Wave path.
-
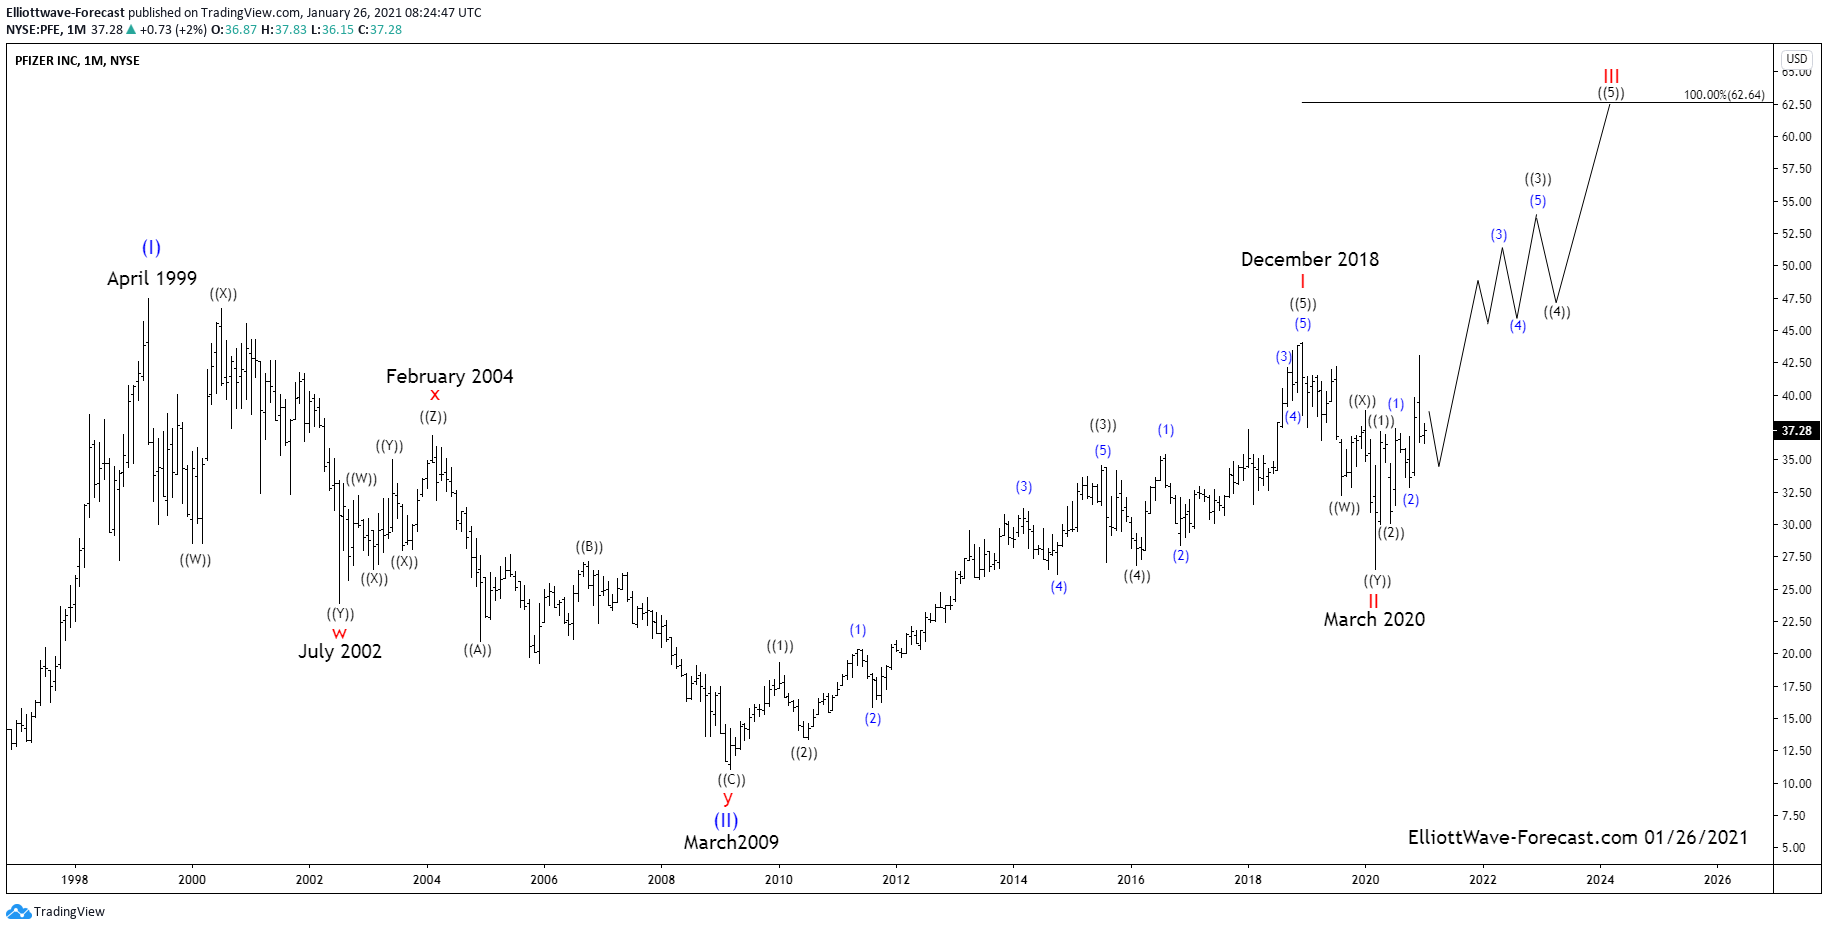
Pfizer Long Term Bullish Trend and Elliott Wave Cycles $PFE
Read MorePfizer Long Term Bullish Trend and Elliott Wave Cycles $PFE The Pfizer Long Term Bullish Trend and Elliott Wave Cycles suggest the stock price will be trending higher. The cycles project it should continue toward the April 1999 highs while it is above the March 2020 lows. From the beginning of the stock trading it […]
-
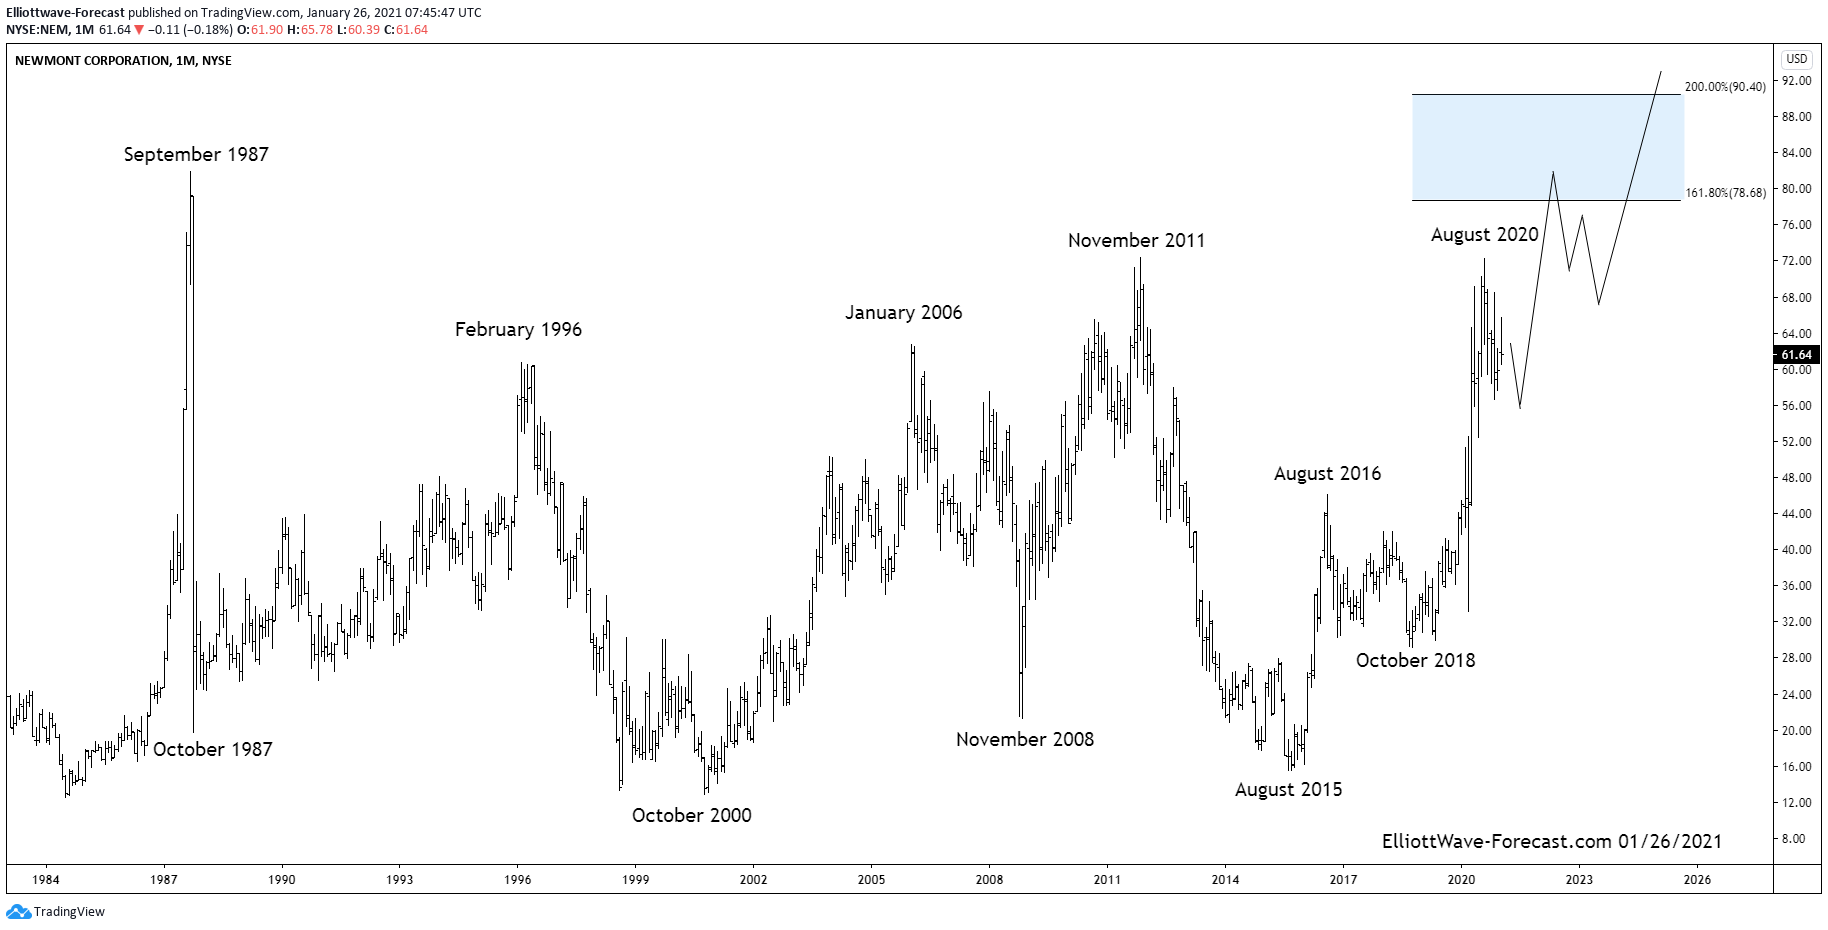
The Newmont Corporation Longer Term Bullish Cycles $NEM
Read MoreThe Newmont Corporation Longer Term Bullish Cycles $NEM Firstly from the beginning of price data from back in the 1970’s not shown on the chart, the price trend was obviously up. It ended that bullish cycle in September 1987 and pulled back really hard during the October 1987 crash. Price stabilized from there several years […]
-
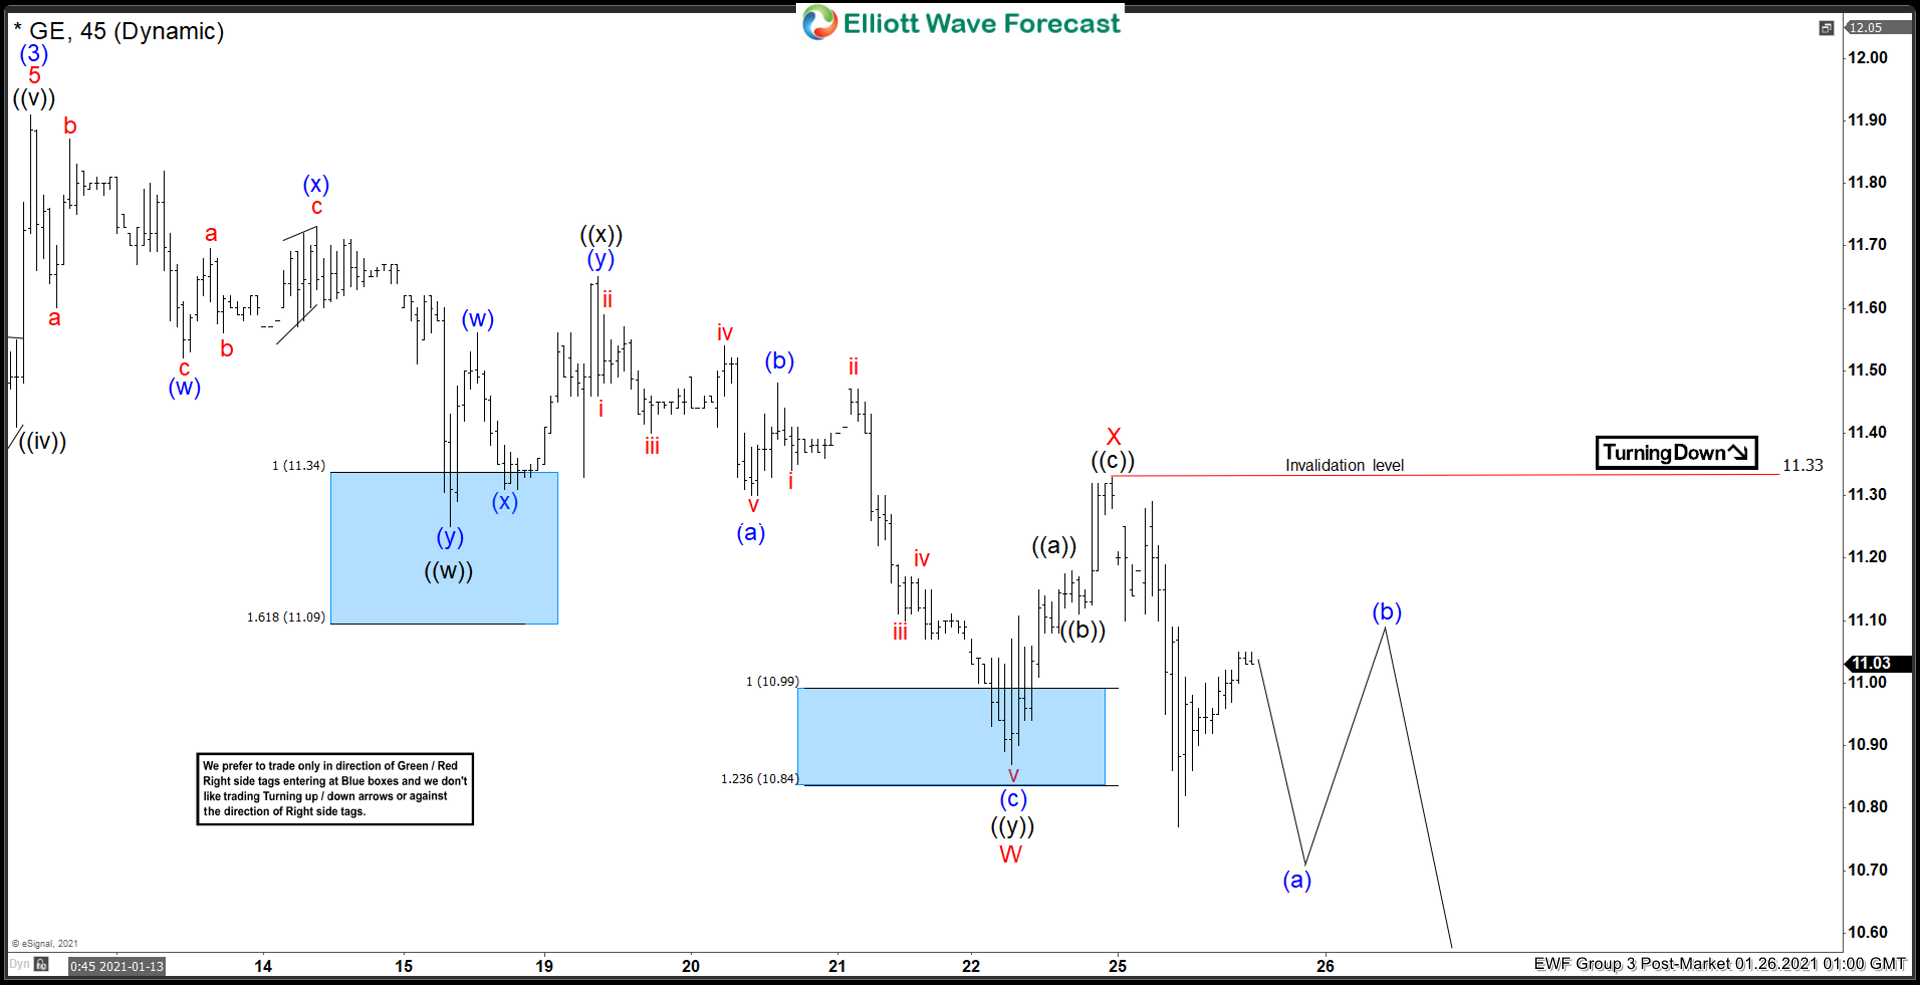
Elliott Wave View: General Electric (GE) Has Further Downside in Correction
Read MoreGeneral Electric (GE) shows incomplete sequence from January 13 peak & the stock can see more downside. This article & video look at the Elliott Wave path.