

The Power of 3-7-11 and the Grand Super Cycle: How We Saw the Bullish Turn in April 2025 Back on April 9, 2025, while World Indices were dropping sharply and global sentiment had turned overwhelmingly bearish, we published an article that challenged the fear-driven narrative. We explained why selling was not the right approach and […]
-
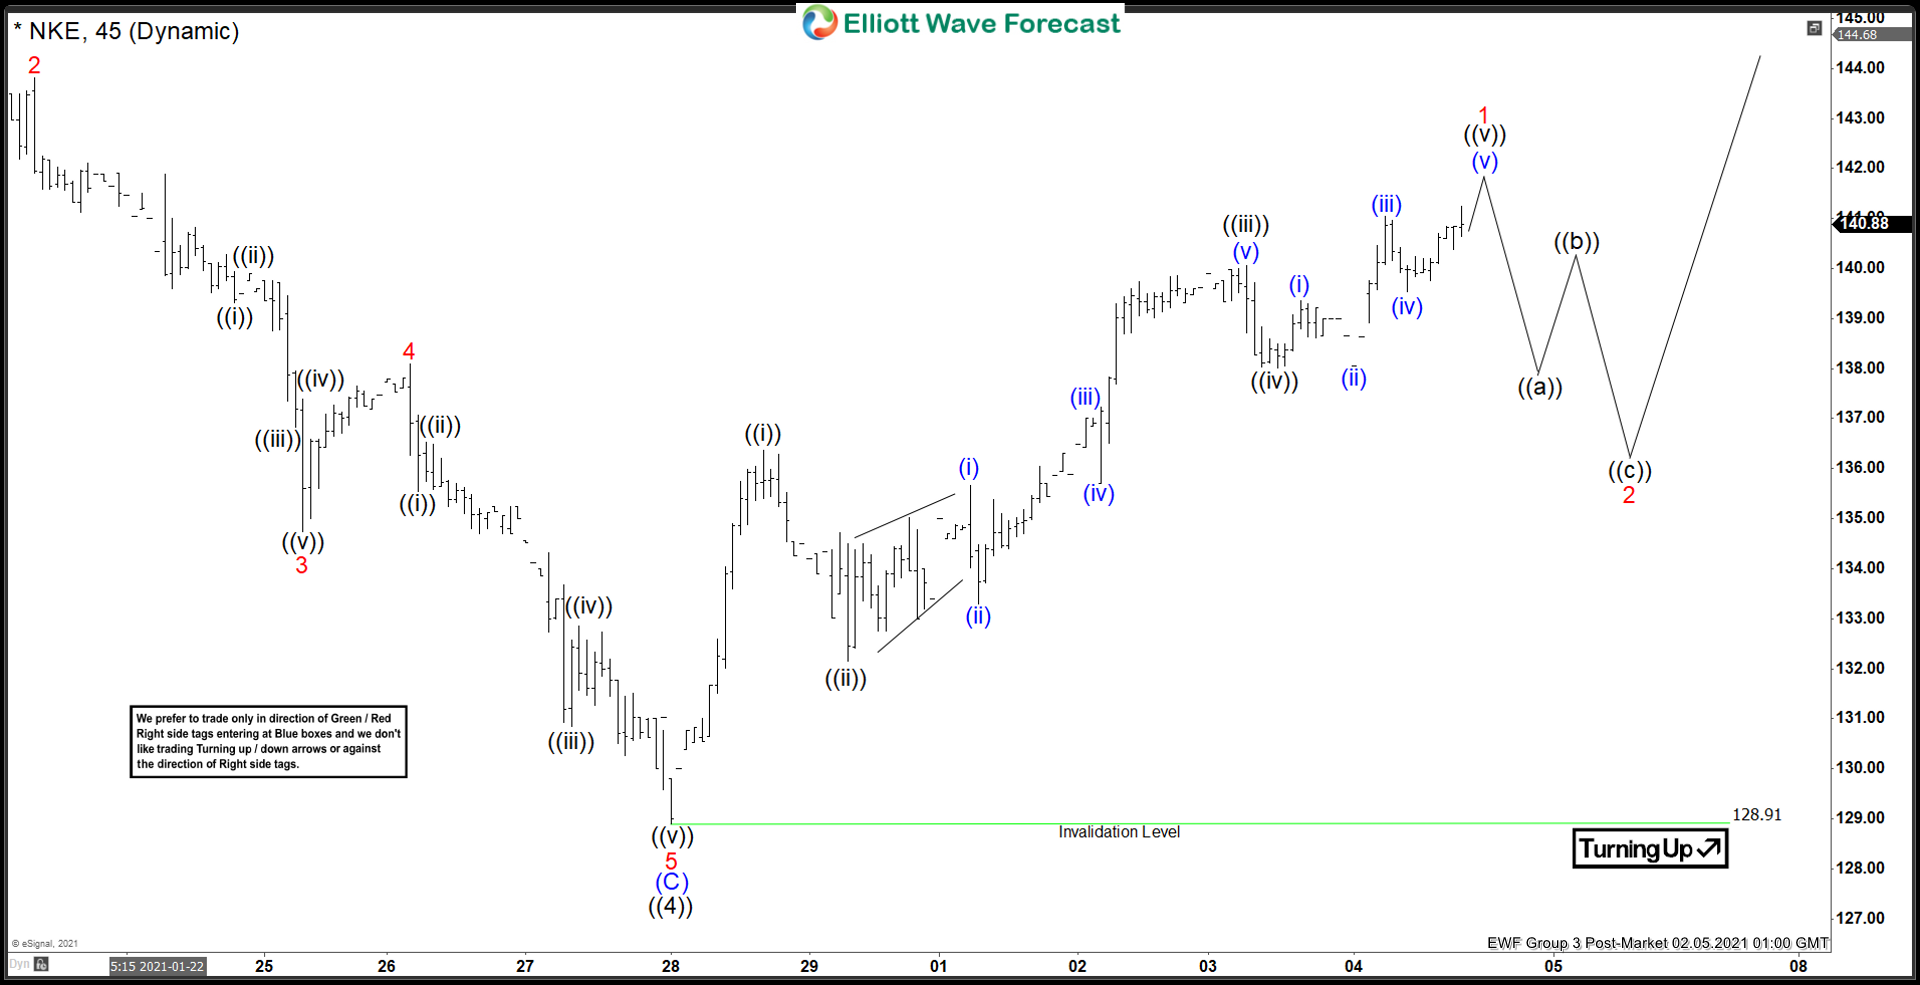
Elliott Wave View: Nike Impulsive Rally Favors More Upside
Read MoreNike rally from January 28 low looks impulsive favoring more upside. In this article and video, we look at the Elliott Wave path of the stock.
-
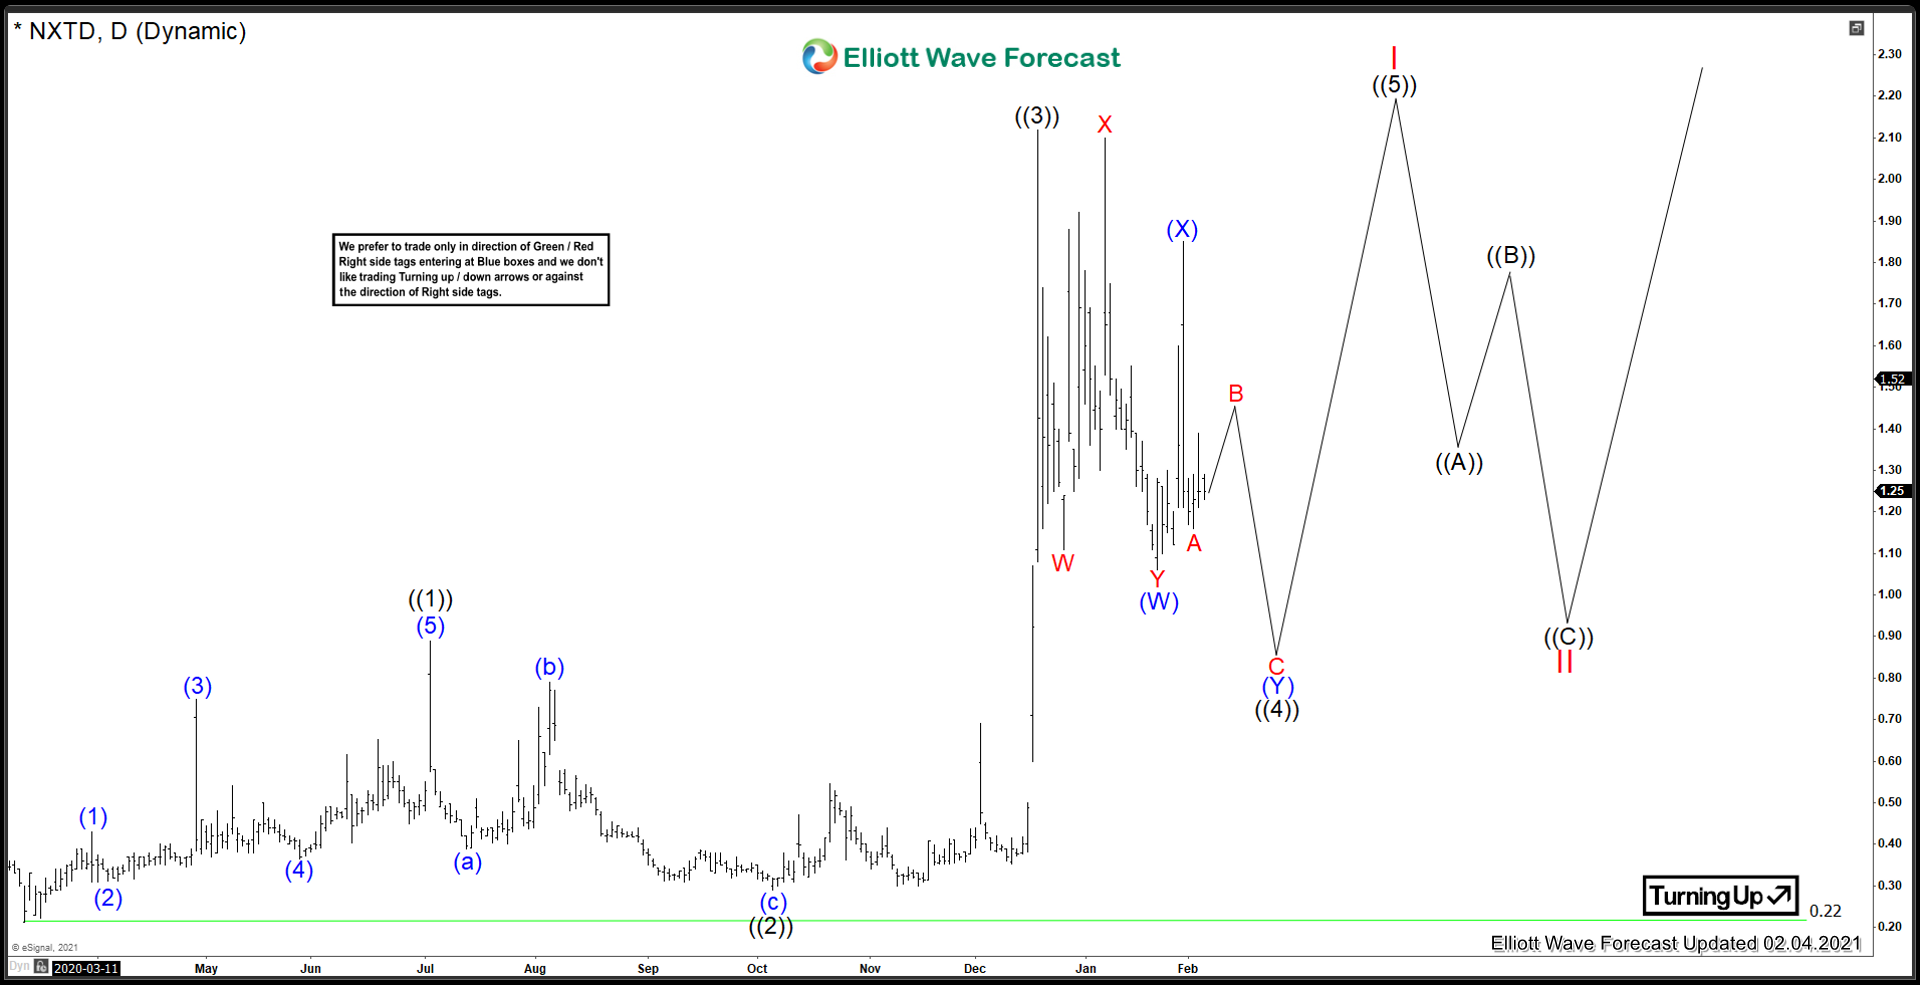
NXT -ID ($NXTD) Close to moving higher
Read MoreWith Bitcoin recently breaking out to new all time highs the Crypto and Blockchain market has reached fever pitch. NXT -ID isn’t your typical crypto stock, but it is in the related field of blockchain. Lets take a look at what the company does: “NXT-ID is a manufacturer and distributor of non-monitored and monitored personal […]
-
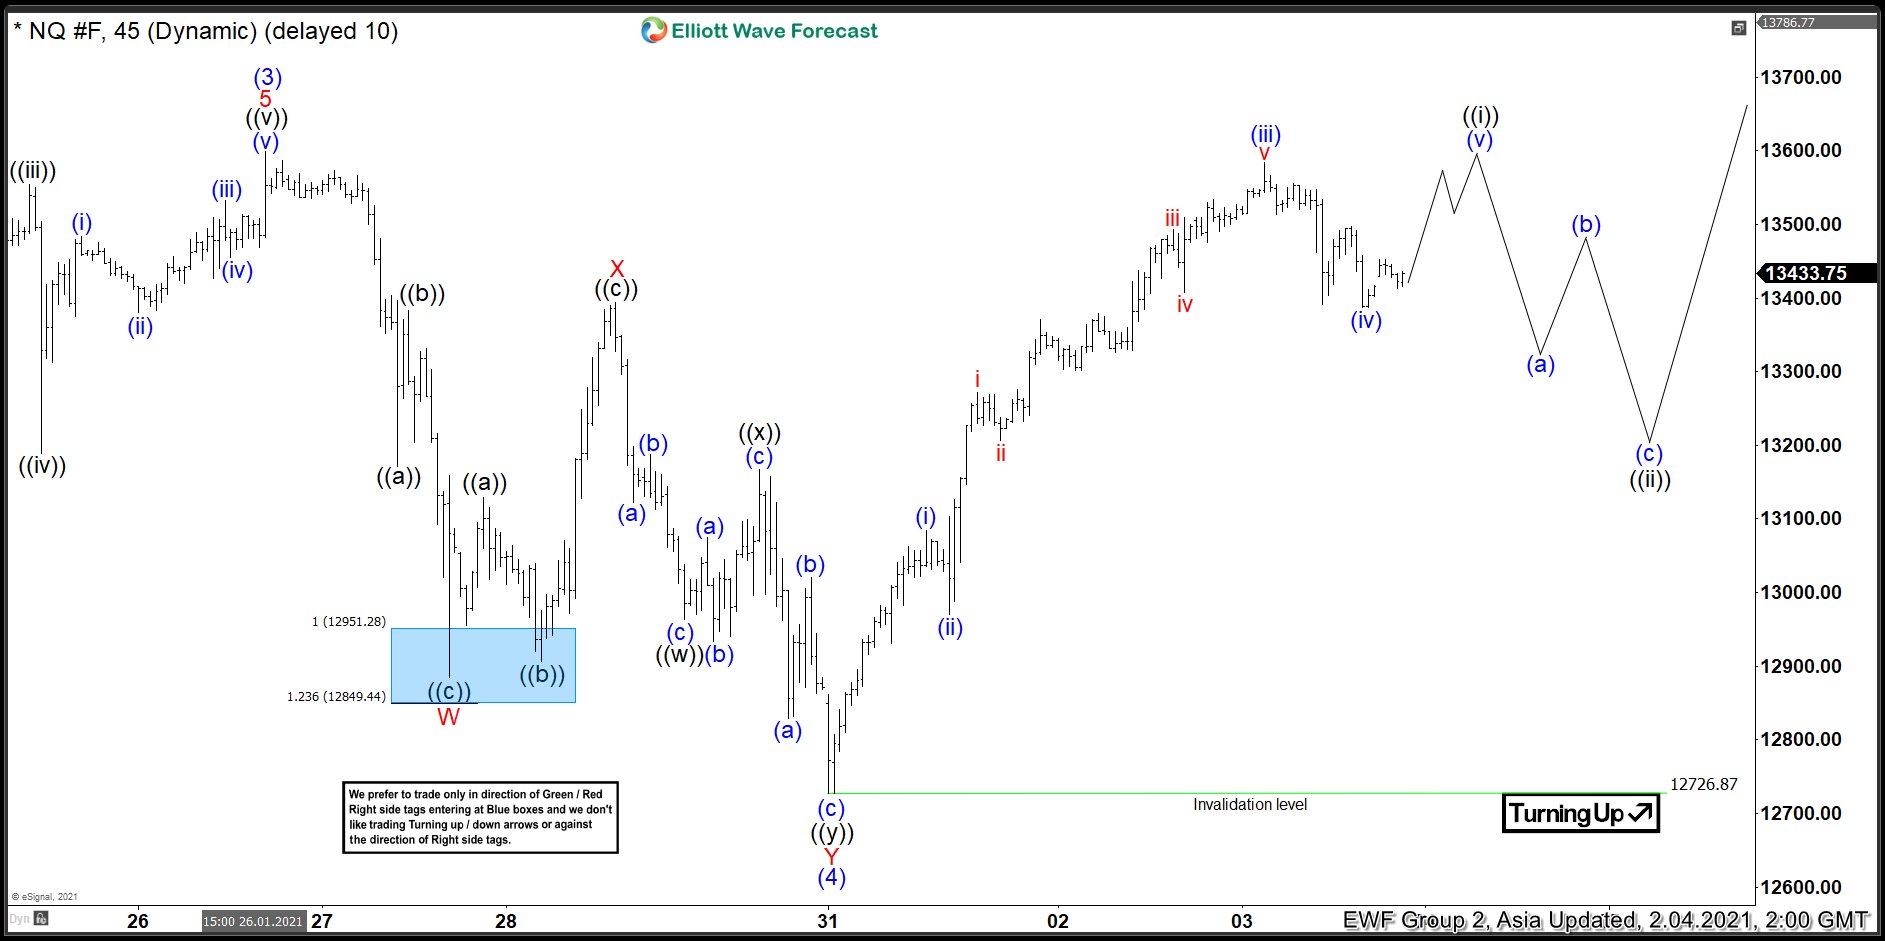
Elliott Wave View: Nasdaq All-Time High Imminent?
Read MoreNasdaq is close to making a new all-time high. In this article and video, we look at the short term Elliott Wave path for the Index.
-
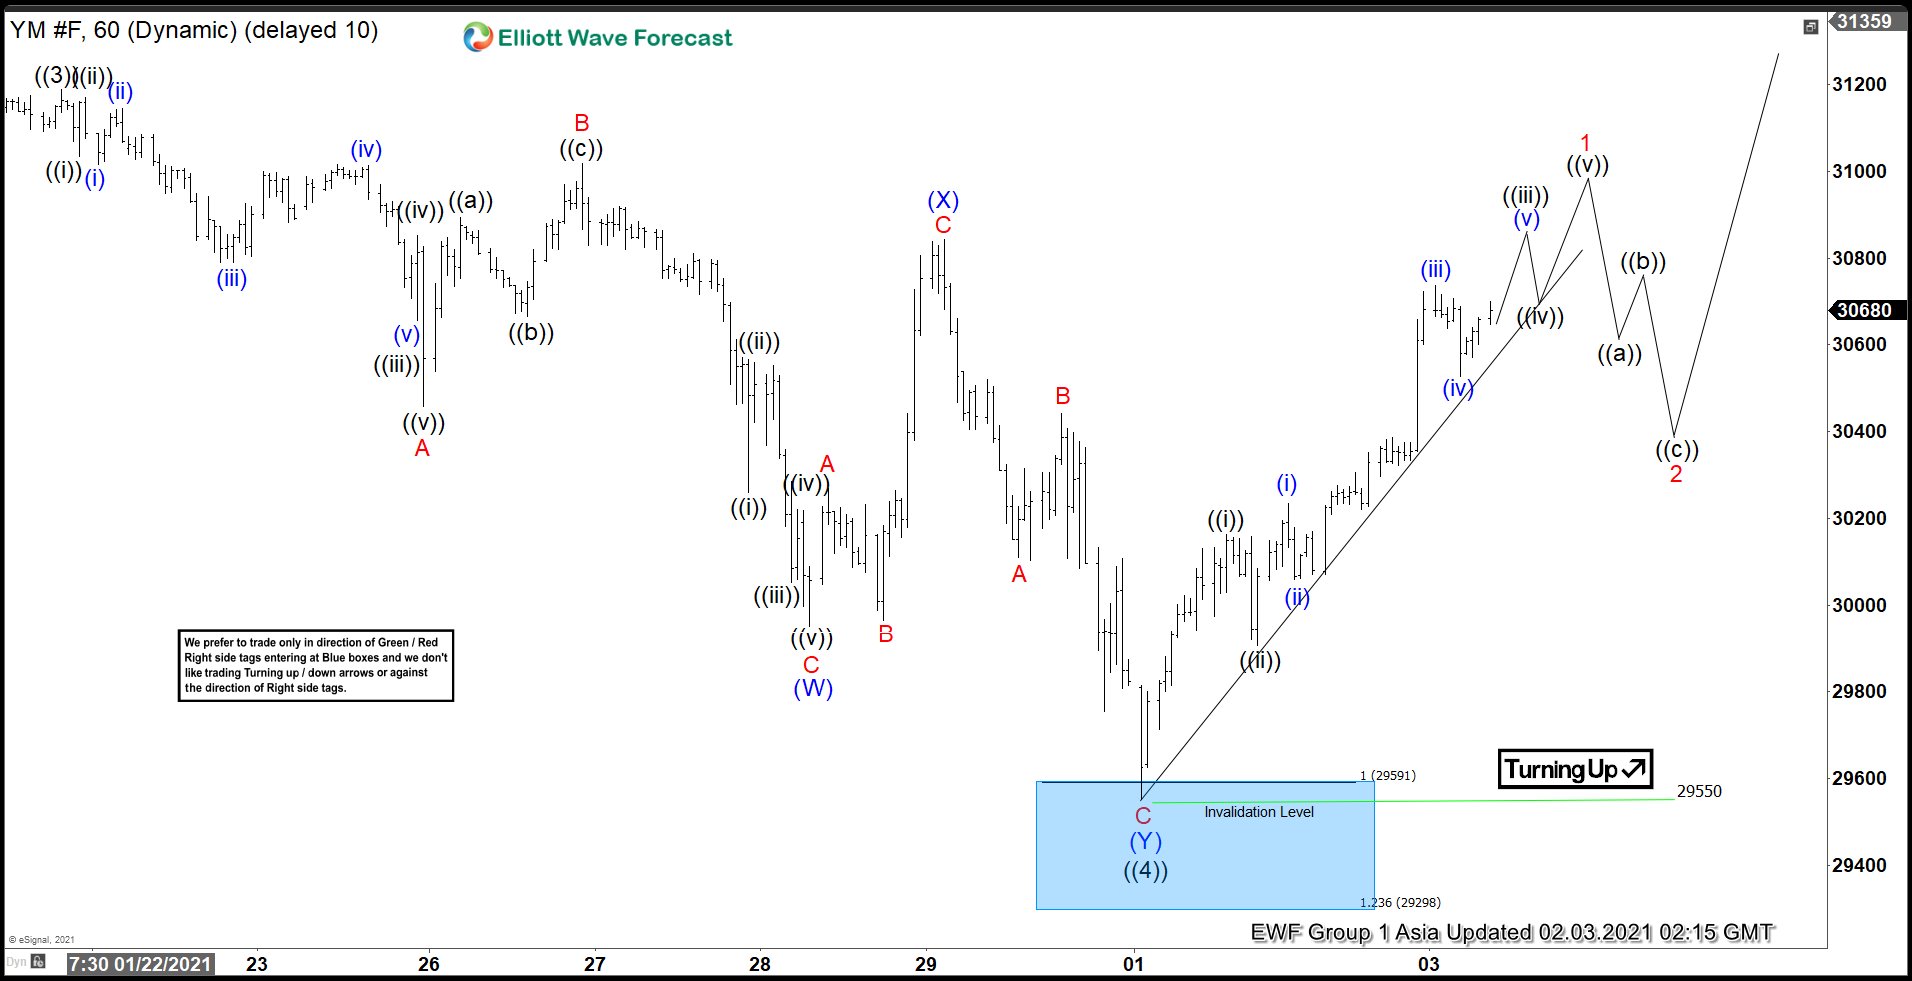
Elliott Wave View: Dow Futures Attempting All-Time High
Read MoreDow Futures Attempts to Rally to New All-Time High. In this article and video, we will look at the Elliott Wave path of the Index.
-
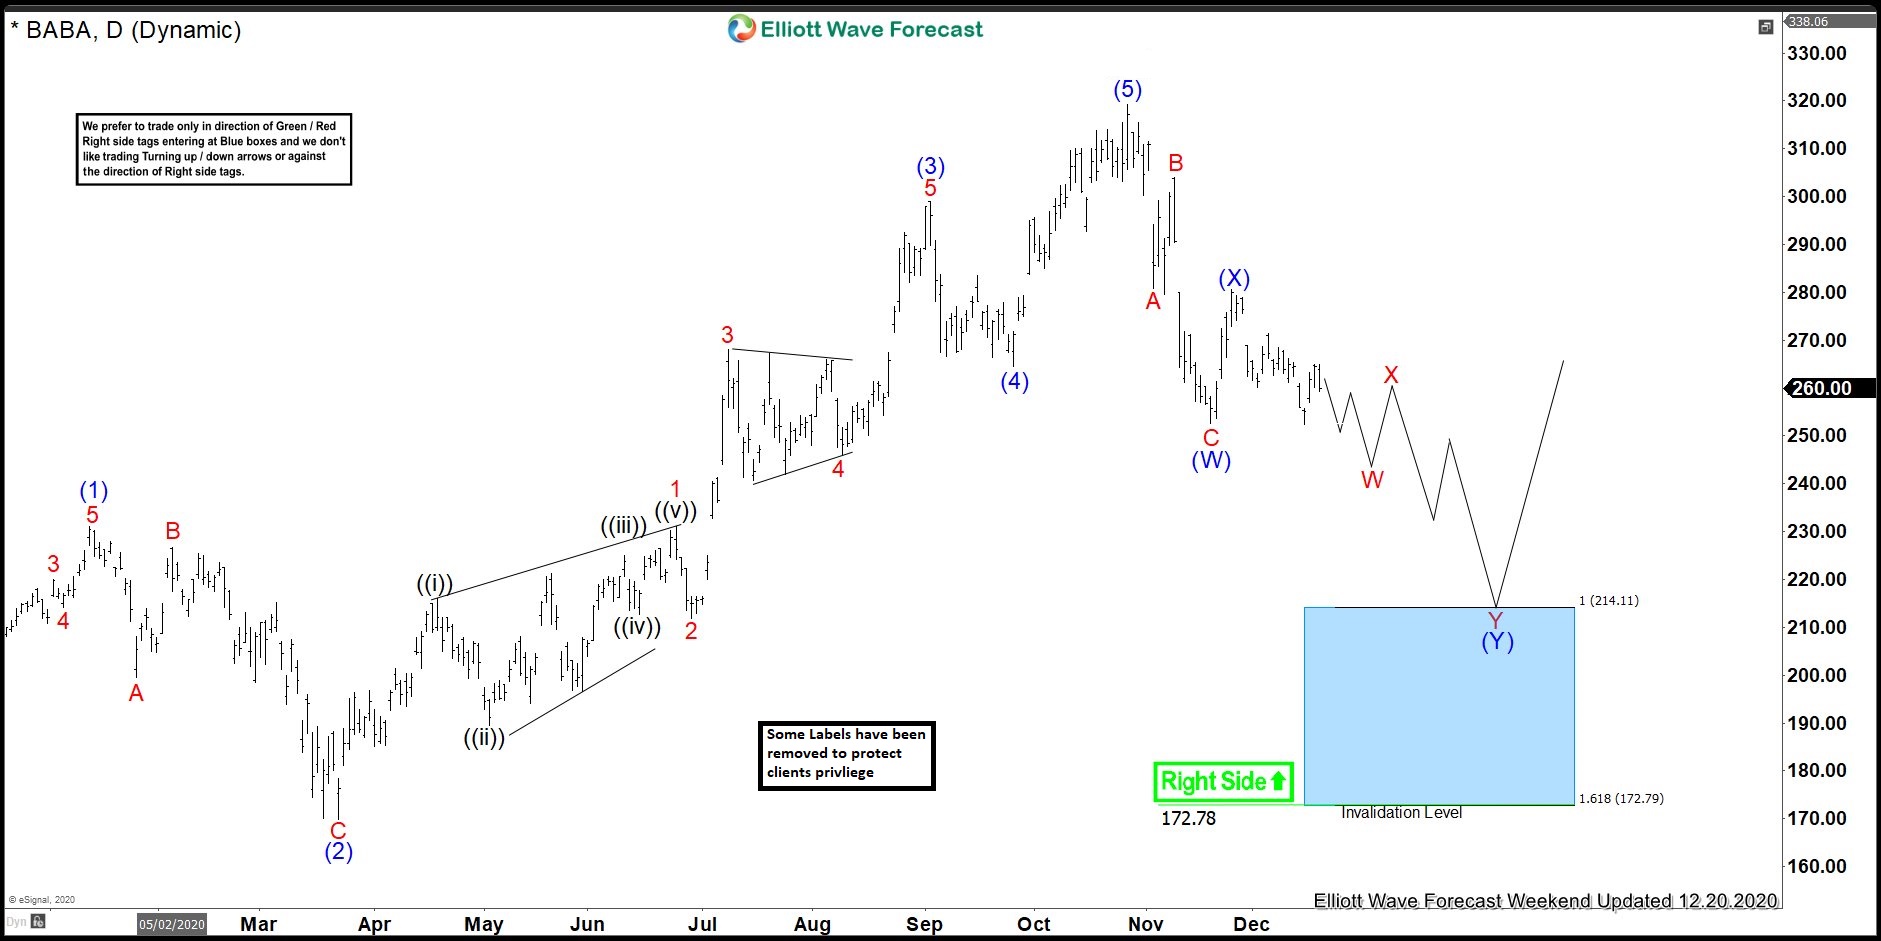
BABA Forecasting The Bounce After Double Correction Lower
Read MoreIn this blog, we take a look at the past performance of Daily Elliott Wave charts of BABA, In which our members took advantage of the blue box areas.
-
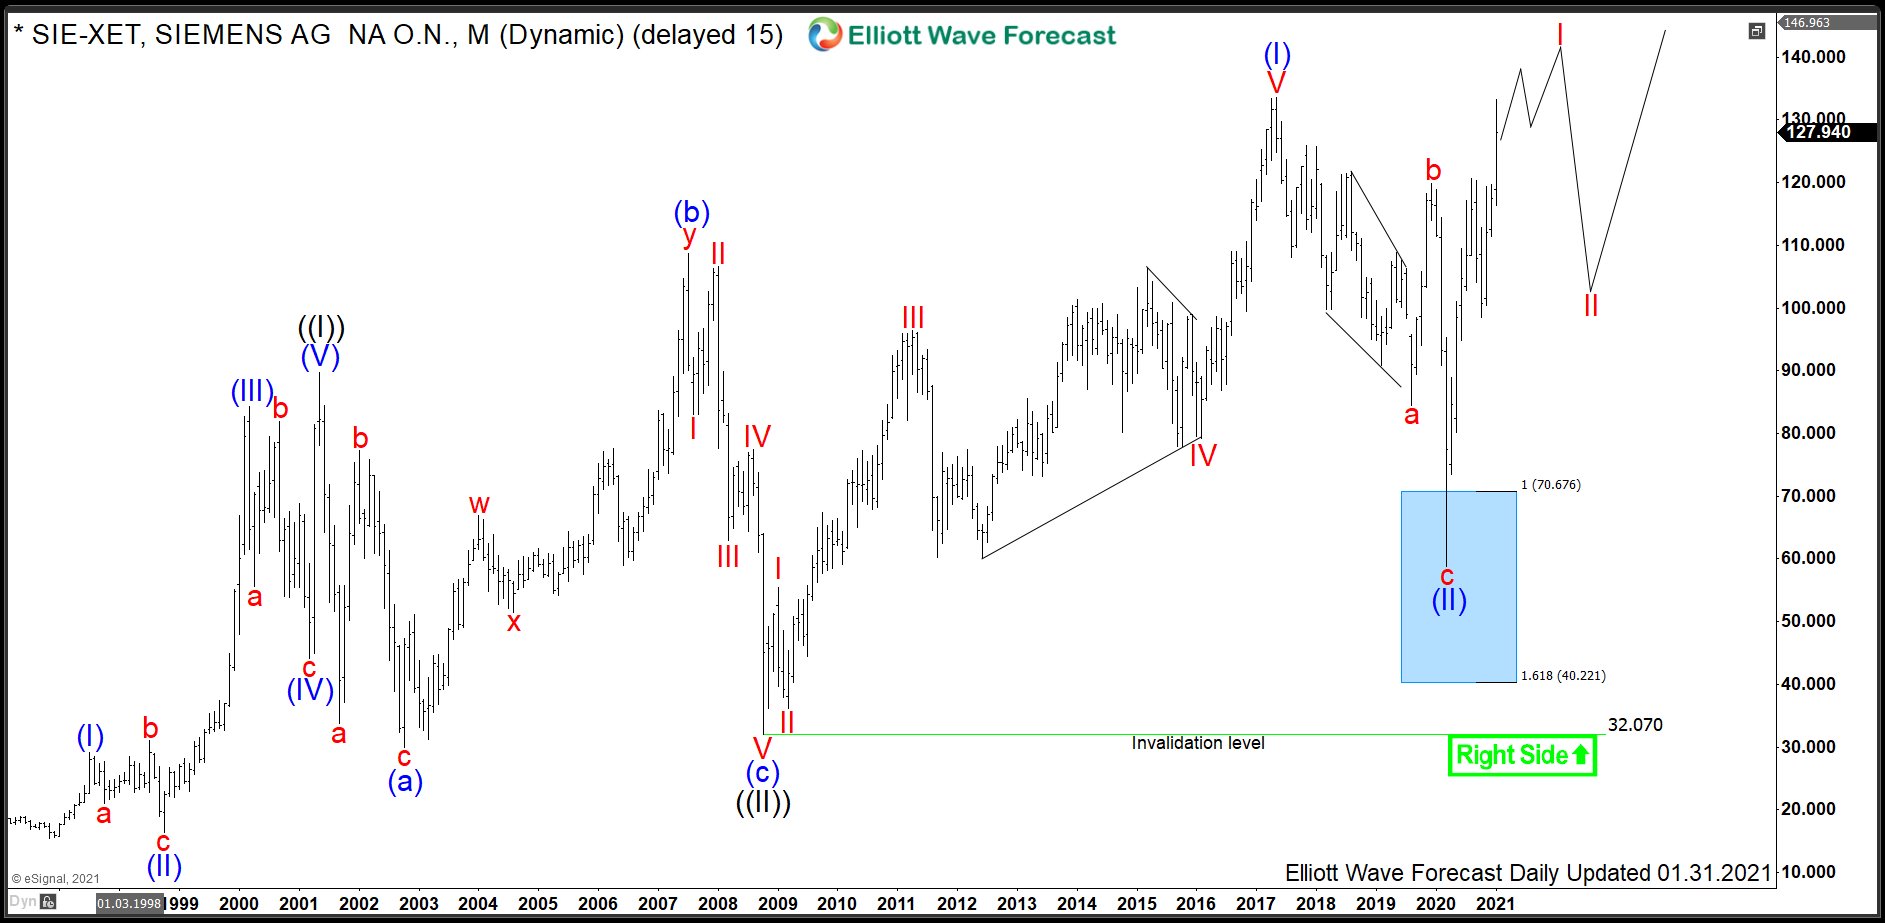
$SIE : Manufacturing Giant Siemens Should Continue Rally
Read MoreSiemens SE is a German multinational conglomerate company and by revenue the largest industrial manufacturing enterprise in Europe. Company’s principal business divisions are Industry, Energy, Healthcare, Infrastructure & Cities. Founded in 1847 and headquartered in Munich, Germany, the company employs approx. 385’ooo people worldwide. Siemens is a part of both DAX30 and of SX5E indices. […]