

The Power of 3-7-11 and the Grand Super Cycle: How We Saw the Bullish Turn in April 2025 Back on April 9, 2025, while World Indices were dropping sharply and global sentiment had turned overwhelmingly bearish, we published an article that challenged the fear-driven narrative. We explained why selling was not the right approach and […]
-
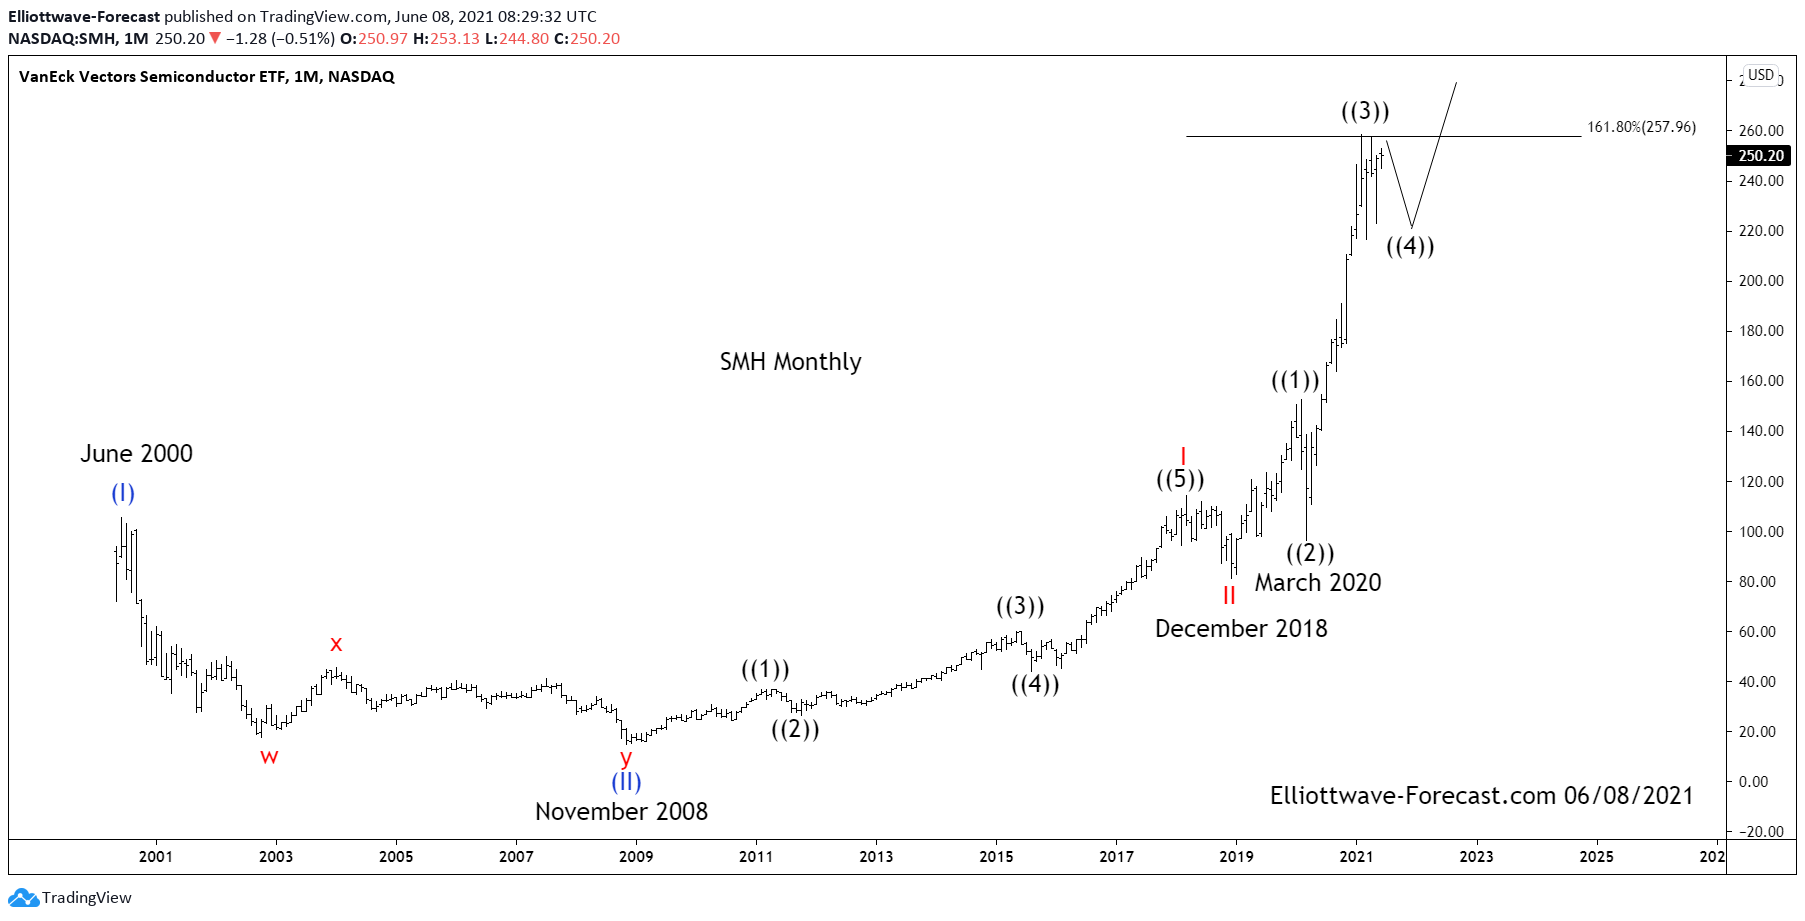
$SMH Semiconductors Elliott Wave & Longer term Cycles
Read More$SMH Semiconductors Elliott Wave & Longer term Cycles Firstly as seen on the monthly chart shown below. There is data back to May 2000 in the ETF fund. Data suggests the fund made a low in November 2008. This low has not been taken out in price. The cycles in this instrument tends to reflect the […]
-
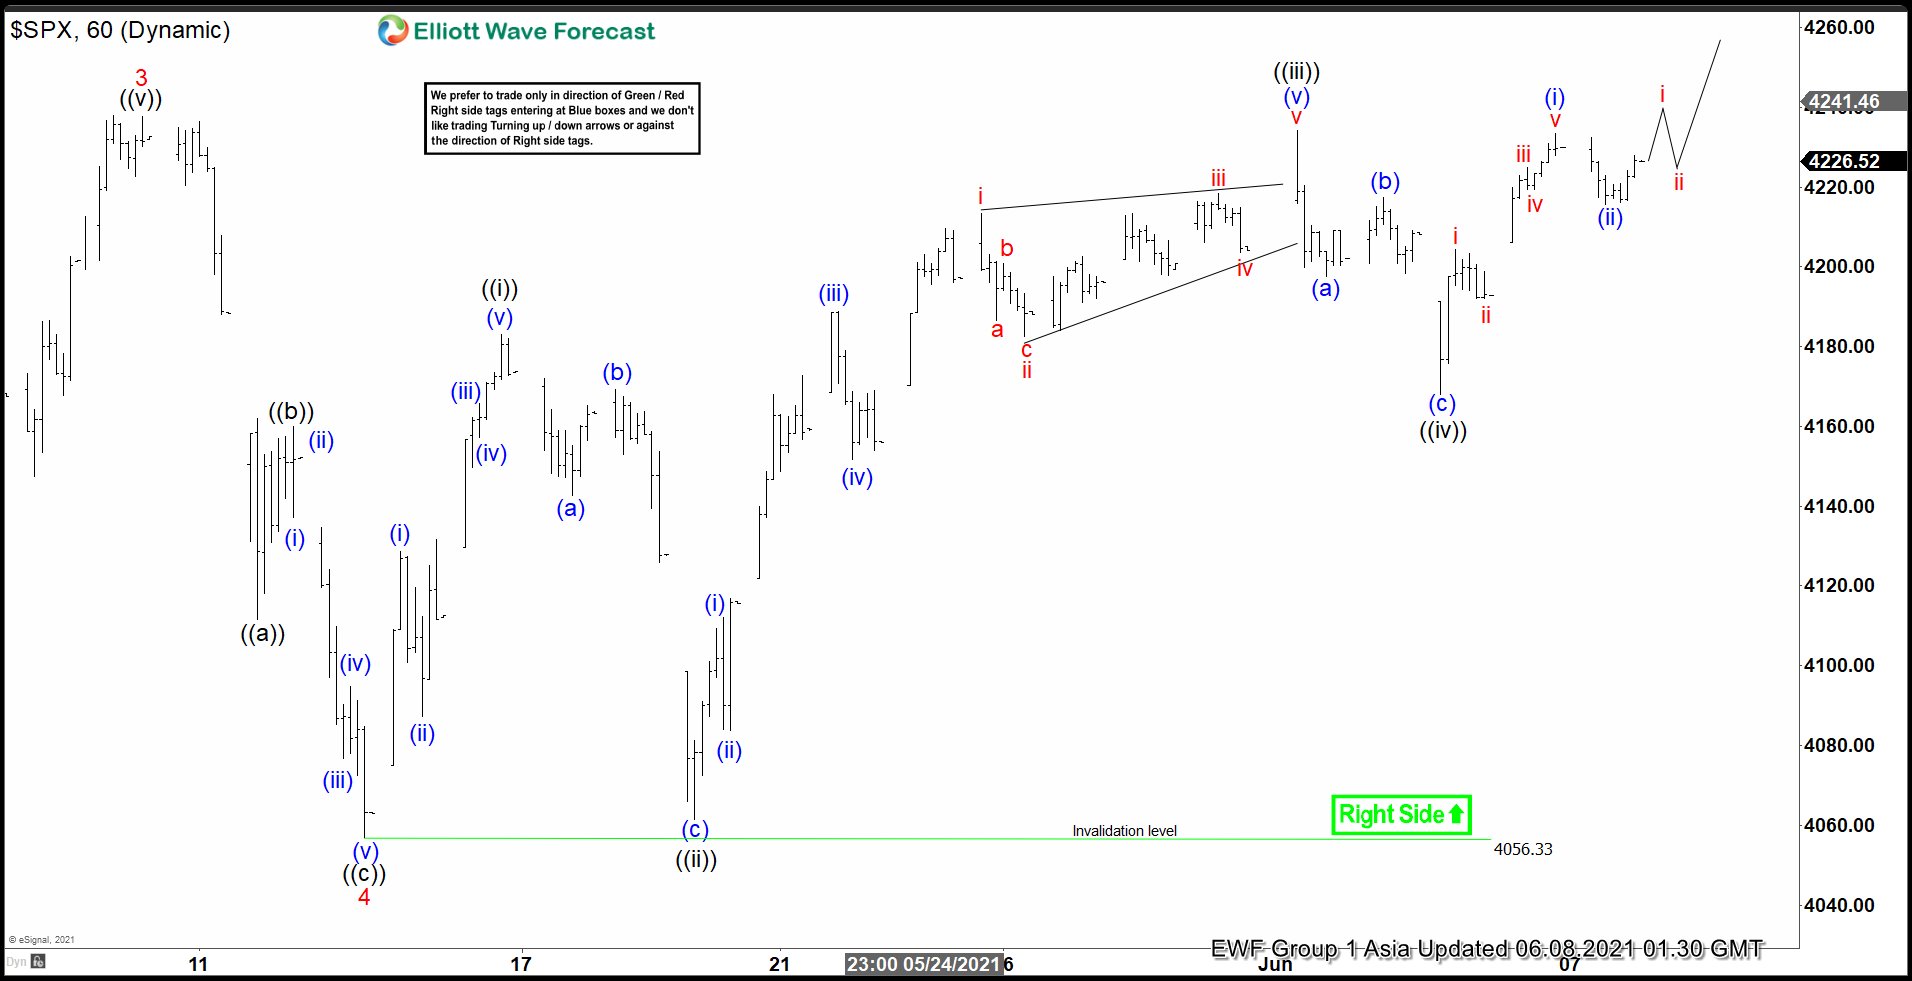
Elliott Wave View: SPX (S&P 500) Wave 5 In Progress
Read MoreS&P 500 (SPX) is within wave 5 in an impulse rally with further upside to end. This article and video look at the Elliott Wave path for the Index.
-
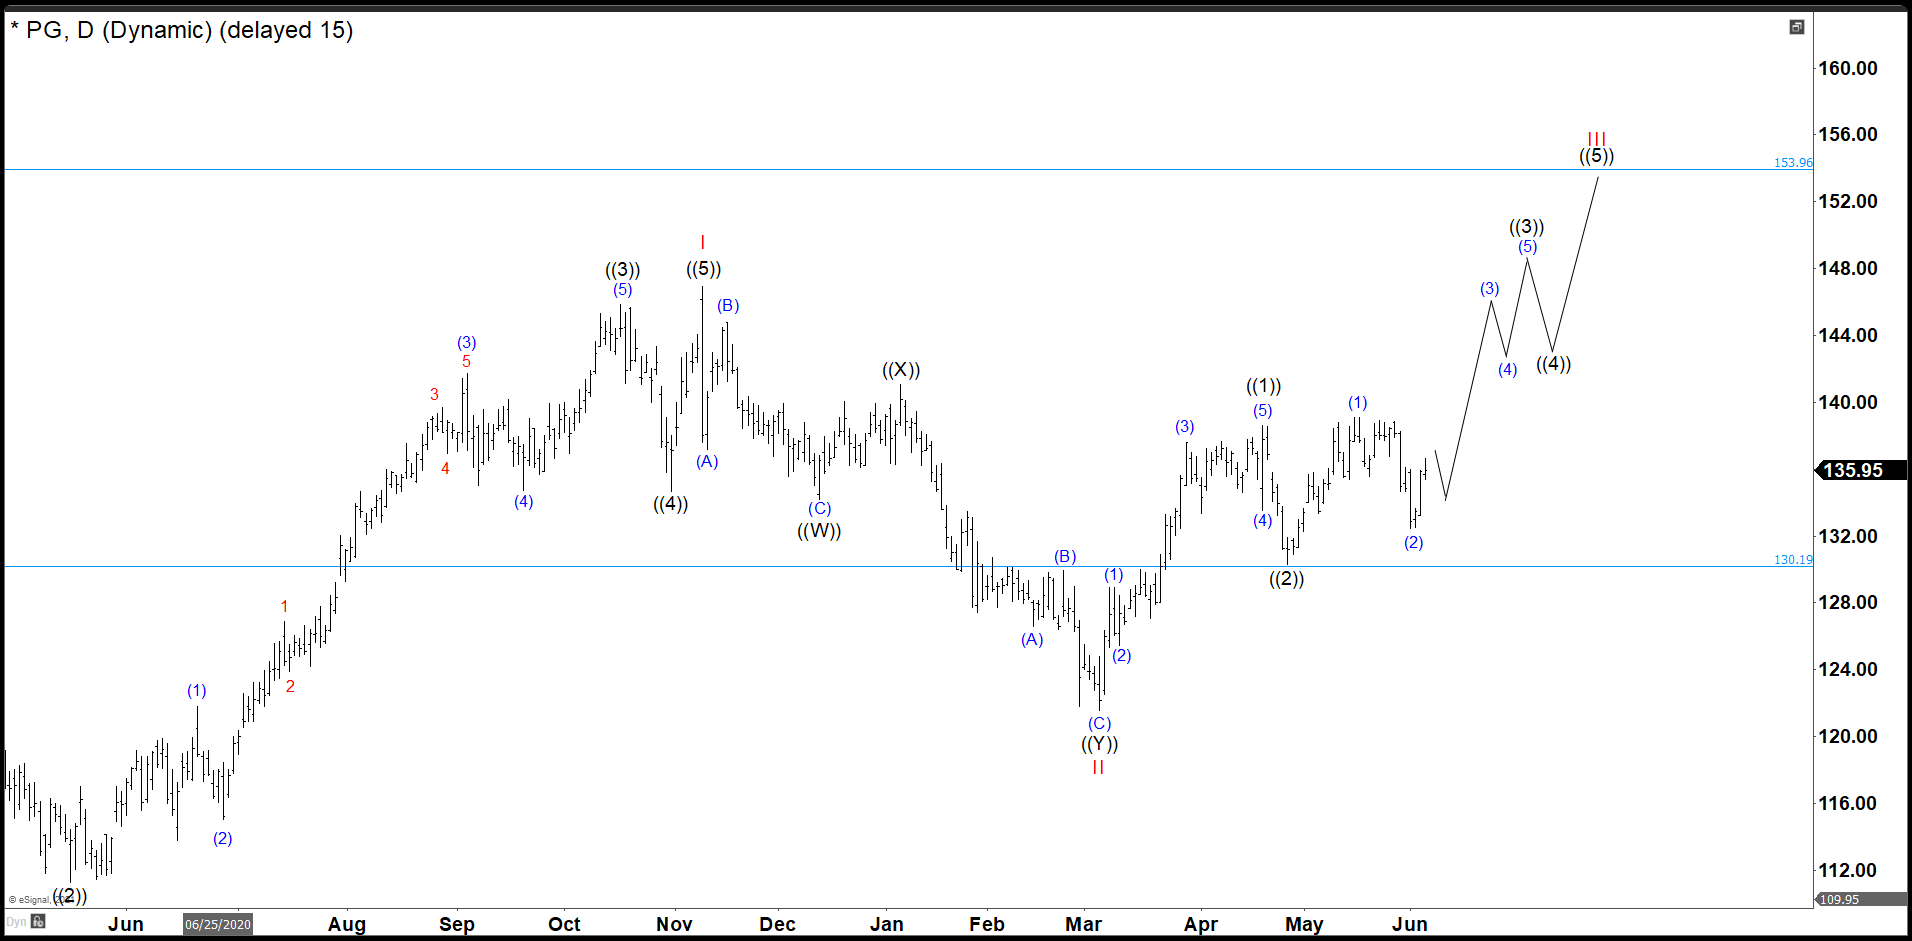
P&G Is Still On Track In Wave ((3)) Pullback Was Deep
Read MoreSince the crash of March 2020, all stocks have tried to recover what they lost and P&G was no exception. P&G did not only recover the lost, but It also reached historic highs. Now, we are going to try to build an impulse from wave II with a first target to $154.00 next $167.50 and […]
-
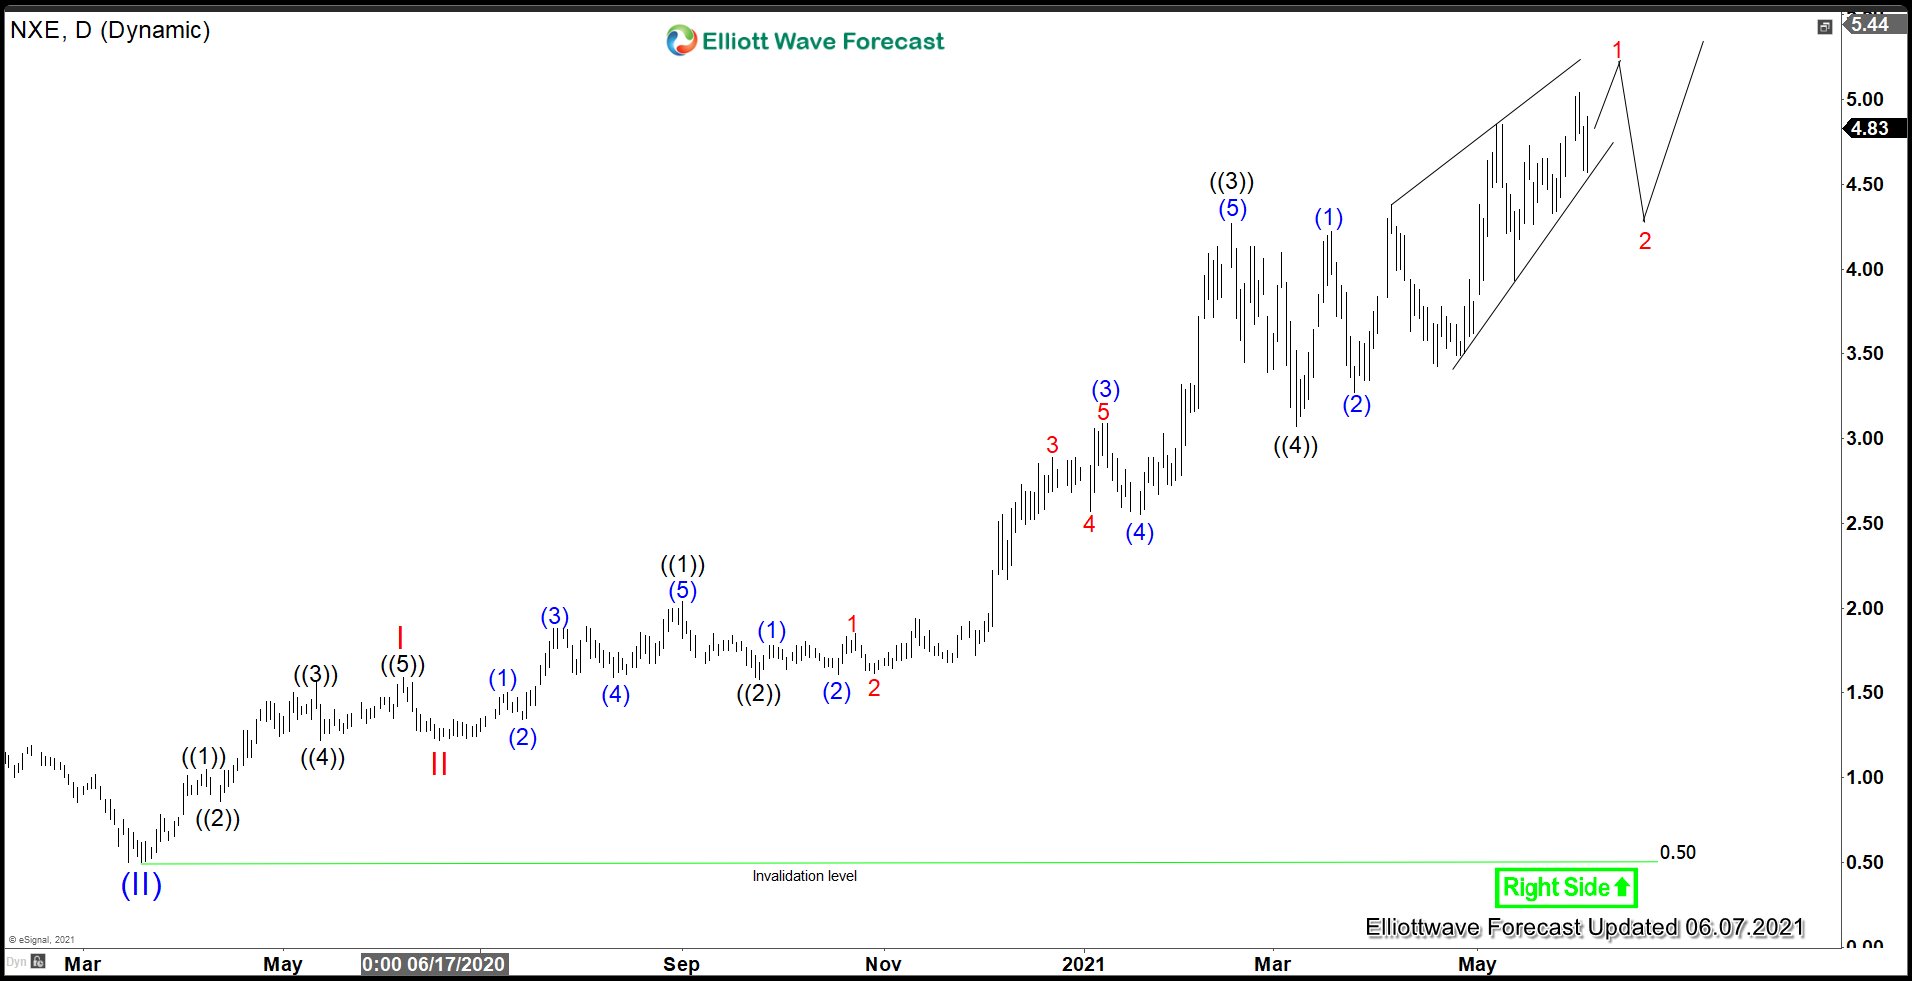
NexGen Energy (NXE) Rallies Impulsively in Bullish Uranium Market
Read MoreNexGen Energy (NXE) is a Canada-based company with a focus on acquisition, exploration, and development of Canadian uranium projects. The company owns a portfolio of prospective uranium exploration assets in Athabasca Basin, which are some of the largest in the world. The stock has dropped 80% from its 2017 high to $0.50 / share at […]
-

Elliott Wave View: Russell 2000 Aiming for All-Time High
Read MoreRussell 2000 has started to rally and aiming to break to new all time high. This article and video look at the Elliott Wave path.
-
Top Stock Indicators for Stock Trading
Read MoreTraders who appreciate technical metrics as stock market indicators usually are more suited to manage the capital/financial markets than those who do not. Although personal investment objectives, risk tolerance, and trading style can help decide a plan and trading approach, understanding which technical metrics to include in your method will play a role in determining […]