

The Power of 3-7-11 and the Grand Super Cycle: How We Saw the Bullish Turn in April 2025 Back on April 9, 2025, while World Indices were dropping sharply and global sentiment had turned overwhelmingly bearish, we published an article that challenged the fear-driven narrative. We explained why selling was not the right approach and […]
-
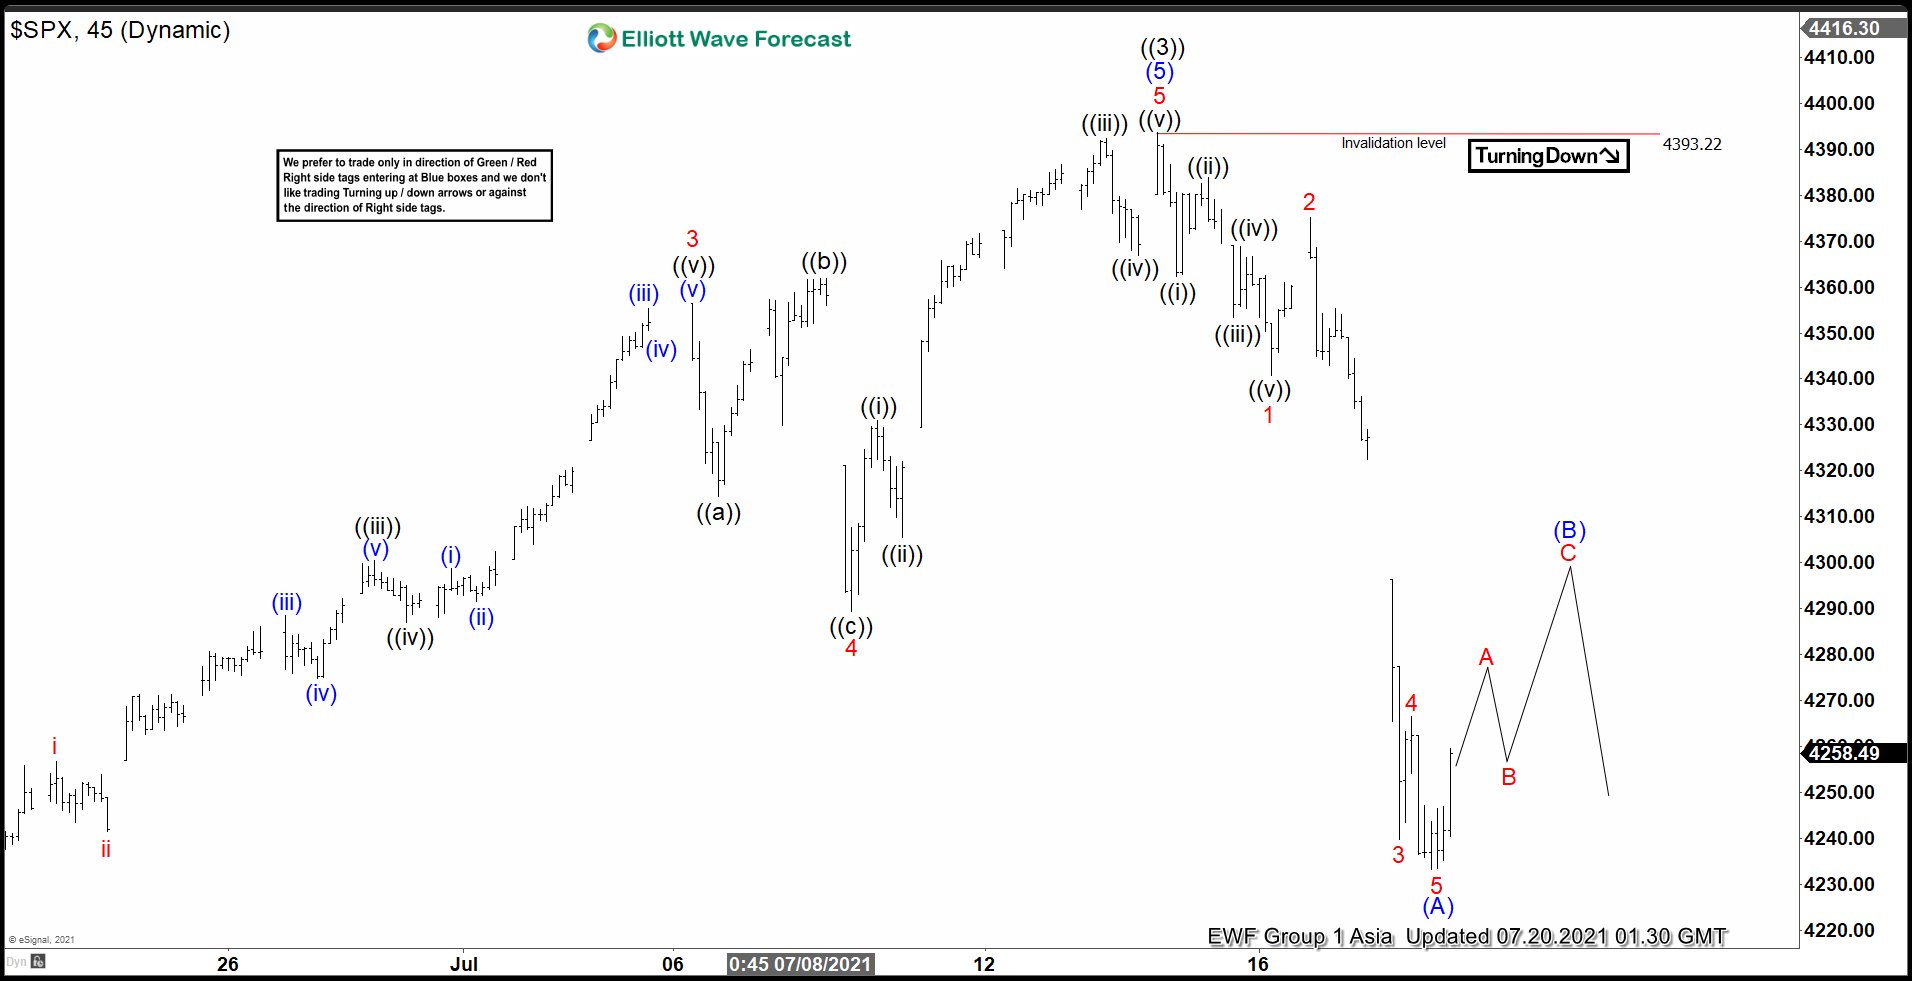
Elliott Wave View: SPX Correcting Larger Degree Cycle
Read MoreS&P 500 (SPX) has ended larger degree from September 2020 low. Index is now correcting this cycle and this article and video look at the Elliott Wave path.
-
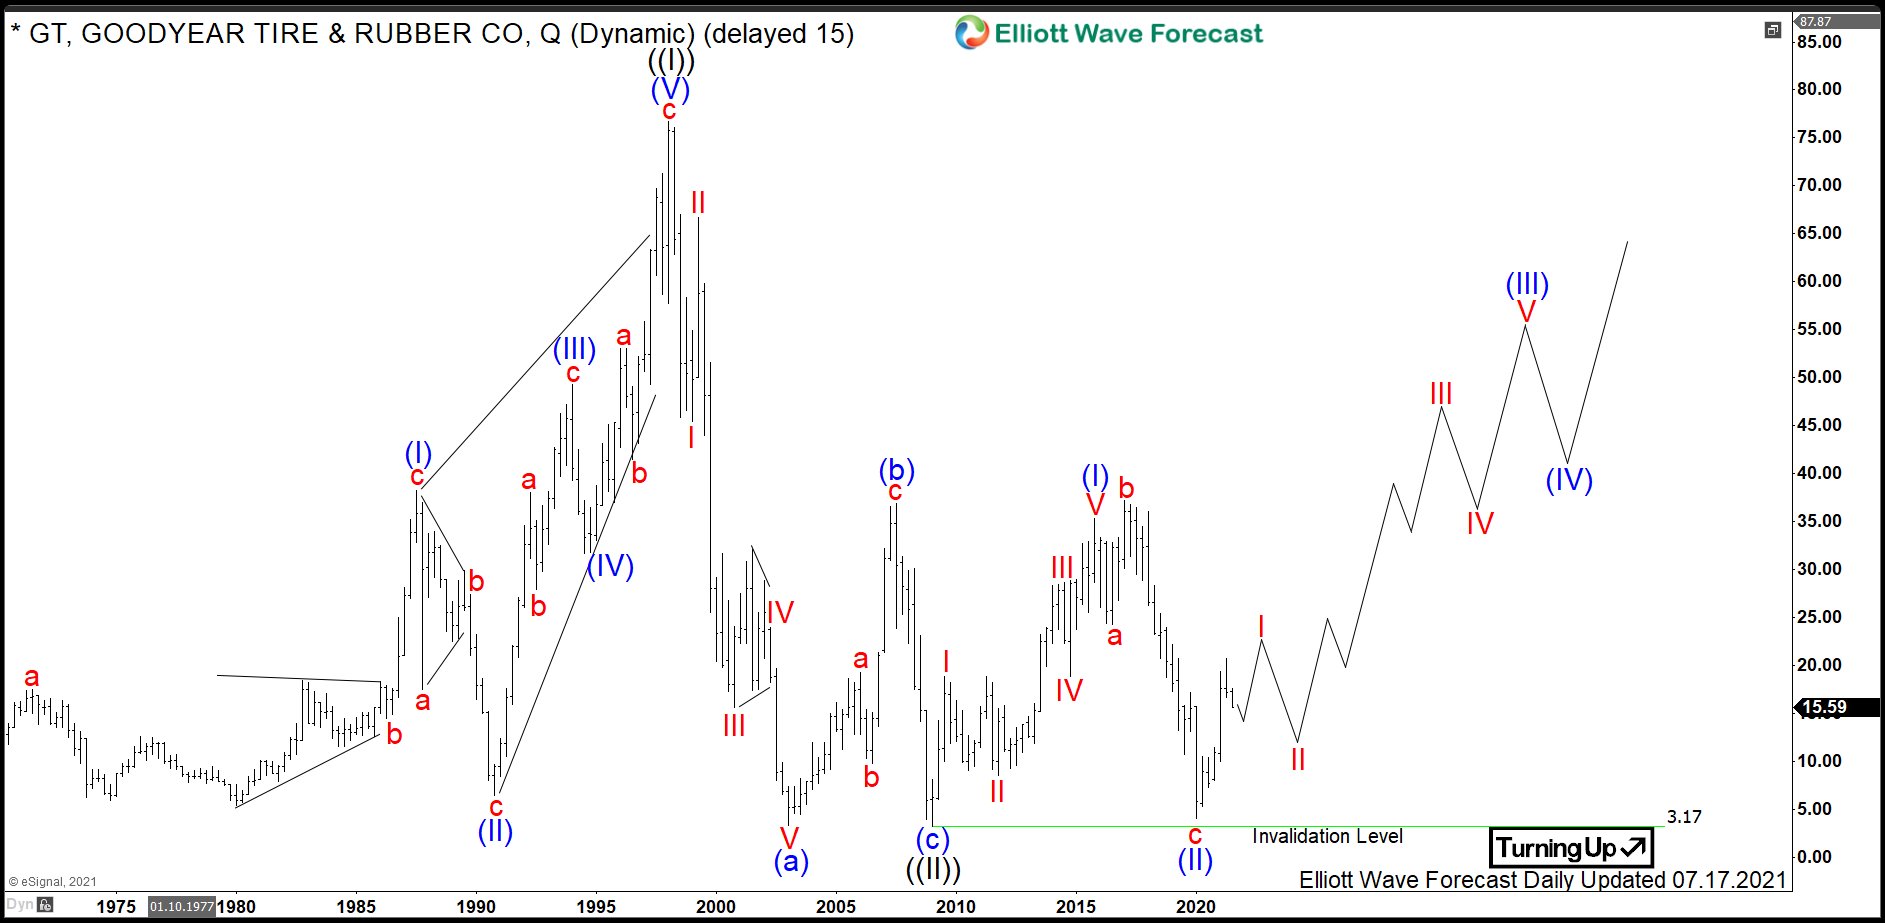
$GT : Goodyear Tire and Rubber Company Ramping Up
Read MoreGoodyear Tire and Rubber Company is a multinational tire manufacturing company based in Akron, Ohio, USA. The stock being a component of the S&P MidCap 400 index can be traded under ticker $GT at NASDAQ. As a matter of fact, Goodyear manufactures tires for automobiles, commercial trucks, light trucks, motorcycles, SUVs, race cars, airplanes, farm […]
-

14 Best Undervalued Stocks to Buy in 2024
Read MoreInvestors who earn more than the market are usually those who invest in stocks that are healthy and cheap. This is a smart strategy to buy low and sell high. Investing in undervalued stocks has been one of the most common practice to outperform the market. An undervalued stock has a lower market value than […]
-
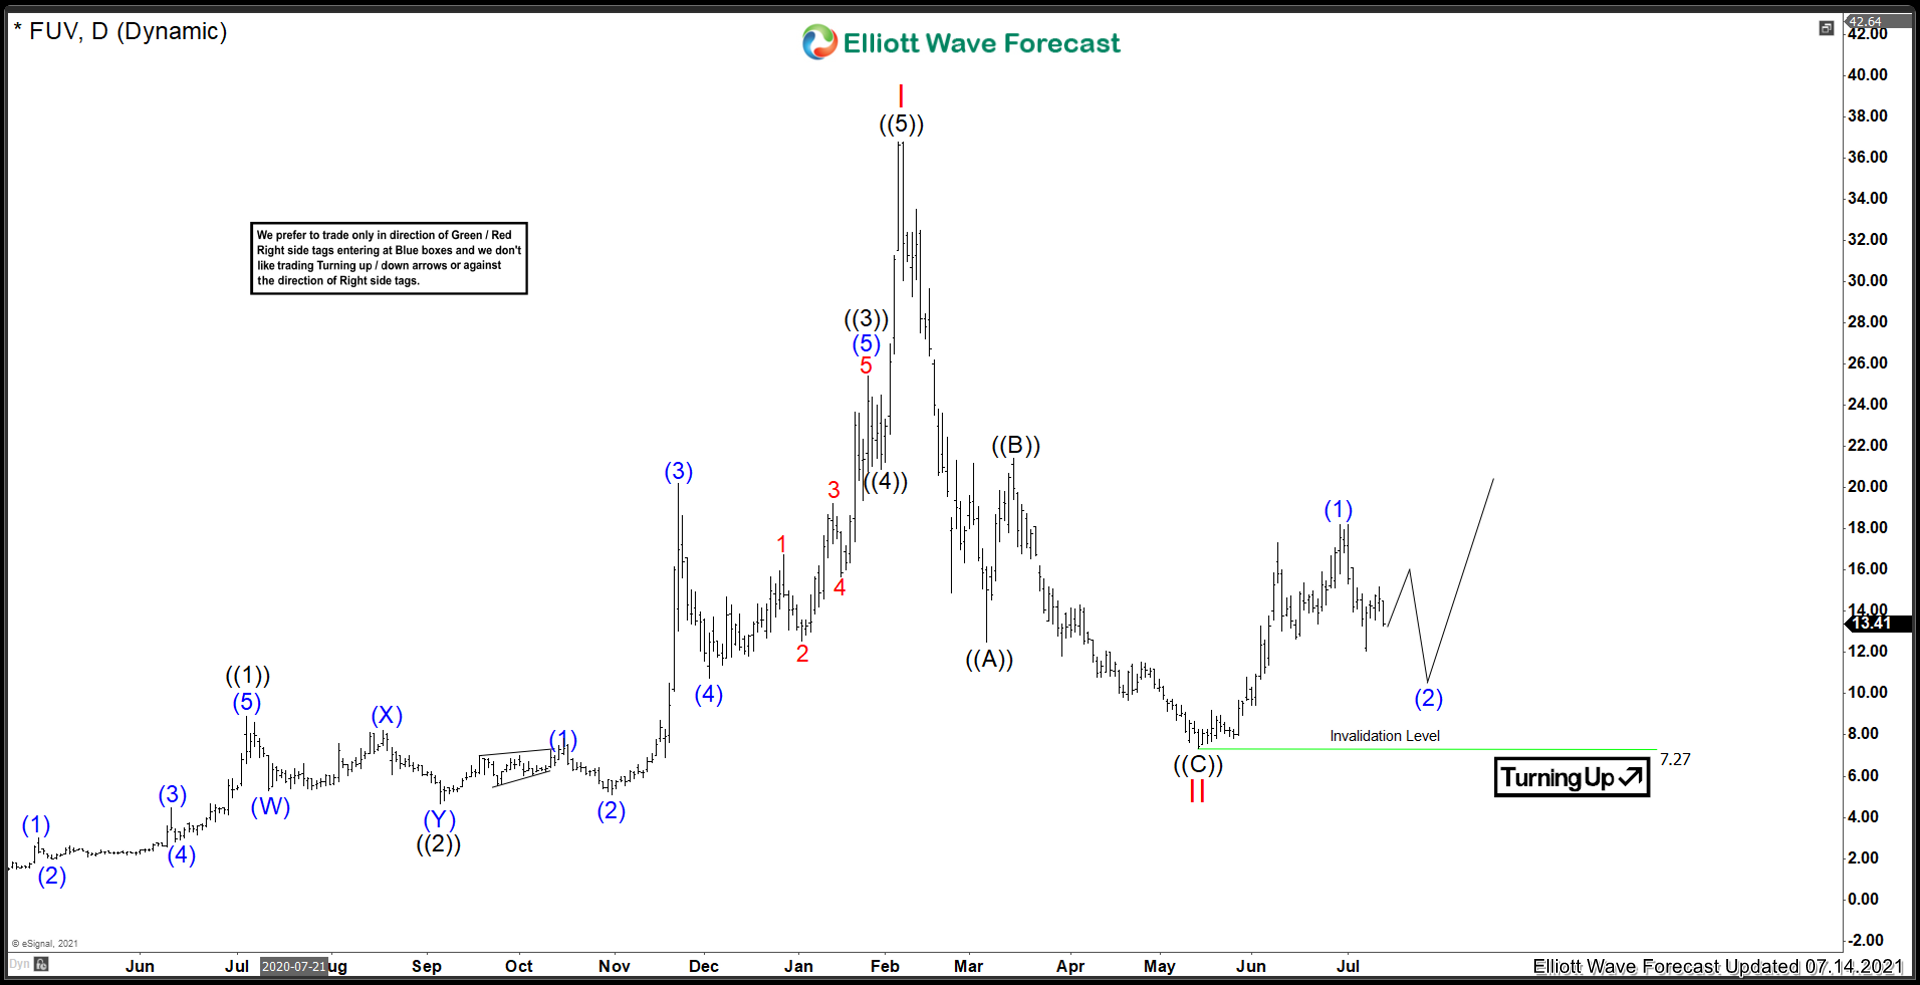
Arcimoto Inc. ($FUV) Long Term Low In Place
Read MoreLets revisit Arcimoto and see what the Elliottwave analysis presents. When I previously analyzed this stock, I was expecting one final leg higher before a sizable correction took place. In summary, Arcimoto is an electric vehicle company headquartered in Eugene, Oregon. Arcimoto manufactures and sells the Fun Utility Vehicle, or FUV, a tandem two-seat, three-wheeled electric vehicle. They […]
-
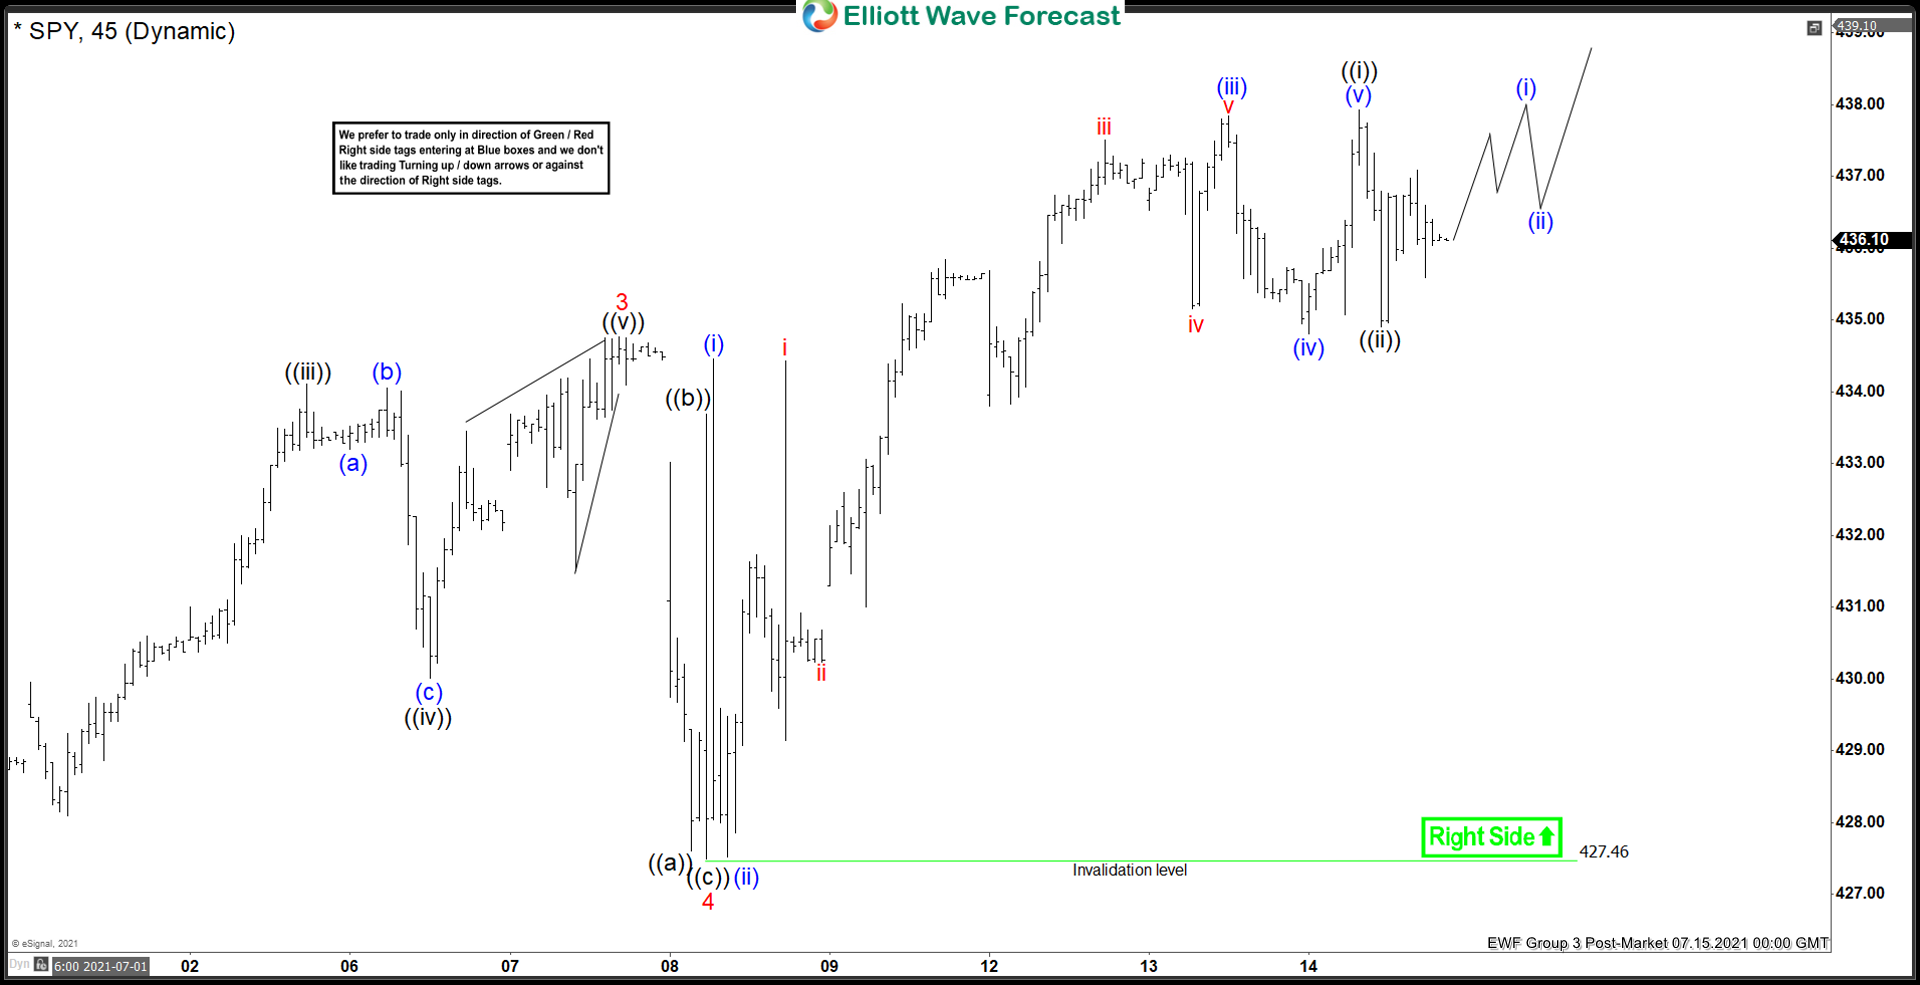
Elliott Wave View: SPY Ending Wave 5 Soon
Read MoreSPY cycle from May 13 low is unfolding as 5 waves and about to end wave 5. This article and video look at the Elliott Wave path for the ETF.
-
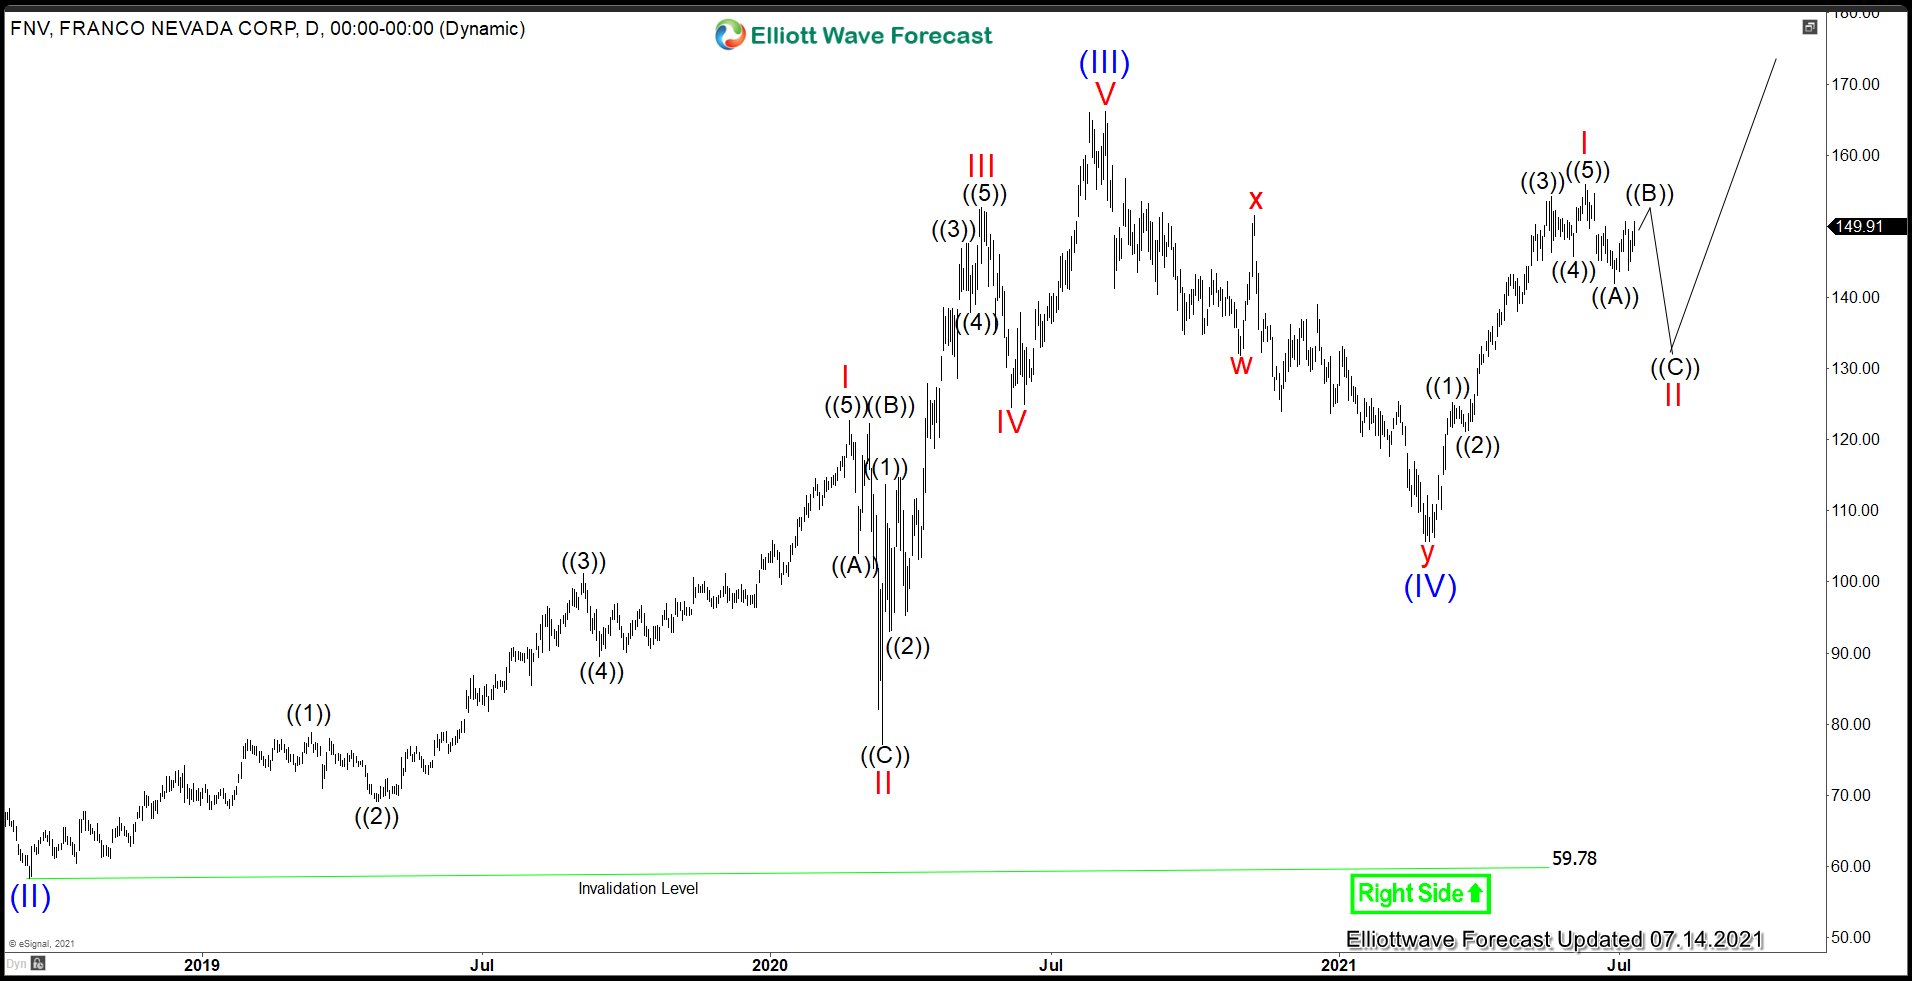
Franco Nevada (FNV) Correcting Cycle from March 2021 Low
Read MoreFranco Nevada (ticker: FNV) is a leading gold royalty and stream company with one of the largest and most diversified portfolio of cash flow-producing assets. The company’s business model provides investors with gold price and exploration optionality while limiting exposure to many of the risks of operating companies. Franco-Nevada is debt free and uses the company’s […]